Rajat Konerkoner@dbs.ifi.lmu.com1
Poulami Sinhamahapatrapoulami.sinhamahapatra@iks.fraunhofer.de2
Karsten Roscherkarsten.roscher@iks.fraunhofer.de2
Stephan Günnemannguennemann@in.tum.de3
Volker Trespvolker.tresp@siemens.com14
Ludwig Maximilian University, Munich,
Germany
Fraunhofer IKS, Fraunhofer Institute for Cognitive Systems IKS, Munich,
Germany
Technical University of Munich,
Germany
Siemens AG, Munich,
Germany
OODformer: Out-Of-Distribution Detection Transformer
OODformer: Out-Of-Distribution Detection Transformer
Abstract
A serious problem in image classification is that a trained model might perform well for input data that originates from the same distribution as the data available for model training, but performs much worse for out-of-distribution (OOD) samples. In real-world safety-critical applications, in particular, it is important to be aware if a new data point is OOD. To date, OOD detection is typically addressed using either confidence scores, auto-encoder based reconstruction, or contrastive learning. However, the global image context has not yet been explored to discriminate the non-local objectness between in-distribution and OOD samples. This paper proposes a first-of-its-kind OOD detection architecture named OODformer that leverages the contextualization capabilities of the transformer. Incorporating the transformer as the principal feature extractor allows us to exploit the object concepts and their discriminatory attributes along with their co-occurrence via visual attention. Based on contextualised embedding, we demonstrate OOD detection using both class-conditioned latent space similarity and a network confidence score. Our approach shows improved generalizability across various datasets. We have achieved a new state-of-the-art result on CIFAR-10/-100 and ImageNet30. Code is available at : https://github.com/rajatkoner08/oodformer.
1 Introduction
Deep learning has been shown to give excellent results when the data in an application comes from the same distribution as the data that was available for model training, also called in-distribution (ID) data. Unfortunately, performance might deteriorate drastically for out-of-distribution (OOD) data. The reason why application data might be OOD can be manifold and is often attributed to complex distributional shifts, the appearance of an entirely new concept, or random noise coming from a faulty sensor. As deep learning becomes the core of many safety-critical applications like autonomous driving, surveillance system, and medical applications, distinguishing ID from OOD data is of paramount importance.
The recent progress in generative modelling and contrastive learning has led to a significant advancement in various OOD detection methods. [Liang et al.(2017)Liang, Li, and Srikant, Hsu et al.(2020)Hsu, Shen, Jin, and Kira] improved softmax distribution for outlier detection. [Tack et al.(2020)Tack, Mo, Jeong, and Shin, Winkens et al.(2020)Winkens, Bunel, Roy, Stanforth, Natarajan, Ledsam, MacWilliams, Kohli, Karthikesalingam, Kohl, Cemgil, Eslami, and Ronneberger, Sehwag et al.(2021)Sehwag, Chiang, and Mittal] used contrastive learning for OOD detection. The common idea in these works is that in a contrastively trained network, similar objects will have similar embeddings while dissimilar objects will be repelled by the contrastive loss. However, these approaches often require fine-tuning with OOD data or rely on several negative samples and often suffer from inductive biases prevalent in convolution based architectures. Hence, it is difficult to train and deploy them out-of-the-box. This motivates us to go beyond the conventional practice of using negative samples or inductive biases in designing an OOD detector. Along this line, we argue that systematic exploitation of global image context presents a potential alternative to obtain a semantically compact representation. To systematically exploit the global image context, we leverage the multi-hop context accumulation of the vision-transformer (ViT) [Dosovitskiy et al.(2020)Dosovitskiy, Beyer, Kolesnikov, Weissenborn, Zhai, Unterthiner, Dehghani, Minderer, Heigold, Gelly, et al.].
Transformer’s visual attention significantly outperforms convolutional architectures on various image-classification [Dosovitskiy et al.(2020)Dosovitskiy, Beyer, Kolesnikov, Weissenborn, Zhai, Unterthiner, Dehghani, Minderer, Heigold, Gelly, et al., Touvron et al.(2020)Touvron, Cord, Douze, Massa, Sablayrolles, and Jégou], object-detection [Carion et al.(2020)Carion, Massa, Synnaeve, Usunier, Kirillov, and Zagoruyko], relationship-detection [Koner et al.(2020)Koner, Sinhamahapatra, and Tresp, Koner et al.(2021b)Koner, Sinhamahapatra, and Tresp] and other vision-oriented task [Liu et al.(2021)Liu, Lin, Cao, Hu, Wei, Zhang, Lin, and Guo, Hildebrandt et al.(2020)Hildebrandt, Li, Koner, Tresp, and Günnemann, Caron et al.(2021)Caron, Touvron, Misra, Jégou, Mairal, Bojanowski, and Joulin, Koner et al.(2021a)Koner, Li, Hildebrandt, Das, Tresp, and Günnemann]. However, transformer’s ability to act as a generalized OOD detector remains unexplored so far. As a suitable transformer candidate, we investigate the emerging transfomer architecture in image-classification tasks, namely the Vision Transformer (ViT) [Dosovitskiy et al.(2020)Dosovitskiy, Beyer, Kolesnikov, Weissenborn, Zhai, Unterthiner, Dehghani, Minderer, Heigold, Gelly, et al.], and its data-efficient variant DeiT [Touvron et al.(2020)Touvron, Cord, Douze, Massa, Sablayrolles, and Jégou].ViT explores the global context of an image and its feature-wise correlations that are extracted from small image patches using visual attention. Intuitively, the difference between an ID and OOD is a small-to-large perturbation in form of the incorrect ordering or corruption (incl. insertion or deletion). Thus, we argue that capturing class/object attribute interaction is important for OOD detection, which we have implemented via a transformer.
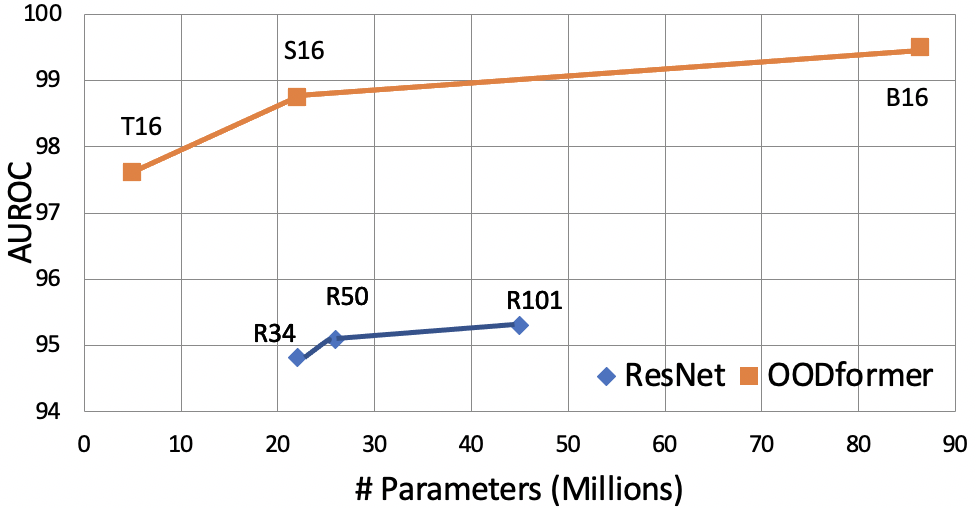
To the best of our knowledge, we are the first to propose and investigate the role of global context and feature correlation using the vision transformer to generalise data in terms of OOD detection. Our key idea is to train ViT with an ID data set and use the similarity of its final representative embedding for outlier detection. Through the patch-wise attention on the attributes, we aim to reach a discriminatory embedding that is able to distinguish between ID and OOD. First, we follow a formal supervised training of ViT with an in-distribution data set using cross-entropy loss. In the second step, we extract the learned features from the classification head ( token) and calculate a class conditioned distance metric for OOD detection. Our experiment exhibits that softmax confidence prediction from the ViT is more generalisable in terms of OOD detection than the same from the convolutional counterpart. We also observe that the former overcomes multiple shortcomings of the latter, e.g., poor margin probabilities [Elsayed et al.(2018)Elsayed, Krishnan, Mobahi, Regan, and Bengio, Liu et al.(2016)Liu, Wen, Yu, and Yang]. Figure 1, illustrates our claim that, even with much fewer parameters, transformer-based architecture performs significantly better compared to traditional convolution-based architecture. This shows the superiority of the transformer in the outlier detection task.
We evaluate the effectiveness of our model on several data sets such as CIFAR-10, CIFAR-100 [Krizhevsky et al.(2009)Krizhevsky, Hinton, et al.], ImageNet30 [Hendrycks et al.(2019b)Hendrycks, Mazeika, Kadavath, and Song] with multiple setting (e.g., class conditioned similarity, softmax score). Our model outperforms the convolution baseline and other state-of-the-art models in all settings by a large margin. Finally, we have conducted an extensive ablation study to strengthen the understanding of the generalizability of ViT and the impact of the shift in data. In summary, the key contributions of this paper are:
-
•
We model the OOD task as an object-attribute-based compact semantic representation learning. In this context, we are the first to propose a vision-transformer-based OOD detection framework named OODformer and thoroughly investigate its efficiency.
-
•
We probe extensively into the learned representation to verify the proposed method’s efficacy using both class-conditioned embedding-based and softmax confidence score-based OOD detection.
-
•
We provide an in-depth analysis of the learned attention map, softmax confidence, and embedding properties to intuitively interpret the OOD detection mechanism.
-
•
We have achieved state-of-the-art results for numerous challenging datasets like CIFAR-10, CIFAR-100, and ImageNet30 with a significantly large gain.
2 Related Work
OOD detection approaches can be classified into a number of categories. The first and most intuitive approach is to classify the OOD sample using a confidence score derived from the network. [Hendrycks and Gimpel(2018)] propose max softmax probability, consecutively improved by ODIN using temperature scaling [Liang et al.(2017)Liang, Li, and Srikant]. [Lee et al.(2018)Lee, Lee, Lee, and Shin] utilised Mahalanobis distance and [Hsu et al.(2020)Hsu, Shen, Jin, and Kira] improved ODIN without using OOD data even further. Other density approximation-based generative modelling [Ren et al.(2019)Ren, Liu, Fertig, Snoek, Poplin, Depristo, Dillon, and Lakshminarayanan, Serrà et al.(2019)Serrà, Álvarez, Gómez, Slizovskaia, Núñez, Luque, Slizovskaia, José, Nú, ñ, ez, and Luque, Nalisnick et al.(2019)Nalisnick, Matsukawa, Teh, Gorur, and Lakshminarayanan] also contributed in this approach. [Charpentier and Günnemann(2020)] also shown density based uncertainty estimation could also be used for OOD detection. A second direction towards OOD detection is to train a generative model for likelihood estimation. [Zong et al.(2018)Zong, Song, Min, Cheng, Lumezanu, Cho, and Chen, Pidhorskyi et al.(2018)Pidhorskyi, Almohsen, and Doretto] focuses on learning representations of training samples, using a bottleneck layer for efficient reconstruction and generalisation of samples. Another advancement on OOD detection is based on self-supervised [Chen et al.(2020a)Chen, Kornblith, Norouzi, and Hinton, Chen et al.(2020b)Chen, Kornblith, Swersky, Norouzi, and Hinton, Li et al.(2020)Li, Zhou, Xiong, Socher, and Hoi, Chen et al.(2020c)Chen, Fan, Girshick, and He] or supervised [Khosla et al.(2020)Khosla, Teterwak, Wang, Sarna, Tian, Isola, Maschinot, Liu, and Krishnan, Chuang et al.(2020)Chuang, Robinson, Yen-Chen, Torralba, and Jegelka] contrastive learning. It aims on learning effective discriminatory representations by forcing the network to learn similar representations for similar semantic classes while repelling the others. This property has been utilised by many recent works [Tack et al.(2020)Tack, Mo, Jeong, and Shin, Winkens et al.(2020)Winkens, Bunel, Roy, Stanforth, Natarajan, Ledsam, MacWilliams, Kohli, Karthikesalingam, Kohl, Cemgil, Eslami, and Ronneberger, Sehwag et al.(2021)Sehwag, Chiang, and Mittal] for OOD detection. The common idea in these works is that in a contrastively trained network, semantically closer objects from ID samples will have similar representation, whereas OOD samples would be far apart in the embedding space.
3 Attention-based OOD detection
In this section, the OOD detection problem is presented followed by a brief background about vision transformer, and the feature similarity-based outlier detection. As OOD labels may not be available for most scenarios, our method primarily relies on a similarity score-based detection.
3.1 Problem Decomposition : OOD Detection
Let a training sample with dimensions and let be its class label, where is number of classes. For a given neural feature extractor (), learned feature vector is obtained as . Finally we get posterior class probabilities as , where and . and are two learned functions that map an image from data space to feature space and then derive the posterior probability distribution. In a real world setting, data drawn from in an application may not follow the same distribution as the training samples (). We refer these data as OOD (). A question now is to what extent OOD data diverges from an ID in their representations? A second question is the reliability of the prediction of the posterior probability distributions for OOD data. To quantify the shift in data from the ID samples, we compute the similarity of the embedding between the samples ( or ) and the nearest ID class mean. In an ideal scenario, this representational similarity should be much less for OOD () than ID (). Also, its softmax confidence should be significantly lower than that of ID samples, allowing the use of a simple threshold to distinguish between ID and OOD samples.
3.2 Feature extraction: Vision Transformer
In our work we employ the Vision Transformer (ViT) [Dosovitskiy et al.(2020)Dosovitskiy, Beyer, Kolesnikov, Weissenborn, Zhai, Unterthiner, Dehghani, Minderer, Heigold, Gelly, et al.] and its data efficient variant DeiT [Touvron et al.(2020)Touvron, Cord, Douze, Massa, Sablayrolles, and Jégou]; they use an identical transformer encoder [Vaswani et al.(2017)Vaswani, Shazeer, Parmar, Uszkoreit, Jones, Gomez, Kaiser, and Polosukhin] architecture with the same configuration. However, ViT uses ImageNet-21K for pre-training, whereas DeiT uses more robust data augmentation and is only trained with ImageNet. The encoder of ViT takes only a 1D sequence of tokens as input. However, to handle a 2D image with height and width , it divides the image into number of small 2D patches and flattened into a 1D sequence , where is the number of channels, is the resolution of each patch and is the number of sequences obtained as . A token () similar to BERT [Devlin et al.(2018)Devlin, Chang, Lee, and Toutanova] prepended (first position in sequence) to the sequence of patch embeddings, as expressed in Eq.1,
| (1) |
where are learnable embedding of dimension. is the linear projection layer of dimension for a patch embedding (e.g., ). The token embedding () from the final layer of the encoder is used for classification. This classification token serves as a representative feature from all patches accumulated using global attention.
At the heart of each encoder layer (for details, see supplementary) lies a multi-head self-attention (MSA) and a multi-layer perception (MLP) block. The MSA layers provide global attention to each image patch; thus, it has less inductive bias for local features or neighbourhood patterns than a CNN. One image patch or a combination thereof represents either a semantic or spatial attribute of an object. Therefore, we hypothesise that cumulative global attention on these patches would be helpful to encode discriminatory object features. Positional embedding () of the encoder is also beneficial for learning the relative position of a feature or a patch. Subsequently, a local MLP block makes those image features translation invariant. This combination of MSA and MLP layers in an encoder jointly encodes the attributes’ importance, associated correlation, and co-occurrence. In the end, token, being a representative of an image , consolidate multiple attributes and their related features via the global context, which is helpful to define and classify a specific object category.
The [] token from the final layer is used for OOD detection in two ways; first, it is passed to for softmax confidence score, and second it is used for latent space distance calculation as described in next section.
3.3 OOD detection
For an OOD sample, one or more attributes of the object are assumed to be different (e.g. corrupted or new attributes). Hence, an OOD sample should lie in a distribution that has significant distributional shift from training samples. We assume these shifts in data would be captured by the representational features extracted from the ViT. We quantify this variation of features or attributes compared to ID samples using 1) a distance metric on the latent space embedding and 2) softmax confidence score.
Distance in Latent Space: Multiple attributes of an object can be found in different spatial locations of an image. In vision transformer, image patches are ideal candidates for representing each of the individual attributes. Global information contextualisation from these attributes plays a crucial role in the classification of an object (see Sec. 4.2). Supervised learning (e.g.,cross-entropy) should benefit by an accumulation of object-specific semantic cues through token for such global attributes and their context. This incentivises implicit clustering of object classes that have similar attributes and features, which are favourable for generalisation. To take advantage of attribute similarities, we compute class-wise distance over the activation of token. First, we compute the mean () of all class categories present in the training samples. Second, for a test sample, we compute the distance between its embedding from the mean embedding of each class. Finally, the test sample is classified as OOD if its distance is more than the threshold () to its nearest class. We have used the Mahalanobis distance metric for our experiment. The output from a representative token is normalised with the transformer default layer normalisation [Ba et al.(2016)Ba, Kiros, and Hinton] for every token. It makes the embedding distribution normal, thus Mahalanobis distance could utilise the normally distributed mean and co-variance unlike Euclidean distance which only uses mean. Mahalanobis distance from a sample to distribution of mean and covariance can be defined as
| (2) |
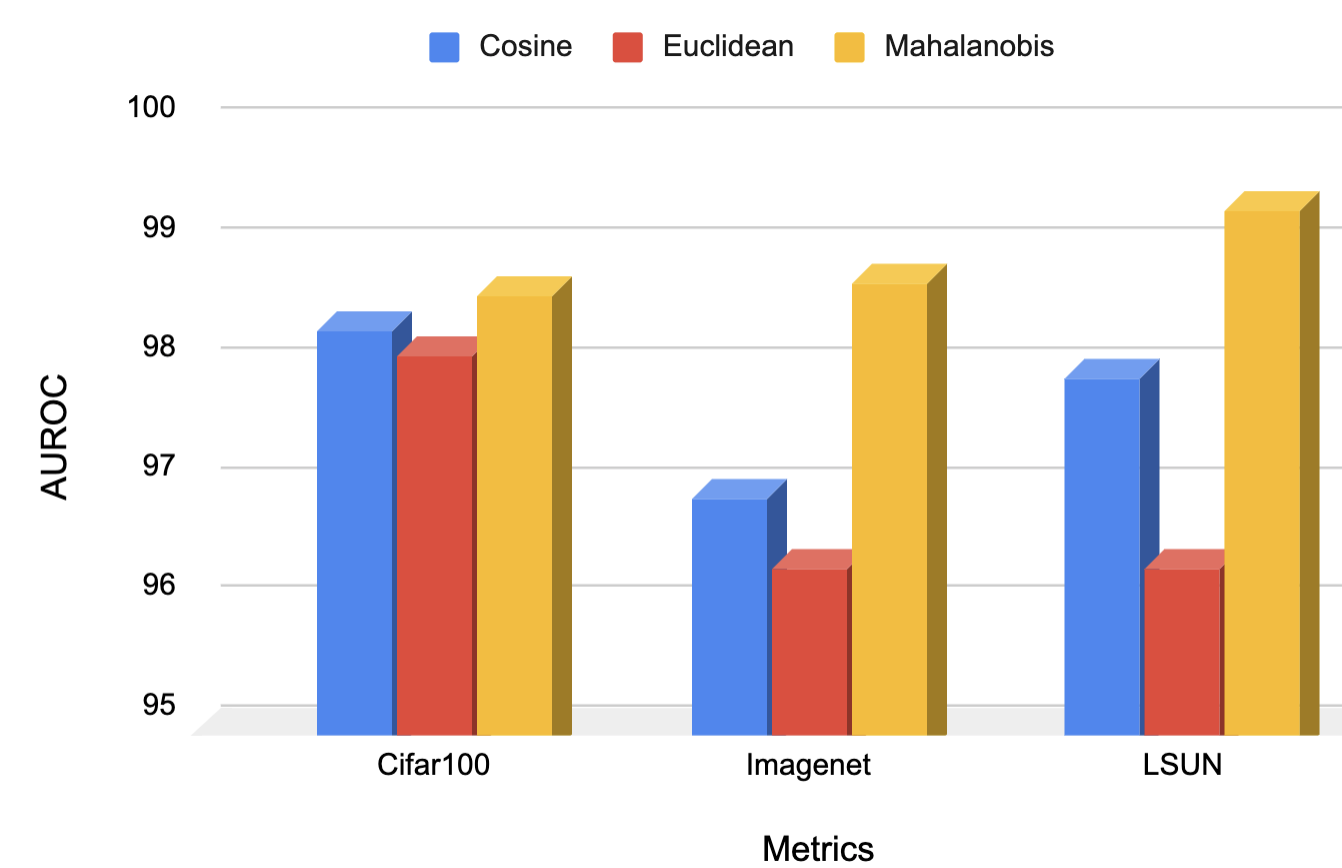
We have also examined Cosine and Euclidean distances as shown in Figure 3a. The complete algorithm to compute an outlier has been given to Algorithm 1.
Softmax confidence score: We obtain the final class probabilities from through softmax. Softmax-based posterior probabilities have been reported in earlier studies to give erroneous high confidence score when exposed to outliers [Lee et al.(2018)Lee, Lee, Lee, and Shin]. Prior works used this posterior probability for OOD detection task, using either a binary classifier [Hendrycks and Gimpel(2018)] or temperature scaling [Liang et al.(2017)Liang, Li, and Srikant]. We argue that for a good attribute cluster representation, as in the case of a transformer, no extra module for OOD detection is needed (see Table. 3). Thus in this work, we use only simple numerical thresholds () from ID samples for the detection of outliers without using additional OOD data for fine-tuning.
4 Experiments
| ID | CIAFR-10 | CIFAR-100 | IM-30 | |||
|---|---|---|---|---|---|---|
| (Out-of-Distribution) | SVHN | CIFAR-100 | SVHN | CIFAR-10 | CUB | Dogs |
| Baseline OOD[Hendrycks and Gimpel(2018)] | 95.9 | 89.8 | 78.9 | 78.0 | - | - |
| ODIN[Liang et al.(2017)Liang, Li, and Srikant] | 96.4 | 89.6 | 60.9 | 77.9 | - | - |
| Mahalanobis[Lee et al.(2018)Lee, Lee, Lee, and Shin] | 99.4 | 90.5 | 94.5 | 55.3 | - | - |
| Residual Flows[Zisselman and Tamar(2020)] | 99.1 | 89.4 | 97.5 | 77.1 | - | - |
| Outlier exposure[Hendrycks et al.(2019a)Hendrycks, Mazeika, and Dietterich] | 98.4 | 93.3 | 86.9 | 75.7 | - | - |
| Rotation pred[Hendrycks et al.(2019c)Hendrycks, Mazeika, Kadavath, and Song] | 98.9 | 90.9 | - | - | - | - |
| Contrastive + Supervised[Winkens et al.(2020)Winkens, Bunel, Roy, Stanforth, Natarajan, Ledsam, MacWilliams, Kohli, Karthikesalingam, Kohl, Cemgil, Eslami, and Ronneberger] | 99.5 | 92.9 | 95.6 | 78.3 | 86.3 | 95.6 |
| CSI[Tack et al.(2020)Tack, Mo, Jeong, and Shin] | 97.9 | 92.2 | - | - | 94.6 | 98.3 |
| SSD+[Sehwag et al.(2021)Sehwag, Chiang, and Mittal] | 99.9 | 93.4 | 98.2 | 78.3 | - | - |
| OODformer(Ours) | 99.5 | 98.6 | 98.3 | 96.1 | 99.7 | 99.9 |
In this section, we evaluate the performance of our approach and compare it to state-of-the-art OOD detection methods. In Sec. 4.1, we report our results on labeled multi-class OOD detection and one class anomaly detection. It also contains a comparison with state-of-the-art methods and a ResNet [He et al.(2016)He, Zhang, Ren, and Sun] baseline. In Sec.4.2, we examine the influence of architectural variance and distance metric on the OODformer in the context of the OOD detection.
Area under PR and ROC : A single threshold score may not scale across all the data sets. In order to homogenise the performance across multiple data sets, a range of thresholds should be considered. Thus, we report the area under precision-recall (PR) and ROC curve (AUROC) for both the latent space embedding, as well as softmax score.
Setup: We use ViT-B-16 [Dosovitskiy et al.(2020)Dosovitskiy, Beyer, Kolesnikov, Weissenborn,
Zhai, Unterthiner, Dehghani, Minderer, Heigold, Gelly,
et al.] as the base model for our all experiments and ablation studies. Variants of ViT (Base-16, Large-16 with embedding size 768 and 1024 along with patch size 16) and DeiT (Tiny-16, Small-16 with corresponding embedding size of 192 and 384) used a similar architecture but differ on embedding and the number of attention heads (full details provided in appendix). As transformers have inherently lesser inductive biases compared to CNNs, they can exploit similarities more efficiently when pre-trained with large datasets as prevalent with well-known architecture like BERT [Devlin et al.(2018)Devlin, Chang, Lee, and Toutanova] or GPT2 [Radford et al.(2019)Radford, Wu, Child, Luan, Amodei, and
Sutskever]. Thus, pre-training with large datasets is a necessary precondition for most transformer-based architectures and their use cases.
Hence, all the models we use are pre-trained on ImageNet [Deng et al.(2009)Deng, Dong, Socher, Li, Li, and Fei-Fei] as recommended in [Dosovitskiy et al.(2020)Dosovitskiy, Beyer, Kolesnikov, Weissenborn,
Zhai, Unterthiner, Dehghani, Minderer, Heigold, Gelly,
et al.]. Supervised cross-entropy loss is used for training along SGD as an optimizer and we followed the same data augmentation strategy like [Khosla et al.(2020)Khosla, Teterwak, Wang, Sarna, Tian, Isola,
Maschinot, Liu, and Krishnan]. ResNet-50 [He et al.(2016)He, Zhang, Ren, and Sun] is our default convolution-based baseline architecture used across all result and ablation studies. Mahalanobis distance-based score on representational embedding is used as the default score for the AUROC calculation.
Datasets: We trained our networks on the following in-distribution data sets: CIFAR-10/-100 [Krizhevsky et al.(2009)Krizhevsky, Hinton,
et al.] and ImageNet-30 (IM-30) [Hendrycks et al.(2019b)Hendrycks, Mazeika, Kadavath, and
Song]. AS OOD data for CIFAR-10/-100 we have chosen resized Imagenet (ImageNet_r) [Liang et al.(2017)Liang, Li, and Srikant] and LSUN [Hendrycks et al.(2019b)Hendrycks, Mazeika, Kadavath, and
Song] and SVHN [Netzer et al.(2011)Netzer, Wang, Coates, Bissacco, Wu, and
Ng] as specified in [Tack et al.(2020)Tack, Mo, Jeong, and
Shin]. In case of IM-30 we flow the same setup of [Tack et al.(2020)Tack, Mo, Jeong, and
Shin], and used Places-365 [Zhou et al.(2017)Zhou, Lapedriza, Khosla, Oliva, and
Torralba], DTD [Cimpoi et al.(2014)Cimpoi, Maji, Kokkinos, Mohamed, and
Vedaldi], Dogs [Khosla et al.(2011)Khosla, Jayadevaprakash, Yao, and
Li], Food-101 [Bossard et al.(2014)Bossard, Guillaumin, and
Van Gool], Caltech-256 [Griffin et al.(2007)Griffin, Holub, and Perona], and CUB-200 [Wah et al.(2011)Wah, Branson, Welinder, Perona, and
Belongie]. Details about these data set are given in the appendix.
4.1 Results
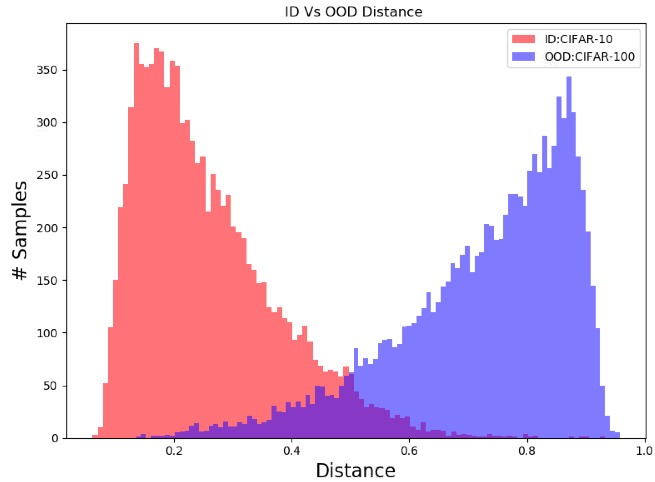
Comparison with State-of-the-Art: Table 1, exhibits that even with a simple cross-entropy loss, OODformers achieve new state-of-the-art results on all data sets. Most importantly, OODformer supersedes its predecessor on the complex near OOD data sets, which strongly affirms substantial improvements in generalisation. In particular, detection of CIFAR-100 as OOD samples with a network trained in CIFAR-10 (ID) or vice-versa is the most challenging task since they share a significant amount of common attributes in similar classes. For example, a ‘truck’ is an ID sample in CIFAR-10, whereas a ‘pickup-truck’ from CIFAR-100 is an OOD sample, despite being semantically closer and having many similar attributes. These attributes vs class trade-off leads to a significant drop in AUROC value for previous methods, especially when CIFAR-100 is ID and CIFAR-10 is OOD. We gained a notable and gain in AUROC when trained on CIFAR-10 and CIFAR-100, respectively. This can also be visualised in Figure.3b. These results show that the OODformer has superior generalizability of the representational embedding due to the global contextualization of object attributes from single or multiple patches, even with complex near OOD classification.
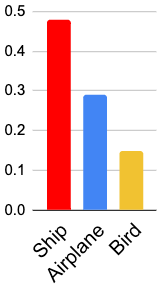
One class anomaly detection: Similar to OOD detection, anomaly detection is concerned with certain data types or specifically one class. Apart from that, the specific class presence of any class will be considered an anomaly. In this setting, we consider one of the classes from CIFAR-10 as an in-distribution, and the rest of the classes are anomalies or outliers. We train our network with one class (ID) and the remaining nine classes become OOD and we repeat these experiments for every class, similar to [Tack et al.(2020)Tack, Mo, Jeong, and Shin]. Table 2, shows our OODformer outperforms all existing methods and achieves new state-of-the-art results.
| Methods | Airplane | Automobile | Bird | Cat | Dear | Dog | Frog | Horse | Ship | Truck | Average |
|---|---|---|---|---|---|---|---|---|---|---|---|
| GT[Golan and El-Yaniv(2018)] | 74.7 | 95.7 | 78.1 | 72.4 | 87.8 | 87.8 | 83.4 | 95.5 | 93.3 | 91.3 | 86.0 |
| Inv-AE[Huang et al.(2019)Huang, Cao, Ye, Li, Zhang, and Lu] | 78.5 | 89.8 | 86.1 | 77.4 | 90.5 | 84.5 | 89.2 | 92.9 | 92 | 85.5 | 86.6 |
| Goad[Bergman and Hoshen(2020)] | 77.2 | 96.7 | 83.3 | 77.7 | 87.8 | 87.8 | 90 | 96.1 | 93.8 | 92 | 88.2 |
| CSI[Tack et al.(2020)Tack, Mo, Jeong, and Shin] | 89.9 | 99.9 | 93.1 | 86.4 | 93.9 | 93.2 | 95.1 | 98.7 | 97.9 | 95.5 | 94.3 |
| SSD[Sehwag et al.(2021)Sehwag, Chiang, and Mittal] | 82.7 | 98.5 | 84.2 | 84.5 | 84.8 | 90.9 | 91.7 | 95.2 | 92.9 | 94.4 | 90.0 |
| OODformer | 92.3 | 99.4 | 95.6 | 93.1 | 94.1 | 92.9 | 96.2 | 99.1 | 98.6 | 95.8 | 95.7 |
| ID | OOD | Emb-Distance | Softmax | ||
| ResNet | OODformer | ResNet | OODformer | ||
| CIFAR-10 | CIFAR-100 | 87.8 | 98.6 | 87.4 | 97.7 |
| Imagenet_r | 91.4 | 98.8 | 90.9 | 96.0 | |
| LSUN | 93.4 | 99.2 | 92.4 | 97.6 | |
| CIFAR-100 | CIFAR-10 | 73.7 | 96.1 | 69.3 | 88.9 |
| Imagenet_r | 79.9 | 92.5 | 72.4 | 86.1 | |
| LSUN | 79.0 | 94.6 | 72.9 | 86.2 | |
| IM-30 | Places-365 | 82.9 | 99.2 | 91.8 | 98.2 |
| DTD | 97.8 | 99.3 | 90.9 | 98.2 | |
| Dogs | 75.29 | 99.9 | 92.3 | 99.0 | |
| Food-101 | 73.44 | 99.2 | 83.2 | 97.2 | |
| Caltech256 | 86.37 | 98.0 | 91.4 | 96.8 | |
| CUB-200 | 87.22 | 99.7 | 91.9 | 99.4 | |
Comparison with ResNet: Table 3, shows the performance of OODformer in comparison with ResNet baseline. To show the generalisability and scalability, we trained our network with three in-distribution datasets and tested on nine different OOD datasets. Here, we use softmax confidence score in addition to our default embedding distance-based score for OOD detection. As discussed in Sec 1, softmax suffers from poor decision margin and lack of generalisation when used for ODD detection with CNNs. This can be addressed using our proposed OODformer. Table 3, shows that ours softmax based OOD detection significantly and consistently outperforms ResNet and achieves an improvement as high as . Our default AUROC score, using embedding similarity, also outperforms our baseline by a large margin. This result proves the objectness properties and exploitation of its related attributes through global attention play the most crucial role in outlier detection. It bolsters our hypothesis that, for outlier detection, a transformer can serve as the de-facto feature extractor without any bells and whistles.
4.2 Dissection of OODformer
In this section, we extensively analyse the attention and impact of different settings via an ablation study. We have used CIFAR-10 as ID and ViT-B-16 as default model architecture for our experiments.
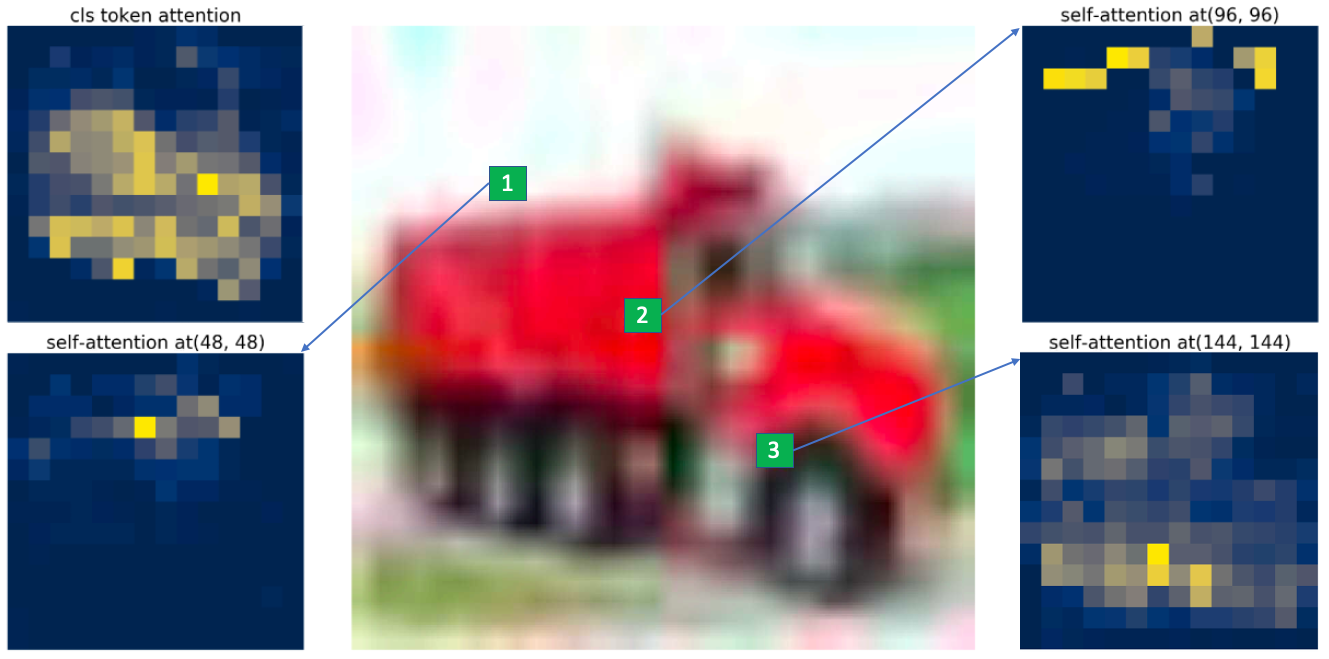
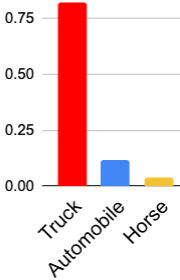
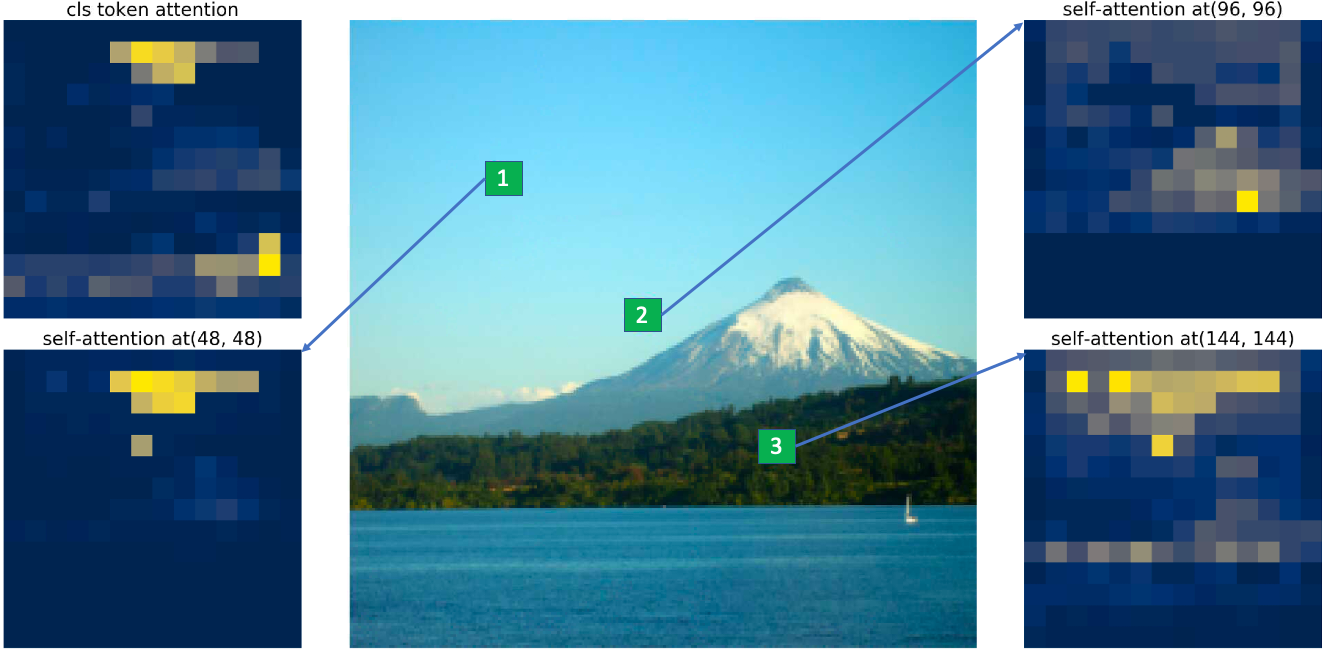
Global Context and Self-Attention: To understand how vision transformers discriminate between an ID and OOD, we analyse its self-attention and the embedding space. Figure 2 depicts examples of both ID and OOD samples with their attention maps collected from the last layer. Self-attention accumulates information from all the related patches that define an object. For an ID sample (‘truck’), token attention focuses mostly on the object of interest, while other selected patches put their attention based on properties similar to them like colour or texture. However, in the case of an OOD sample, the object ‘mountain’ is unknown to the network, the token attention mostly focused on the sky and water, while we draw similar observations for other patches as before. This misplaced attention and absence of known object attributes leads to a lower similarity score and predicts wrong classes just because of background similarity.
| Model | Acc. | CIFAR100 | Imagenet_r | LSUN |
| Resnet-34 | 95.6 | 87.2 | 89.7 | 91.4 |
| Resnet-50 | 95.4 | 87.5 | 90.0 | 91.7 |
| Resnet-101 | 95.7 | 87.8 | 91.4 | 93.4 |
| Resnet-34(PT) | 97.0 | 89.5 | 93.8 | 96.0 |
| Resnet-50(PT) | 97.1 | 89.9 | 94.1 | 96.1 |
| Resnet-101(PT) | 98.0 | 90.1 | 94.6 | 96.0 |
| DeiT-T-16 | 95.4 | 94.4 | 95.2 | 97.3 |
| DeiT-S-16 | 97.6 | 96.6 | 96.3 | 98.4 |
| ViT-B-16 | 98.6 | 98.6 | 98.8 | 99.2 |
| ViT-L-16 | 98.8 | 99.1 | 99.2 | 99.4 |
Figure 2, also shows objectness and its related attributes exploration in a hierarchical way is crucial for OOD distance score. This can also be inferred from Figure 3b, where we notice that the transformer not only reduces intra-class distance for ID samples, it also increases the distance of OOD samples from the ID class mean.
ResNets vs ViTs: This section examines the effect of model complexity or expressiveness of a model for OOD or outlier detection. We have conducted experiments on multiple variants of ViT in comparison with variants of ResNet baseline (top rows) as shown in Table 4. As all the variants of ViT and DeiT are pre-trained on ImageNet, for the sake of the comparison, we also evaluate ResNet variants that are pre-trained on ImageNet. As all the pre-trained ResNet models are trained with larger image size (224x224 pixel for ImageNet), thus for efficient utilisation of pre-training an up-scaling is needed. We fine-tune pre-trained ResNet on training in-distribution dataset using an up-scaling of 7x (from 32 to 224).
-
•
ResNet Baseline : Table 4, shows that Deit-T-16, which is the lightest among all variants of ViT and much smaller in size than all ResNet baseline variants, performs substantially better on OOD detection(94.4 compared to 87.8 of R-101 for CIFAR-100). Furthermore, despite being similar in accuracy DeiT-T-16 is significantly superior with respect to OOD detection like all other ViT variants.
-
•
ResNet Baseline pre-trained on ImageNet : The transformer based architecture relies on training with large-scale data in order to achieve superior performance. ViT also requires large-scale pre-training on ImageNet for an efficient performance similar to a few well-known transformer based architectures like BERT[Devlin et al.(2018)Devlin, Chang, Lee, and Toutanova], GPT2[Radford et al.(2019)Radford, Wu, Child, Luan, Amodei, and Sutskever]. Moreover, a few recent work [Reiss et al.(2021)Reiss, Cohen, Bergman, and Hoshen], suggests pre-training of convolution offer better performance for outlier detection. Thus, to demonstrate the true performance of OODformer, we compare it with pre-trained convolutional models like ResNets (middle rows). Table 4, suggests fine-tuning with upscale images offers good accuracy, but limited gain over OOD detection. Pre-trained ResNet follows a similar trend as the baseline models like increasing model capacity has a marginal effect on OOD detection in contrast to ViT variants. One of the key observations we found, apart from pre-training, up-scaling of images helped to attain higher performance on accuracy and OOD detection score.
As per the above discussion based on Table 4, we can clearly observe irrespective of their accuracy, image size, pre-training features extracted from ResNet deliver sub-optimal performance compare to all variants of ViT. Furthermore, with an increase in model complexity, the performance of ResNet reaches a plateau, whereas the performance of ViTs consistently improves with an increase in expressive power. This distinctly demonstrates the importance of objectness context, the role of an object attribute, and their mutual correlation (e.g, spatial) as hypothesised in the Sec 1. Such observations contribute to our belief, that the transformer architecture is better suited for OOD detection tasks than classical CNNs primarily for less inductive bias, object attribute accumulation using attention.
(a) (b)
Analyzing Distance Metrics: We examine the influence of various distance metrics like Cosine and Euclidean in Figure.3a. Euclidean utilises only the mean of the ID distribution thus it could be an intuitive reason for its underperformance. Furthermore, [Sehwag et al.(2021)Sehwag, Chiang, and Mittal] shows that, in embedding space, Euclidean distance is dominated by higher eigenvalues that reduce the sensitivity towards outliers. Both Cosine and Mahalanobis perform very similarly. However, the slightly better performance of Mahalanobis, compared to Cosine, could be attributed to its less dependency on a higher norm between two features and its utilisation of both mean and covariance. Figure 3a, shows that the OODformer is quite robust ( variance) to various distances.
5 Conclusion
In this paper, we made an early attempt utilising a vision transformer namely the OODformer for OOD detection. Unlike prior approaches, which rely upon custom loss or negative sample mining, we alternatively formulate OOD detection as object-specific attribute accumulation problem using multi-hop context aggregation by a transformer. This simple approach is not only scalable and robust but also outperforms all existing methods by a large margin. OODformer is also more suitable for being deployed in the wild for safety-critical applications due to its simplicity and increased interpretability compare to other methods. Building on our work, emerging methods in self-supervision, pre-training, and contrastive learning will be of future interest to investigate in combination with OODformer.
Acknowledgement
We are sincerely thankful to Suprosnna Shit for his suggestion and revision of the manuscript.
References
- [Ba et al.(2016)Ba, Kiros, and Hinton] Jimmy Lei Ba, Jamie Ryan Kiros, and Geoffrey E Hinton. Layer normalization. arXiv preprint arXiv:1607.06450, 2016.
- [Bergman and Hoshen(2020)] Liron Bergman and Yedid Hoshen. Classification-based anomaly detection for general data. arXiv preprint arXiv:2005.02359, 2020.
- [Bossard et al.(2014)Bossard, Guillaumin, and Van Gool] Lukas Bossard, Matthieu Guillaumin, and Luc Van Gool. Food-101–mining discriminative components with random forests. In European conference on computer vision, pages 446–461. Springer, 2014.
- [Carion et al.(2020)Carion, Massa, Synnaeve, Usunier, Kirillov, and Zagoruyko] Nicolas Carion, Francisco Massa, Gabriel Synnaeve, Nicolas Usunier, Alexander Kirillov, and Sergey Zagoruyko. End-to-end object detection with transformers. In European Conference on Computer Vision, pages 213–229. Springer, 2020.
- [Caron et al.(2021)Caron, Touvron, Misra, Jégou, Mairal, Bojanowski, and Joulin] Mathilde Caron, Hugo Touvron, Ishan Misra, Hervé Jégou, Julien Mairal, Piotr Bojanowski, and Armand Joulin. Emerging properties in self-supervised vision transformers. arXiv preprint arXiv:2104.14294, 2021.
- [Charpentier and Günnemann(2020)] Daniel Zügner Charpentier, Bertrand and Stephan Günnemann. Posterior network: Uncertainty estimation without ood samples via density-based pseudo-counts. In Advances in Neural Information Processing Systems 33. Curran Associates, Inc., 2020.
- [Chen et al.(2020a)Chen, Kornblith, Norouzi, and Hinton] Ting Chen, Simon Kornblith, Mohammad Norouzi, and Geoffrey Hinton. A Simple Framework for Contrastive Learning of Visual Representations. In International Conference on Machine Learning, pages 1597–1607. PMLR, November 2020a.
- [Chen et al.(2020b)Chen, Kornblith, Swersky, Norouzi, and Hinton] Ting Chen, Simon Kornblith, Kevin Swersky, Mohammad Norouzi, and Geoffrey Hinton. Big Self-Supervised Models are Strong Semi-Supervised Learners. arXiv:2006.10029 [cs, stat], June 2020b.
- [Chen et al.(2020c)Chen, Fan, Girshick, and He] Xinlei Chen, Haoqi Fan, Ross Girshick, and Kaiming He. Improved Baselines with Momentum Contrastive Learning. arXiv:2003.04297 [cs], March 2020c. Comment: Tech report, 2 pages + references.
- [Chuang et al.(2020)Chuang, Robinson, Yen-Chen, Torralba, and Jegelka] Ching-Yao Chuang, Joshua Robinson, Lin Yen-Chen, Antonio Torralba, and Stefanie Jegelka. Debiased Contrastive Learning. arXiv:2007.00224 [cs, stat], July 2020.
- [Cimpoi et al.(2014)Cimpoi, Maji, Kokkinos, Mohamed, and Vedaldi] Mircea Cimpoi, Subhransu Maji, Iasonas Kokkinos, Sammy Mohamed, and Andrea Vedaldi. Describing textures in the wild. In Proceedings of the IEEE Conference on Computer Vision and Pattern Recognition, pages 3606–3613, 2014.
- [Deng et al.(2009)Deng, Dong, Socher, Li, Li, and Fei-Fei] Jia Deng, Wei Dong, Richard Socher, Li-Jia Li, Kai Li, and Li Fei-Fei. Imagenet: A large-scale hierarchical image database. In 2009 IEEE Conference on Computer Vision and Pattern Recognition, pages 248–255, 2009. 10.1109/CVPR.2009.5206848.
- [Devlin et al.(2018)Devlin, Chang, Lee, and Toutanova] Jacob Devlin, Ming-Wei Chang, Kenton Lee, and Kristina Toutanova. Bert: Pre-training of deep bidirectional transformers for language understanding. arXiv preprint arXiv:1810.04805, 2018.
- [Dosovitskiy et al.(2020)Dosovitskiy, Beyer, Kolesnikov, Weissenborn, Zhai, Unterthiner, Dehghani, Minderer, Heigold, Gelly, et al.] Alexey Dosovitskiy, Lucas Beyer, Alexander Kolesnikov, Dirk Weissenborn, Xiaohua Zhai, Thomas Unterthiner, Mostafa Dehghani, Matthias Minderer, Georg Heigold, Sylvain Gelly, et al. An image is worth 16x16 words: Transformers for image recognition at scale. arXiv preprint arXiv:2010.11929, 2020.
- [Elsayed et al.(2018)Elsayed, Krishnan, Mobahi, Regan, and Bengio] Gamaleldin F Elsayed, Dilip Krishnan, Hossein Mobahi, Kevin Regan, and Samy Bengio. Large margin deep networks for classification. arXiv preprint arXiv:1803.05598, 2018.
- [Golan and El-Yaniv(2018)] Izhak Golan and Ran El-Yaniv. Deep Anomaly Detection Using Geometric Transformations. arXiv:1805.10917 [cs, stat], November 2018.
- [Goyal et al.(2017)Goyal, Dollár, Girshick, Noordhuis, Wesolowski, Kyrola, Tulloch, Jia, and He] Priya Goyal, Piotr Dollár, Ross Girshick, Pieter Noordhuis, Lukasz Wesolowski, Aapo Kyrola, Andrew Tulloch, Yangqing Jia, and Kaiming He. Accurate, large minibatch sgd: Training imagenet in 1 hour. arXiv preprint arXiv:1706.02677, 2017.
- [Griffin et al.(2007)Griffin, Holub, and Perona] Gregory Griffin, Alex Holub, and Pietro Perona. Caltech-256 object category dataset. 2007.
- [He et al.(2016)He, Zhang, Ren, and Sun] Kaiming He, Xiangyu Zhang, Shaoqing Ren, and Jian Sun. Deep residual learning for image recognition. In Proceedings of the IEEE conference on computer vision and pattern recognition, pages 770–778, 2016.
- [Hendrycks and Gimpel(2018)] Dan Hendrycks and Kevin Gimpel. A Baseline for Detecting Misclassified and Out-of-Distribution Examples in Neural Networks. arXiv:1610.02136 [cs], October 2018.
- [Hendrycks et al.(2019a)Hendrycks, Mazeika, and Dietterich] Dan Hendrycks, Mantas Mazeika, and Thomas Dietterich. Deep Anomaly Detection with Outlier Exposure. arXiv:1812.04606 [cs, stat], January 2019a. Comment: ICLR 2019; PyTorch code available at https://github.com/hendrycks/outlier-exposure.
- [Hendrycks et al.(2019b)Hendrycks, Mazeika, Kadavath, and Song] Dan Hendrycks, Mantas Mazeika, Saurav Kadavath, and Dawn Song. Using self-supervised learning can improve model robustness and uncertainty. arXiv preprint arXiv:1906.12340, 2019b.
- [Hendrycks et al.(2019c)Hendrycks, Mazeika, Kadavath, and Song] Dan Hendrycks, Mantas Mazeika, Saurav Kadavath, and Dawn Song. Using Self-Supervised Learning Can Improve Model Robustness and Uncertainty. In H. Wallach, H. Larochelle, A. Beygelzimer, F. dAlché-Buc, E. Fox, and R. Garnett, editors, Advances in Neural Information Processing Systems 32, pages 15663–15674. Curran Associates, Inc., October 2019c. Comment: NeurIPS 2019; code and data available at https://github.com/hendrycks/ss-ood.
- [Hildebrandt et al.(2020)Hildebrandt, Li, Koner, Tresp, and Günnemann] Marcel Hildebrandt, Hang Li, Rajat Koner, Volker Tresp, and Stephan Günnemann. Scene graph reasoning for visual question answering. arXiv preprint arXiv:2007.01072, 2020.
- [Hoffer et al.(2017)Hoffer, Hubara, and Soudry] Elad Hoffer, Itay Hubara, and Daniel Soudry. Train longer, generalize better: closing the generalization gap in large batch training of neural networks. arXiv preprint arXiv:1705.08741, 2017.
- [Hsu et al.(2020)Hsu, Shen, Jin, and Kira] Yen-Chang Hsu, Yilin Shen, Hongxia Jin, and Zsolt Kira. Generalized ODIN: Detecting Out-of-Distribution Image Without Learning From Out-of-Distribution Data. In Proceedings of the IEEE/CVF Conference on Computer Vision and Pattern Recognition, pages 10951–10960, 2020.
- [Huang et al.(2019)Huang, Cao, Ye, Li, Zhang, and Lu] Chaoqing Huang, Jinkun Cao, Fei Ye, Maosen Li, Ya Zhang, and Cewu Lu. Inverse-transform autoencoder for anomaly detection. 2019.
- [Khosla et al.(2011)Khosla, Jayadevaprakash, Yao, and Li] Aditya Khosla, Nityananda Jayadevaprakash, Bangpeng Yao, and Fei-Fei Li. Novel dataset for fine-grained image categorization: Stanford dogs. In Proc. CVPR Workshop on Fine-Grained Visual Categorization (FGVC), volume 2. Citeseer, 2011.
- [Khosla et al.(2020)Khosla, Teterwak, Wang, Sarna, Tian, Isola, Maschinot, Liu, and Krishnan] Prannay Khosla, Piotr Teterwak, Chen Wang, Aaron Sarna, Yonglong Tian, Phillip Isola, Aaron Maschinot, Ce Liu, and Dilip Krishnan. Supervised Contrastive Learning. arXiv:2004.11362 [cs, stat], April 2020.
- [Koner et al.(2020)Koner, Sinhamahapatra, and Tresp] Rajat Koner, Poulami Sinhamahapatra, and Volker Tresp. Relation transformer network. arXiv preprint arXiv:2004.06193, 2020.
- [Koner et al.(2021a)Koner, Li, Hildebrandt, Das, Tresp, and Günnemann] Rajat Koner, Hang Li, Marcel Hildebrandt, Deepan Das, Volker Tresp, and Stephan Günnemann. Graphhopper: Multi-hop scene graph reasoning for visual question answering. In International Semantic Web Conference, pages 111–127. Springer, 2021a.
- [Koner et al.(2021b)Koner, Sinhamahapatra, and Tresp] Rajat Koner, Poulami Sinhamahapatra, and Volker Tresp. Scenes and surroundings: Scene graph generation using relation transformer. arXiv preprint arXiv:2107.05448, 2021b.
- [Krizhevsky et al.(2009)Krizhevsky, Hinton, et al.] Alex Krizhevsky, Geoffrey Hinton, et al. Learning multiple layers of features from tiny images. 2009.
- [Lee et al.(2018)Lee, Lee, Lee, and Shin] Kimin Lee, Kibok Lee, Honglak Lee, and Jinwoo Shin. A Simple Unified Framework for Detecting Out-of-Distribution Samples and Adversarial Attacks. arXiv:1807.03888 [cs, stat], October 2018. Comment: Accepted in NIPS 2018.
- [Li et al.(2020)Li, Zhou, Xiong, Socher, and Hoi] Junnan Li, Pan Zhou, Caiming Xiong, Richard Socher, and Steven C. H. Hoi. Prototypical Contrastive Learning of Unsupervised Representations. arXiv:2005.04966 [cs], July 2020.
- [Liang et al.(2017)Liang, Li, and Srikant] Shiyu Liang, Yixuan Li, and Rayadurgam Srikant. Enhancing the reliability of out-of-distribution image detection in neural networks. arXiv preprint arXiv:1706.02690, 2017.
- [Liu et al.(2016)Liu, Wen, Yu, and Yang] Weiyang Liu, Yandong Wen, Zhiding Yu, and Meng Yang. Large-margin softmax loss for convolutional neural networks. In ICML, volume 2, page 7, 2016.
- [Liu et al.(2021)Liu, Lin, Cao, Hu, Wei, Zhang, Lin, and Guo] Ze Liu, Yutong Lin, Yue Cao, Han Hu, Yixuan Wei, Zheng Zhang, Stephen Lin, and Baining Guo. Swin transformer: Hierarchical vision transformer using shifted windows. arXiv preprint arXiv:2103.14030, 2021.
- [Nalisnick et al.(2019)Nalisnick, Matsukawa, Teh, Gorur, and Lakshminarayanan] Eric Nalisnick, Akihiro Matsukawa, Yee Whye Teh, Dilan Gorur, and Balaji Lakshminarayanan. Do Deep Generative Models Know What They Don’t Know? arXiv:1810.09136 [cs, stat], February 2019. Comment: ICLR 2019.
- [Netzer et al.(2011)Netzer, Wang, Coates, Bissacco, Wu, and Ng] Yuval Netzer, Tao Wang, Adam Coates, Alessandro Bissacco, Bo Wu, and Andrew Y Ng. Reading digits in natural images with unsupervised feature learning. 2011.
- [Pidhorskyi et al.(2018)Pidhorskyi, Almohsen, and Doretto] Stanislav Pidhorskyi, Ranya Almohsen, and Gianfranco Doretto. Generative Probabilistic Novelty Detection with Adversarial Autoencoders. In S. Bengio, H. Wallach, H. Larochelle, K. Grauman, N. Cesa-Bianchi, and R. Garnett, editors, Advances in Neural Information Processing Systems 31, pages 6822–6833. Curran Associates, Inc., 2018.
- [Radford et al.(2019)Radford, Wu, Child, Luan, Amodei, and Sutskever] Alec Radford, Jeff Wu, Rewon Child, David Luan, Dario Amodei, and Ilya Sutskever. Language models are unsupervised multitask learners. 2019.
- [Reiss et al.(2021)Reiss, Cohen, Bergman, and Hoshen] Tal Reiss, Niv Cohen, Liron Bergman, and Yedid Hoshen. Panda: Adapting pretrained features for anomaly detection and segmentation. In Proceedings of the IEEE/CVF Conference on Computer Vision and Pattern Recognition, pages 2806–2814, 2021.
- [Ren et al.(2019)Ren, Liu, Fertig, Snoek, Poplin, Depristo, Dillon, and Lakshminarayanan] Jie Ren, Peter J. Liu, Emily Fertig, Jasper Snoek, Ryan Poplin, Mark Depristo, Joshua Dillon, and Balaji Lakshminarayanan. Likelihood ratios for out-of-distribution detection. In H. Wallach, H. Larochelle, A. Beygelzimer, F. dAlché-Buc, E. Fox, and R. Garnett, editors, Advances in Neural Information Processing Systems 32, pages 14707–14718. Curran Associates, Inc., 2019. Comment: Accepted to NeurIPS 2019.
- [Sehwag et al.(2021)Sehwag, Chiang, and Mittal] Vikash Sehwag, Mung Chiang, and Prateek Mittal. Ssd: A unified framework for self-supervised outlier detection. In International Conference on Learning Representations, 2021. URL https://openreview.net/forum?id=v5gjXpmR8J.
- [Serrà et al.(2019)Serrà, Álvarez, Gómez, Slizovskaia, Núñez, Luque, Slizovskaia, José, Nú, ñ, ez, and Luque] Joan Serrà, David Álvarez, Vicenç Gómez, Olga Slizovskaia, José F. Núñez, Jordi Luque, Olga Slizovskaia, José, F. Nú, ñ, ez, and Jordi Luque. Input Complexity and Out-of-distribution Detection with Likelihood-based Generative Models. In Proc. ICLR 2020, September 2019.
- [Smith(2017)] Leslie N Smith. Cyclical learning rates for training neural networks. In 2017 IEEE winter conference on applications of computer vision (WACV), pages 464–472. IEEE, 2017.
- [Tack et al.(2020)Tack, Mo, Jeong, and Shin] Jihoon Tack, Sangwoo Mo, Jongheon Jeong, and Jinwoo Shin. CSI: Novelty Detection via Contrastive Learning on Distributionally Shifted Instances. arXiv:2007.08176 [cs, stat], July 2020. Comment: 23 pages; Code is available at https://github.com/alinlab/CSI.
- [Touvron et al.(2020)Touvron, Cord, Douze, Massa, Sablayrolles, and Jégou] Hugo Touvron, Matthieu Cord, Matthijs Douze, Francisco Massa, Alexandre Sablayrolles, and Hervé Jégou. Training data-efficient image transformers and distillation through attention. arXiv preprint arXiv:2012.12877, 2020.
- [Vaswani et al.(2017)Vaswani, Shazeer, Parmar, Uszkoreit, Jones, Gomez, Kaiser, and Polosukhin] Ashish Vaswani, Noam Shazeer, Niki Parmar, Jakob Uszkoreit, Llion Jones, Aidan N Gomez, Lukasz Kaiser, and Illia Polosukhin. Attention is all you need. arXiv preprint arXiv:1706.03762, 2017.
- [Wah et al.(2011)Wah, Branson, Welinder, Perona, and Belongie] Catherine Wah, Steve Branson, Peter Welinder, Pietro Perona, and Serge Belongie. The caltech-ucsd birds-200-2011 dataset. 2011.
- [Winkens et al.(2020)Winkens, Bunel, Roy, Stanforth, Natarajan, Ledsam, MacWilliams, Kohli, Karthikesalingam, Kohl, Cemgil, Eslami, and Ronneberger] Jim Winkens, Rudy Bunel, Abhijit Guha Roy, Robert Stanforth, Vivek Natarajan, Joseph R. Ledsam, Patricia MacWilliams, Pushmeet Kohli, Alan Karthikesalingam, Simon Kohl, Taylan Cemgil, S. M. Ali Eslami, and Olaf Ronneberger. Contrastive Training for Improved Out-of-Distribution Detection. arXiv:2007.05566 [cs, stat], July 2020.
- [Zhou et al.(2017)Zhou, Lapedriza, Khosla, Oliva, and Torralba] Bolei Zhou, Agata Lapedriza, Aditya Khosla, Aude Oliva, and Antonio Torralba. Places: A 10 million image database for scene recognition. IEEE transactions on pattern analysis and machine intelligence, 40(6):1452–1464, 2017.
- [Zisselman and Tamar(2020)] Ev Zisselman and Aviv Tamar. Deep residual flow for out of distribution detection. In Proceedings of the IEEE/CVF Conference on Computer Vision and Pattern Recognition, pages 13994–14003, 2020.
- [Zong et al.(2018)Zong, Song, Min, Cheng, Lumezanu, Cho, and Chen] Bo Zong, Qi Song, Martin Renqiang Min, Wei Cheng, Cristian Lumezanu, Daeki Cho, and Haifeng Chen. Deep autoencoding gaussian mixture model for unsupervised anomaly detection. In International Conference on Learning Representations, 2018.
Appendix A ViT Architecture
Vision Transformer [Dosovitskiy et al.(2020)Dosovitskiy, Beyer, Kolesnikov, Weissenborn, Zhai, Unterthiner, Dehghani, Minderer, Heigold, Gelly, et al.] uses transformer encoder [Vaswani et al.(2017)Vaswani, Shazeer, Parmar, Uszkoreit, Jones, Gomez, Kaiser, and Polosukhin] for patch based image classification. The core of ViT relies on multi-head self-attention (MSA) and multi-layer perception (MLP) for processing sequence of image patches.
Multi-head Self-Attention:
The attention mechanism is formulated as a trainable weighted sum based approach. One can define self-attention as
| (3) |
where are a set of learnable query, key and value and is the embedding dimension. A query vector is multiplied with key using inner product obtained from the sequence of tokens as specified in Eq. 1. The important features from the query token is dynamically learned by taking a softmax on the product of query and key vectors. It is then multiplied with the value vector that incorporates features from other tokens based on their learned importance.
Multi-Layer Perception:
The transformer encoder uses a Feed-Forward Network (FFN) on top of each MSA layer. An FFN layer consists with two linear layer separated with GleU activation. The FFN processes the feature from the MSA block with a residual connection and normalizes with layer normalization [Ba et al.(2016)Ba, Kiros, and Hinton]. Each of the FFN layer is local for every patch unlike the MSA (MSA act as a global layer), hence the FFN makes the encoder image translation invariant.
Appendix B Implementation Details
Our backbone ViT [Dosovitskiy et al.(2020)Dosovitskiy, Beyer, Kolesnikov, Weissenborn, Zhai, Unterthiner, Dehghani, Minderer, Heigold, Gelly, et al.] and DeiT [Touvron et al.(2020)Touvron, Cord, Douze, Massa, Sablayrolles, and Jégou] are pretrained on ImageNet, and fine-tuned in an in-distribution dataset with SGD optimizer, a batch size of 256 and image size of . We use a learning rate of with Cyclic learning rate scheduler [Smith(2017)], weight decay= and train for 50 epochs. We follow the data augmentation scheme same as [Khosla et al.(2020)Khosla, Teterwak, Wang, Sarna, Tian, Isola, Maschinot, Liu, and Krishnan].
B.1 Model Detail
We use multiple variants of ViT and DeiT, primarily because DeiT offers lighter model, whereas ViT mainly focusses on havier model. The idea being an enhanced outlier detection performance with a lighter variant will bolster our assumption that exploring an object’s attributes and their correlation using global attention plays a crucial role in OOD detection. In comparison, a heavier variant will offer increased model capacity to improve the performance of the OODformer. Table. 4 exhibits the performance of OODformer with multiple backbone variants in support of our hypothesis. Specially the significant performance gain with the smallest variant of DeiT (T-16) bolster our claim. Table 5 shows the variation of their parameter, number of layers, hidden or embedding size, MLP size, number of attention head.
| Model | Prams | #Layers | Hidden Size | MLP Size | #Heads |
|---|---|---|---|---|---|
| DeiT-T-16 | 5 | 12 | 192 | 768 | 3 |
| DeiT-S-16 | 22 | 12 | 384 | 1536 | 6 |
| ViT-B-16 | 86.5 | 12 | 768 | 3072 | 12 |
| ViT-L-16 | 307 | 24 | 1024 | 4096 | 16 |
B.2 Dataset Details
Among the in-distribution dataset,
CIFAR-10/-100 [Krizhevsky et al.(2009)Krizhevsky, Hinton,
et al.] consists of 50K training and 10K test images with corresponding 10 and 100 classes. The CIFAR-100 dataset also contains twenty superclasses for all the hundred classes present in it. Even though CIFAR-10 and CIFAR-100 has no overlap for any class, some classes share similar attributes or concepts (e.g., ‘truck’ and ‘pickup-truck’) as discussed in Section.4.2. As a result of this close semantic similarity these two datasets poses the most challenging near OOD problem and the performance of OODformer in this context has shown in Table 1. Another in-distribution dataset, ImageNet-30 [Hendrycks et al.(2019b)Hendrycks, Mazeika, Kadavath, and
Song], is a subset of ImageNet[Deng et al.(2009)Deng, Dong, Socher, Li, Li, and Fei-Fei] with 30 classes that contains 39K training and 3K test images.
Out-Of-Distribution dataset used for CIFAR-10/-100 are as follows : Street View Housing Number or SHVN [Netzer et al.(2011)Netzer, Wang, Coates, Bissacco, Wu, and
Ng] contains around 26K test images of ten digits, LSUN [Hendrycks et al.(2019b)Hendrycks, Mazeika, Kadavath, and
Song] consists of 10K test images of ten various scenes, ImageNet-resize [Hendrycks et al.(2019b)Hendrycks, Mazeika, Kadavath, and
Song] is also a subset of ImageNet with 10K images and two hundred classes. For multi-class ImageNet-30, we follow the same OOD datsets as specified in [Tack et al.(2020)Tack, Mo, Jeong, and
Shin], they are : Places-365 [Zhou et al.(2017)Zhou, Lapedriza, Khosla, Oliva, and
Torralba], Describable Texture Dataset [Cimpoi et al.(2014)Cimpoi, Maji, Kokkinos, Mohamed, and
Vedaldi], Food-101 [Bossard et al.(2014)Bossard, Guillaumin, and
Van Gool], Caltech-256 [Griffin et al.(2007)Griffin, Holub, and Perona] and CUB-200 [Wah et al.(2011)Wah, Branson, Welinder, Perona, and
Belongie].
Appendix C Ablation and Interpretation
In addition to the analysis provided in Sec. 4.2, we ablate OODformer on various batch sizes, epochs and analyze the cluster in embedding space.
(a) (b)
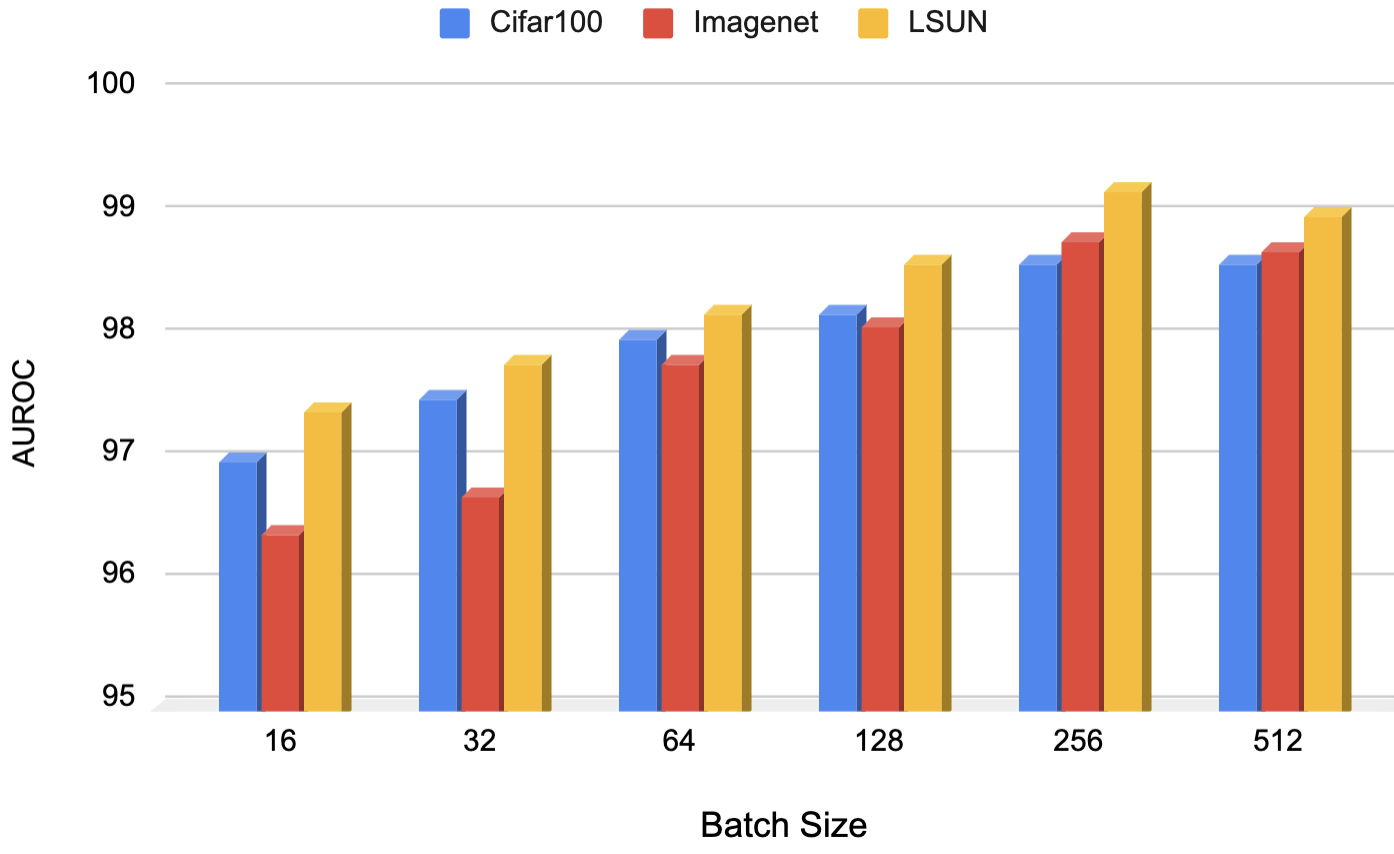
Figure. 4a, demonstrates large batch size helps in OOD detection, though we observe it doesn’t significantly impact accuracy on the in-distribution test set. An intuitive reason could be large batch size improves generalization [Hoffer et al.(2017)Hoffer, Hubara, and Soudry], which enables the network to generalize object-specific properties that are helpful for outlier identification. Despite this gain, we observe OODformer remain relatively stable across all the batch sizes with OOD detection accuracy . However, the gain in AUROC gradually becomes stagnant with an increase of batch size suggest further scope of tuning learning rate is required using a linear scaling [Goyal et al.(2017)Goyal, Dollár, Girshick, Noordhuis, Wesolowski,
Kyrola, Tulloch, Jia, and He].
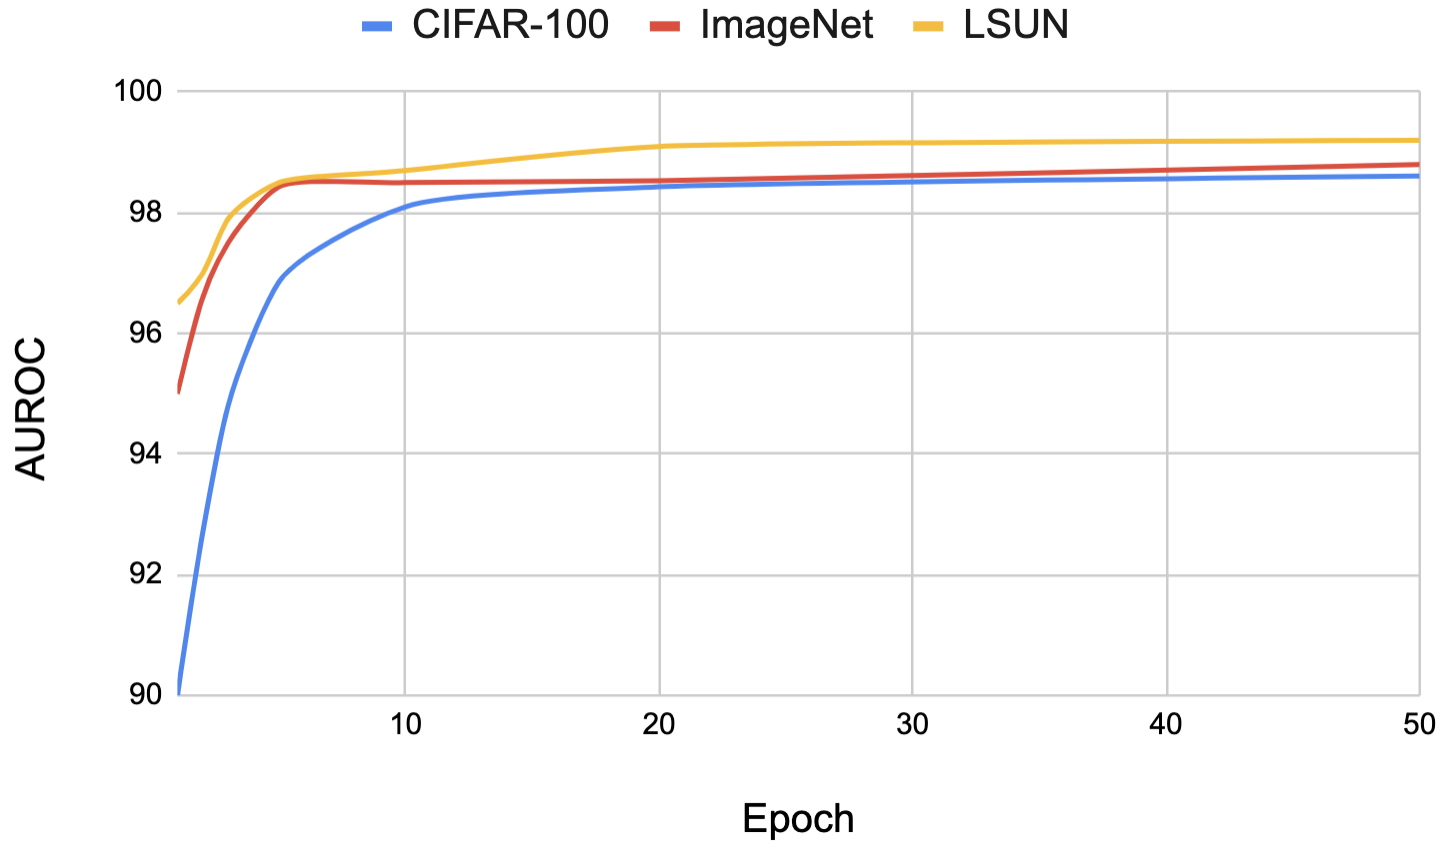
Figure. 4b, shows an increase of outlier detection accuracy with the number of epochs. One of the important observation is easier OOD dataset (e.g., LSUN, ImageNet) are distinguishable with fewer epochs whereas difficult OOD dataset like CIFAR-100 takes more time. In comparison with the state-of-the-art i.e. convolution [Hendrycks et al.(2019c)Hendrycks, Mazeika, Kadavath, and
Song] or contrastive [Sehwag et al.(2021)Sehwag, Chiang, and Mittal], our proposed OODformer converges significantly faster, even with much less batch size. This promising result shows the efficacy of the OODfromer in a real-world scenario and directs to further scope of research of transformer in outlier detection.
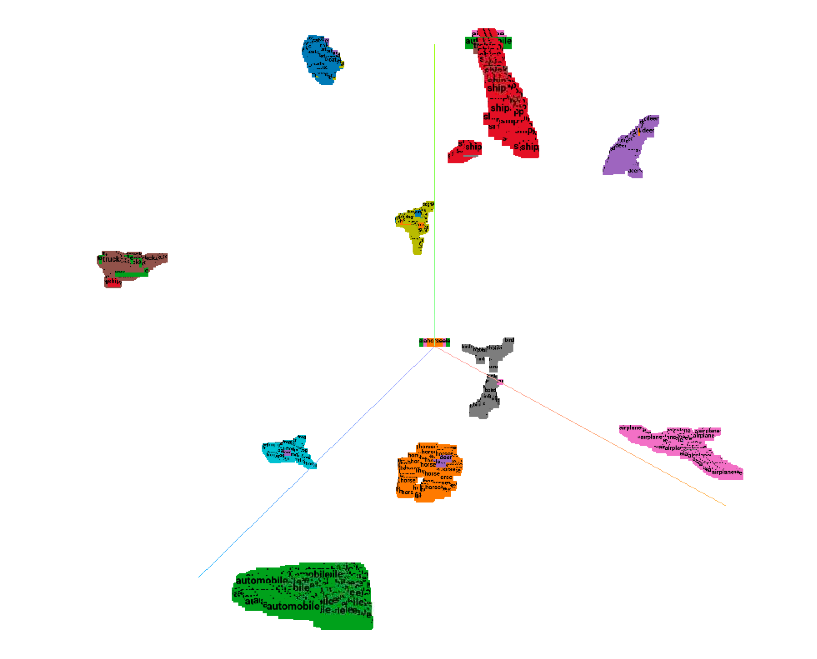
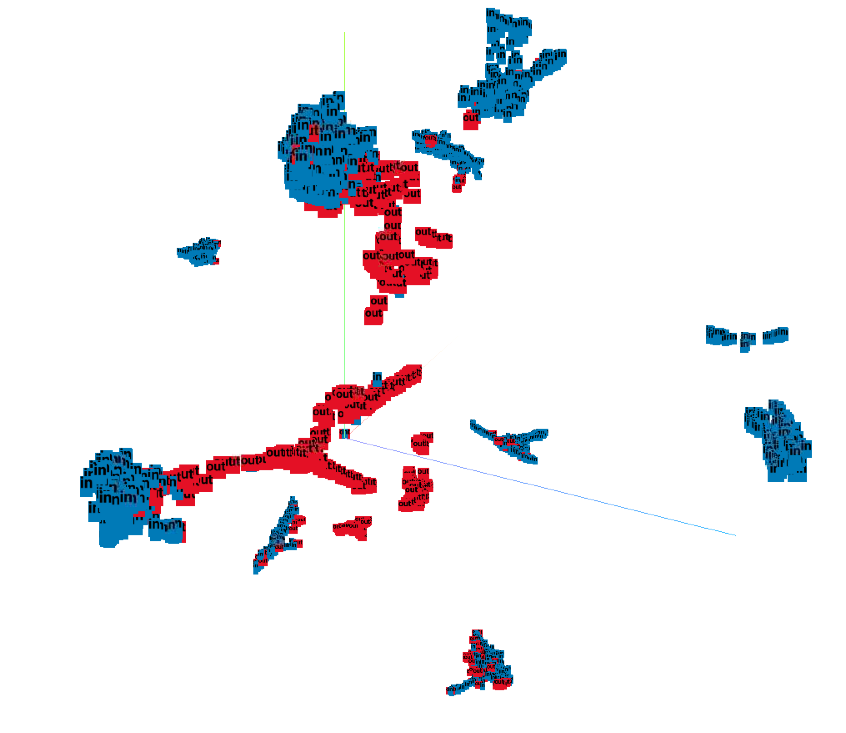
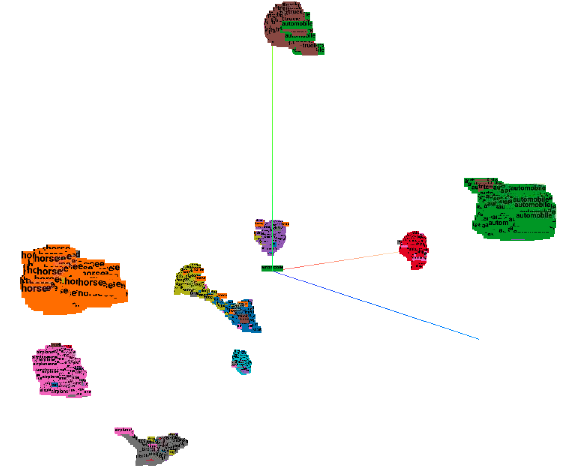
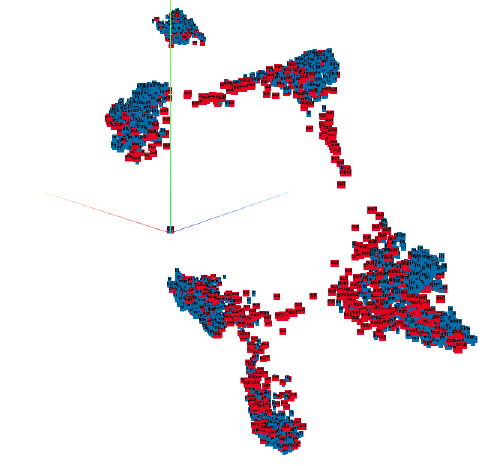
Manifold Analysis : Fig. 5a and 6a, shows both for OODformer and ResNet-50 baseline, all the classes in CIFAR-10 have formed a compact cluster as shown by their corresponding UMAP. As discussed in Sec. 3, we can observe supervise loss helps in the formation of the compact clustering, which can be exploited for class conditioned OOD detection provided there is a separability between ID and OOD data. Figure. 5b, shows that for OODformer, OOD samples in the embedding space lie far from any cluster center of an in-distribution sample due to its large distributional shift or lack of object-specific attributes. This variation of distance between an ID and OOD sample is effectively utilized by our distance metric. However, Fig. 6, suggests that despite being able to form a distinctive cluster for ID samples, our ResNet baseline has failed to maintain a clear separation between an ID and OOD samples.
This UMAP analysis supports our earlier assumption on results of Table 4, in spite of lower or similar accuracy for classification of ID samples, features extracted from transformer have more distinctive separable features for OOD detection.
(a) (b)
(a) (b)