0
Research
Yuyu Luo and Guoliang Li are with the Department of Computer Science, Tsinghua University, China. Email: {luoyy18@mails., liguoliang@}tsinghua.edu.cn
Jiawei Tang is with American School of Doha, Doha, Qatar. Email: 23jtang@asd.edu.qa
A brief history of natural language query to visualization in academia. After the release of nvBench in 2021, some deep learning-based models are developed to support translating natural language queries into visualizations.
nvBench: A Large-Scale Synthesized Dataset for Cross-Domain
Natural Language to Visualization Task
Abstract
NL2VIS – which translates natural language (NL) queries to corresponding visualizations (VIS) – has attracted more and more attention both in commercial visualization vendors and academic researchers. In the last few years, the advanced deep learning-based models have achieved human-like abilities in many natural language processing (NLP) tasks, which clearly tells us that the deep learning-based technique is a good choice to push the field of NL2VIS. However, a big balk is the lack of benchmarks with lots of (NL, VIS) pairs. We present nvBench, the first large-scale NL2VIS benchmark, containing 25,750 (NL, VIS) pairs from 750 tables over 105 domains, synthesized from (NL, SQL) benchmarks to support cross-domain NL2VIS task. The quality of nvBench has been extensively validated by 23 experts and 300+ crowd workers. Deep learning-based models training using nvBench demonstrate that nvBench can push the field of NL2VIS.
Introduction
Creating meaningful visualizations from data through natural language is a promising interaction paradigm, especially for novices, and is an essential step towards democratizing data visualization [31, 25, 12, 13, 14, 19]. Both mainstream commercial vendors (e.g., Tableau’s Ask Data [2], Microsoft Power BI [3], ThoughtSpot [4], and Amazon’s QuickSight [1]) and academic researchers [23, 29, 27, 8, 26, 9, 24, 17, 15, 16, 35, 11, 20, 6] have started to explore the techniques to support NL2VIS for decades.
Despite the importance of NL2VIS, the study of NL2VIS is still in its infancy [4]. Currently, most of the NL2VIS systems are developed mainly based on NLP statistical parsers and only support simple or constrained NL queries. Although cutting-edge deep learning-based models have human-like abilities in many NLP tasks (e.g., text classification, language translation), such techniques are not equipped to the field of NL2VIS. The main obstacle is that it lacks large-scale and high-quality benchmarks for supporting the NL2VIS task, and our goal is to fill this gap.
Given a table (or database), NL2VIS can be viewed as a machine translation task that translates natural language queries (e.g., show me the trend of COVID-19 total confirmed cases in China) to visualization queries (e.g., mark line data COVID-19 encoding x date y aggregate sum confirmed transform filter country = ‘China’ group x) so as to be rendered as a visualization specification (e.g., Vega-Lite). The key factor to making this a success is to acquire enough high-quality (NL, VIS) pairs because deep learning models require the availability of large-scale and high-quality training data.
In this paper, we present such a benchmark, namely nvBench [18], that contains 25,750 (NL, VIS) pairs over 750 tables from 105 domains to support the cross-domain NL2VIS task. Different from the common practice that builds such a benchmark by manually designing and collecting enough data and queries, we synthesize nvBench by piggybacking NL2SQL benchmarks. The intuition is based on the semantic connection between SQL queries and VIS queries: SQL queries specify what data is needed and SQL queries additionally need to specify how to visualize the data. The quality of nvBench has been validated by experts and crowd-workers, and a deep learning-based model, namely ncNet [20], training using nvBench, also verifies the power of nvBench.
1 Related Work
As shown in Figure nvBench: A Large-Scale Synthesized Dataset for Cross-Domain Natural Language to Visualization Task, there has been a surge of works on developing techniques to support translating natural languages to visualizations [29, 8, 26, 9, 17, 35, 23, 27, 20, 11, 6].
Rule-based NL2VIS Approaches. The idea of creating visualizations using NL queries was explored around two decades ago [6]. Afterward, semantic parser techniques (e.g., Stanford Core NLP Parser [21]) are becoming increasingly popular in the research of NL2VIS because these techniques can extract useful semantic information from the NL query. The Articulate [29] is an NL2VIS system that translates the user-provided NL query into a representative visualization with two steps. First, it maps the NL query into a set of explicit commands using Stanford Parser and classifies the NL query to a set of user tasks using a supervised learning method. Second, it deploys a heuristic algorithm to generate a suitable visualization based on the commands and data properties automatically. DataTone [8] mainly utilizes Stanford Core NLP Parser [21] and a set of rules to mapping an NL query into a visualization. It also develops a mixed-initiative method to handle ambiguity in the process of NL2VIS. The user can interact with the ambiguity widgets in the interface to handle the ambiguities. Eviza [26] is an NL2VIS system that allows users to have a conversation on a given visualization. Eviza develops a probabilistic grammar-based approach and a finite state machine to manage the interaction processing of the NL2VIS task. Eviza also manages syntactic and semantic ambiguity through simple GUI widgets in the interface, similar to DataTone [8]. Evizeon [9], extending Eviza’s features and introduces additional pragmatics concepts, enables users to issue standalone and follow-up NL queries to specify a new visualization or interact with an existing visualization. Note that, Ask Data [2] in Tableau is partially based on their previous studies – Eviza [26] and Evizeon [9]. DeepEye [17] demonstrates a simple rule-based method for generating VIS charts from (constrained) keyword queries. Flowsense [35] uses state-of-the-art semantic parser techniques to support NL queries in a dataflow system, which allows users to use NL query for the majority of dataflow diagram editing operations. NL4DV [23] is a Python toolkit that supports to generate data visualization using NL queries, mainly based on the NLP parser tree techniques, similar to the previous works (e.g., DataTone [8] and Flowsense [35])
NL2VIS Benchmarks. A recent work [28] collected 893 NL queries over 3 datasets by conducting an online study with 102 participants. This work characterizes the NL queries based on the phrasing (e.g., what types of keywords are used by real users) and the information contained (e.g., aggregation). Therefore, the 893 NL queries can be used to evaluate the performance of existing NL2VIS systems, or used by the developers to design their NL2VIS techniques, especially for rule-based techniques. However, this dataset has two limitations. First, the size of the dataset is too small for training the data-intensive deep learning model. Second, since this dataset is curated from 3 tables, it is hard to generalize to real-world scenarios.
Therefore, it needs a large-scale, high-quality, and realistic NL2VIS dataset for the cross-domain NL2VIS task.
Deep learning-based NL2VIS Approaches. The aforementioned studies are mainly developed based on rule-based NLP methods, which do not support well in free-form NL input. Some researchers try to support NL2VIS by applying deep learning-based NLP techniques such as language representation.
ADVISor [11], a deep learning-based pipeline, aims to create visualization relevant to the user-provided NL query. Roughly speaking, The whole pipeline of ADVISor can be divided into two steps: (1) NL2SQL step, and (2) rule-based visualization generation step. For the first step – NL2SQL, ADVISor uses WikiSQL [37], a large crowd-sourced dataset for NL2SQL task, as the training dataset. In this step, ADVISor firstly takes as input the NL query and table headers to a BERT model [7]. Next, two neural networks are trained to classify aggregation types, and relevant attributes and filter conditions. In the second step, ADVISor designs a rule-based method to automatically create a visualization based on the selected attribute, filter conditions, and aggregation type. Hence, the neural network components of ADVISor are trained to produce fragments of SQL queries from the given NL query. It means that the deep learning models of ADVISor do not directly generate the visualization results from the given NL query.
Thanks to the large number of (NL, VIS) pairs in nvBench, developers can use these pairs to train an end-to-end neural network for the NL2VIS task. ncNet [20] is a Transformer-based model for translating NL queries into visualizations. It takes nvBench as the training corpus to solve the NL2VIS task in an end-to-end way.
2 Synthesizing nvBench from NL2SQL Benchmarks
The widely used practice of producing benchmarks is through time-consuming manual labeling, e.g., providing visualizations and ask experts to write corresponding NL queries.
The main issue of the above approach is that the required experts are simply not enough. Alternatively, we propose to synthesize NL2VIS benchmarks [18] from a plethora of NL2SQL benchmarks. Because it is known that verifying results (i.e., whether an NL query is suitable for a given visualization) is much easier than writing the NL query manually, both experts and crowd-workers can help.
The rationality that NL2VIS benchmarks can be synthesized from NL2SQL benchmarks is because of the semantic connection between VIS queries and SQL queries: SQL queries specify what data is needed (e.g., columns, filtering, aggregation, sorting); and VIS queries specify both what data is needed and how to visualize (e.g., bar or line charts) – the what data parts highly overlap. Intuitively, we can piggyback NL2SQL benchmarks on the what data part and focus on synthesizing how to visualize for NL2VIS.
Briefly speaking, given a (NL, SQL) pair, our method will synthesize a set of (NL, VIS) pairs. Consider Figure 2, the input is a pair . It outputs four pairs , , , and , where (resp. ) is a pie (resp. bar) chart, and and (resp. and ) are variants of NL queries for (resp. ).
The synthesis steps from one (NL, SQL) pair to multiple (NL, VIS) pairs are summarized below (please refer to [18] for more details).
(S1) Synthesizing visualizations. It treats an SQL query as a tree structure and does tree edits (e.g., deleting some tree branches and inserting the type of visualizations), which may result in multiple trees, with each tree corresponding to one possible visualization.
(S2) Filtering “bad” visualizations. In order to ensure that each VIS query is “good” (for example, a bar chart with several hundred bars is not readable, and thus is considered to be bad), we need to filter “bad” charts. We use a pre-trained machine learning model, namely DeepEye [16], to prune synthesized bad VIS queries. DeepEye was trained on 2520/30892 labeled good/bad charts, using features such as the number of distinct values, the number of tuples, the ratio of unique values, max and min values, data type, attribute correlations, and VIS type. Given a VIS query, DeepEye will return either true (i.e., a good VIS) or false (i.e., a bad VIS).
(S3) Synthesizing NL queries. For the remaining “good” visualizations, we need to modify the input NL query for SQL (e.g., in Figure 2) to reflect the changes w.r.t. tree edits, which might result in multiple output NL queries, e.g., (resp. ) is synthesized from based on the differences between (resp. ) and . For those cases of deleting some parts of the NL query for SQL to produce the NL query for VIS, e.g., in Figure 2, we need to interact with the user to produce the NL query for VIS.
(S4) Manual verification. We asked 23 experts and 312 crowd-workers to verify the quality of synthesized (NL, VIS) pairs. Experts/crowd-workers consider 86.9%/88.7% of synthesized (NL, VIS) pairs are well-matched, i.e., scored 4 or 5 in a range with 1 for bad matches and 5 for perfect matches. As measured by [18], our synthesis method reduces the man-hour to 5.7% of developing an NL2VIS benchmark from scratch. In other words, building an NL2VIS benchmark by humans 17.5 man-hours of our method.
3 nvBench: Details
Figure 2 overviews the statistics of nvBench, synthesized from a cross-domain NL2SQL benchmark Spider [36].
nvBench has 153 databases along with 780 tables in total and covers 105 domains (e.g., finance, college). Among the columns, 68.78% of columns are categorical columns, 11.58% of columns are temporal columns, and 19.64% of columns are quantitative columns. The maximum number of rows in a table is 183,978, and the minimum number of rows is 1, with an average of 1309.65 rows.
On top of 153 databases, nvBench contains 7,274 visualizations on seven types of charts. For each visualization, nvBench provides one to several NL queries. In total, nvBench consists of 25,750 (NL, VIS) pairs. For example, Figure 3 shows a (NL, VIS) pair in the nvBench. The VIS query can be presented as the tree format as introduced in [18] or as the Vega-Zero (a Vega-Lite like language proposed in [20]). Figure 4 showcases a (NL, VIS) pair with a more complex operation, i.e., joining the data from multiple tables.
4 Developing NL2VIS Model Using nvBench
Given such a large-scale NL2VIS benchmark, some exemplary applications of nvBench including: (1) developers can analyze the character of 25,750 NL queries to derive some frequent phrases or keywords to help the design of NL2VIS interface (e.g., NL query auto-completion, NL phrases suggestion); and (2) developers can use the nvBench to train deep learning-based models for the cross-domain NL2VIS task. Next, we describe more details about how to train a deep learning model using nvBench.
ncNet: a Transformer-based seq2seq Model for NL2VIS. To learn the translation of NL queries to VIS queries, one straightforward solution is applying a sequence-to-sequence (seq2seq) model [30], similar to translating English to Chinese. As shown in Figure 5, ncNet devises a Transformer-based [34] seq2seq model that consists of two parts, an encoder and a decoder, where each part stacks of self-attention blocks. The task of an encoder is to understand the input sequence, and generate a smaller representation (i.e., a high-dimensional vector) to represent the input. The task of a decoder is to generate a sequence of outputs by taking as input. The ncNet needs to be trained with a lot of training data, in the form of (Input sequence, Output sequence) pairs. For example, a sample NL query is: draw a line chart to show the trend of cases number by each case type in Utah, and its corresponding output sequence in a Vega-Lite like language is:
mark line encoding x date y aggregate none number color cases transform filter states = ‘Utah’
For NL2VIS, we train ncNet with a lot of (NL, VIS) pairs from nvBench, such that it learns to translate from an NL query to a VIS query.
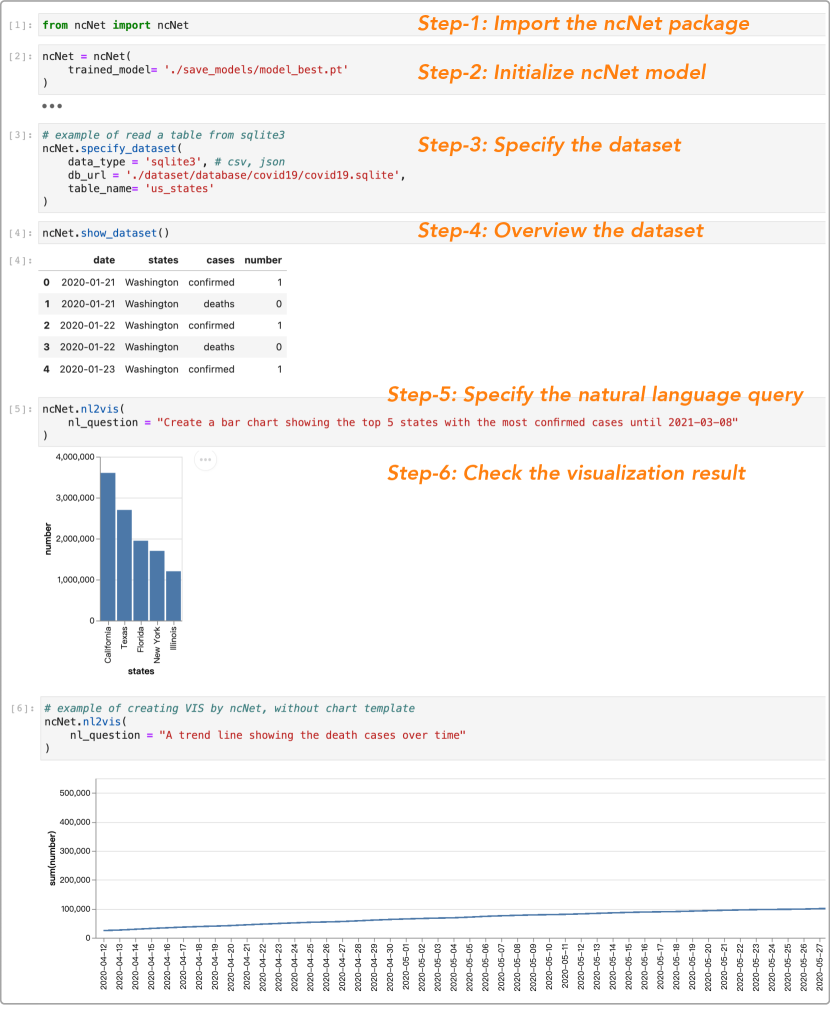
COVID-19 Use Cases. We use a COVID-19 dataset, with the four attributes (date, states, cases, number), to demonstrate how the user creates their desired visualization using NL query in the Jupyter Lab environment. We invited data visualization enthusiast Kevin who has experience in building a COVID-19 dashboard. As shown in Figure 6, Kevin first imports the ncNet’s Python package and then initializes the ncNet by passing the model parameter. Next, he can specify and overview a dataset by calling the function specify_dataset( ), show_dataset( ), respectively. Alternatively, he can explore the dataset using other packages such as Pandas-profiling. In the NL2VIS step, Kevin specifies an NL query via the function nl2vis(nl_question), and then he can check the visualization given by ncNet. If he does not satisfy with the result, he can rephrase the NL query and try again. Before, he spends hours transforming the data and writing Vega-Lite code to visualize; now, Kevin blinks and it’s done.
5 NL2VIS Benchmark: Where to GO?
There is no doubt that NL2VIS benchmarks play a significant role in spawning the boom in the study of NL2VIS. To make the performance of NL2VIS more powerful and robust in real tasks and users, the NL2VIS benchmark should cover more diversified tasks, datasets, data types, different characters of NL queries, and visualization types.
Supporting conversational NL2VIS. In real-world visual data analysis scenarios, data analysts usually perform data visualization in a conversational way, i.e., conversational visual analysis. One conversational NL query may consist of a series of standalone but relevant NL queries. Thus, how to extend the NL2VIS benchmark to support conversational visual analysis is an interesting and promising direction.
Support underspecified NL queries. In this work, we assume that an NL query can be translated to a valid VIS query , which is based on the assumption that is well specified. In practice, could be underspecified, i.e., some information to complete is not provided. From the NLP perspective, this links to the problem of NL query auto-completion [32]. From the VIS query perspective, this relates to visualization recommendation [10, 33]. Supporting underspecified NL queries is quite straightforward based on our proposal. When translating an NL query to a partial VIS tree, it just needs to complete the partial VIS tree to get many valid VIS trees and then rank them using existing works [22, 16].
Support more visualization types. Currently, nvBench only consists of seven popular visualization types. Future studies can collect (NL, VIS) pairs for other popular visualization types, e.g., heatmap and box-plot, to enrich NL2VIS benchmarks to cover more diversified tasks. Besides, if some cases, e.g., mixing two charts in a visualization and visualizations with advanced calculations, can be covered, more practical analysis tasks can be available.
Supporting domain-specified NL2VIS. Some domains, e.g., chemistry, biology, and healthcare, have their own data structures, data formats, terminology abbreviations, and special phrases of NL queries. How to extend NL2VIS benchmarks to support the NL2VIS task in these domains is important and interesting.
Collecting and characterizing NL queries. Beyond the space of NL queries and VIS covering in the NL2VIS benchmarks, we also need to understand how the real users express their NL queries in different visual analysis tasks, domains, and scenarios. Srinivasan et al. [28] have taken the first step towards this goal, but the total amount of NL queries they collect and analyze is still relatively small. The study of NL2VIS is eager to more and more samples generated by real users and tasks from the mainstream visualization vendors such as Tableau’s Ask Data [2].
Make it fully automatic. As shown in Section 2-(S3), the only part that is not automatic is to edit the NL query for tree deletions. The main challenge is to identify the part of NL corresponding to the deletions. This is doable by training a deep learning model that takes tree edits as input and NL edits as output if we have enough training data, or use some powerful language models (e.g., GPT-3 [5]). Thus, if we make the above step a success, naturally, we can synthesize as many good (NL, VIS) pairs as possible based on the rich collection of NL2SQL benchmarks.
6 Concluding Remarks.
In this paper, we have introduced nvBench, the first large-scale NL2VIS benchmark that was developed to empower deep learning-based neural machine translation for cross-domain NL2VIS task. We have discussed how to synthesize nvBench by piggybacking NL2SQL benchmarks. We have presented the statistics information about nvBench and showcased some concrete examples in nvBench. The quality of nvBench has been validated by both experts and crowd-workers. We have also introduced how to train a deep learning-based model for learning the NL2VIS translation. Our use cases show that ncNet, trained using nvBench, can work well in the NL2VIS task. We have also outlined some interesting directions about the development of NL2VIS benchmarks, to push the field of NL2VIS to its real-world applications.
Acknowledgements.
This project is supported by NSF of China (61925205, 61632016), Beijing National Research Center for Information Science and Technology (BNRist), Huawei, TAL Education, and Zhejiang Lab’s International Talent Fund for Young Professionals.References
- [1] Amazon’s QuickSight, https://aws.amazon.com/cn/blogs/aws/amazon-quicksight-q-to-answer-ad-hoc-business-questions/.
- [2] Ask Data. https://www.tableau.com/products/new-features/ask-data.
- [3] Microsoft Power BI Q&A. https://docs.microsoft.com/en-us/power-bi/create-reports/power-bi-tutorial-q-and-a.
- [4] SpotIQ AI-Driven Insignts (2nd Edition). https://www.thoughtspot.com/resources#white_paper.
- [5] T. B. Brown, B. Mann, N. Ryder, M. Subbiah, J. Kaplan, P. Dhariwal, A. Neelakantan, P. Shyam, G. Sastry, A. Askell, S. Agarwal, A. Herbert-Voss, G. Krueger, T. Henighan, R. Child, A. Ramesh, D. M. Ziegler, J. Wu, C. Winter, C. Hesse, M. Chen, E. Sigler, M. Litwin, S. Gray, B. Chess, J. Clark, C. Berner, S. McCandlish, A. Radford, I. Sutskever, and D. Amodei. Language models are few-shot learners. In NeurIPS, 2020.
- [6] K. Cox, R. E. Grinter, S. L. Hibino, L. J. Jagadeesan, and D. Mantilla. A multi-modal natural language interface to an information visualization environment. International Journal of Speech Technology, 4(3):297–314, 2001.
- [7] J. Devlin, M. Chang, K. Lee, and K. Toutanova. BERT: pre-training of deep bidirectional transformers for language understanding. In NAACL-HLT, pp. 4171–4186.
- [8] T. Gao, M. Dontcheva, and et al. Datatone: Managing ambiguity in natural language interfaces for data visualization. In UIST, 2015.
- [9] E. Hoque, V. Setlur, M. Tory, and I. Dykeman. Applying pragmatics principles for interaction with visual analytics. IEEE TVCG, 2018.
- [10] K. Z. Hu, M. A. Bakker, S. Li, and et al. Vizml: A machine learning approach to visualization recommendation. In CHI, p. 128, 2019.
- [11] C. Liu, Y. Han, R. Jiang, and X. Yuan. Advisor: Automatic visualization answer for natural-language question on tabular data. In 14th IEEE Pacific Visualization Symposium, PacificVis 2021, Tianjin, China, April 19-21, 2021, pp. 11–20. IEEE, 2021.
- [12] Y. Luo, C. Chai, X. Qin, N. Tang, and G. Li. Interactive cleaning for progressive visualization through composite questions. In 36th IEEE International Conference on Data Engineering, ICDE. IEEE, 2020.
- [13] Y. Luo, C. Chai, X. Qin, N. Tang, and G. Li. Visclean: Interactive cleaning for progressive visualization. Proc. VLDB Endow., 13(12), 2020.
- [14] Y. Luo, W. Li, T. Zhao, X. Yu, L. Zhang, G. Li, and N. Tang. Deeptrack: Monitoring and exploring spatio-temporal data - A case of tracking COVID-19 -. Proc. VLDB Endow., 13(12):2841–2844, 2020.
- [15] Y. Luo, X. Qin, C. Chai, N. Tang, G. Li, and W. Li. Steerable self-driving data visualization. IEEE Transactions on Knowledge and Data Engineering, 2020.
- [16] Y. Luo, X. Qin, N. Tang, and G. Li. Deepeye: Towards automatic data visualization. In ICDE, pp. 101–112, 2018.
- [17] Y. Luo, X. Qin, N. Tang, G. Li, and X. Wang. Deepeye: Creating good data visualizations by keyword search. In SIGMOD, 2018.
- [18] Y. Luo, N. Tang, G. Li, C. Chai, W. Li, and X. Qin. Synthesizing Natural Language to Visualization (NL2VIS) Benchmarks from NL2SQL Benchmarks. In Proceedings of the 2021 International Conference on Management of Data, SIGMOD/PODS ’21, p. 1235–1247. Available at https://sites.google.com/view/nvbench/.
- [19] Y. Luo, N. Tang, G. Li, and et al. Deepeye: A data science system for monitoring and exploring COVID-19 data. IEEE Data Eng. Bull., 2020.
- [20] Y. Luo, N. Tang, G. Li, J. Tang, C. Chai, and X. Qin. Natural language to visualization by neural machine translation. IEEE Transactions on Visualization and Computer Graphics, pp. 1–1, 2021. doi: 10 . 1109/TVCG . 2021 . 3114848
- [21] C. D. Manning, M. Surdeanu, J. Bauer, J. R. Finkel, S. Bethard, and D. McClosky. The stanford corenlp natural language processing toolkit. In ACL, pp. 55–60, 2014.
- [22] D. Moritz, C. Wang, G. L. Nelson, and et al. Formalizing visualization design knowledge as constraints: Actionable and extensible models in draco. IEEE Trans. Vis. Comput. Graph., 25(1):438–448.
- [23] A. Narechania, A. Srinivasan, and J. T. Stasko. NL4DV: A toolkit for generating analytic specifications for data visualization from natural language queries. In VIS, 2020.
- [24] X. Qin, Y. Luo, N. Tang, and G. Li. Deepeye: Visualizing your data by keyword search. In EDBT, pp. 441–444, 2018.
- [25] X. Qin, Y. Luo, N. Tang, and G. Li. Making data visualization more efficient and effective: a survey. VLDB J., 29(1):93–117, 2020.
- [26] V. Setlur, S. E. Battersby, and et al. Eviza: A natural language interface for visual analysis. In UIST, 2016.
- [27] A. Srinivasan, B. Lee, and J. T. Stasko. Interweaving multimodal interaction with flexible unit visualizations for data exploration. IEEE transactions on visualization and computer graphics, 2020.
- [28] A. Srinivasan, N. Nyapathy, B. Lee, S. M. Drucker, and J. Stasko. Collecting and characterizing natural language utterances for specifying data visualizations. In CHI, 2021.
- [29] Y. Sun, J. Leigh, A. Johnson, and S. Lee. Articulate: A semi-automated model for translating natural language queries into meaningful visualizations. In International Symposium on Smart Graphics, pp. 184–195. Springer, 2010.
- [30] I. Sutskever, O. Vinyals, and Q. V. Le. Sequence to sequence learning with neural networks. In NIPS 2014, p. 3104–3112. MIT Press, 2014.
- [31] N. Tang, E. Wu, and G. Li. Towards democratizing relational data visualization. In SIGMOD, pp. 2025–2030. ACM, 2019.
- [32] K. Trnka, D. Yarrington, and et al. The effects of word prediction on communication rate for AAC. In NAACL HLT, pp. 173–176, 2007.
- [33] M. Vartak, S. Huang, T. Siddiqui, S. Madden, and A. G. Parameswaran. Towards visualization recommendation systems. SIGMOD Rec., 2016.
- [34] A. Vaswani, N. Shazeer, N. Parmar, J. Uszkoreit, L. Jones, A. N. Gomez, L. Kaiser, and I. Polosukhin. Attention is all you need. In NIPS, 2017.
- [35] B. Yu and C. T. Silva. Flowsense: A natural language interface for visual data exploration within a dataflow system. IEEE Trans. Vis. Comput. Graph., 26(1):1–11, 2020.
- [36] T. Yu and et al. Spider: A large-scale human-labeled dataset for complex and cross-domain semantic parsing and text-to-sql task. In EMNLP.
- [37] V. Zhong and et al. Seq2sql: Generating structured queries from natural language using reinforcement learning. CoRR, abs/1709.00103, 2017.