TSRFormer: Table Structure Recognition with Transformers
Abstract.
We present a new table structure recognition (TSR) approach, called TSRFormer, to robustly recognizing the structures of complex tables with geometrical distortions from various table images. Unlike previous methods, we formulate table separation line prediction as a line regression problem instead of an image segmentation problem and propose a new two-stage DETR based separator prediction approach, dubbed Separator REgression TRansformer (SepRETR), to predict separation lines from table images directly. To make the two-stage DETR framework work efficiently and effectively for the separation line prediction task, we propose two improvements: 1) A prior-enhanced matching strategy to solve the slow convergence issue of DETR; 2) A new cross attention module to sample features from a high-resolution convolutional feature map directly so that high localization accuracy is achieved with low computational cost. After separation line prediction, a simple relation network based cell merging module is used to recover spanning cells. With these new techniques, our TSRFormer achieves state-of-the-art performance on several benchmark datasets, including SciTSR, PubTabNet and WTW. Furthermore, we have validated the robustness of our approach to tables with complex structures, borderless cells, large blank spaces, empty or spanning cells as well as distorted or even curved shapes on a more challenging real-world in-house dataset.
1. Introduction
Tables offer a means to efficiently represent and communicate structured data in many scenarios like scientific publications, financial statements, invoices, web pages, etc. Due to the trend of digital transformation, automatic table structure recognition (TSR) has become an important research topic in document understanding and attracted the attention of many researchers. TSR aims to recognize the cellular structures of tables from table images by extracting the coordinates of cell boxes and row/column spanning information. This task is very challenging since tables may have complex structures, diverse styles and contents, and become geometrically distorted or even curved during an image capturing process.
Recently, deep learning based TSR methods, e.g., (Schreiber et al., 2017; Paliwal et al., 2019; Siddiqui et al., 2019a, b; Qasim et al., 2019; Tensmeyer et al., 2019; Raja et al., 2020; Zheng et al., 2021; Xue et al., 2021; Long et al., 2021; Liu et al., 2021; Qiao et al., 2021), have made impressive progress towards recognizing undistorted tables with complex structures and diverse styles. However, these methods except Cycle-CenterNet (Long et al., 2021) cannot be directly applied to geometrically distorted or even curved tables, which appear often in camera-captured images. Although Cycle-CenterNet (Long et al., 2021) proposed an effective approach to parsing the structures of distorted bordered tables in wild complex scenes and achieved promising results on their WTW (Long et al., 2021) dataset, this work didn’t take borderless tables into account. Thus, the more challenging problem of recognizing the structures of various geometrically distorted tables still lacks investigation.
In this paper, we propose a new TSR approach, called TSRFormer, to robustly recognizing the structures of both bordered and borderless distorted tables. TSRFormer contains two effective components: 1) A two-stage DETR (Zhu et al., 2021) based separator regression module to directly predict linear and curvilinear row/column separation lines from input table images; 2) A relation network based cell merging module to recover spanning cells by merging adjacent cells generated by intersecting row and column separators. Unlike previous split-and-merge based approaches (e.g., (Tensmeyer et al., 2019)), we formulate separation line prediction as a line regression problem instead of an image segmentation problem and propose a new separator prediction approach, dubbed Separator REgression TRansformer (SepRETR), to predict separation lines from table images directly. In this way, our approach can get rid of heuristic mask-to-line modules and become more robust to distorted tables. Specifically, SepRETR predicts one reference point for each row/column separator first, then takes the features of these reference points as object queries and feeds them into a DETR (Carion et al., 2020) decoder to regress the coordinates of their corresponding separation lines directly. To make the two-stage DETR framework work efficiently and effectively for the separation line prediction task, we propose two improvements further: 1) A prior-enhanced matching strategy to solve the slow convergence issue of DETR; 2) A new cross attention module to sample features from a high-resolution convolutional feature map directly so that high localization accuracy is achieved with low computational cost. With these new techniques, our TSRFormer has achieved state-of-the-art performance on several public TSR benchmarks, including SciTSR (Chi et al., 2019), PubTabNet (Zhong et al., 2020) and WTW (Long et al., 2021). Furthermore, we have demonstrated the robustness of our approach to tables with complex structures, borderless cells, large blank spaces, empty or spanning cells as well as distorted or even curved shapes on a more challenging real-world in-house dataset.
2. Related Work
2.1. Table Structure Recognition
Early TSR methods were mainly based on handcrafted features and heuristic rules (e.g., (Laurentini and Viada, 1992; Itonori, 1993; Kieninger and Dengel, 1998; Shigarov et al., 2016; Rastan et al., 2019)), so they could only deal with simple table structures or specific data formats, such as PDF files. Later, some statistical machine learning based methods (e.g, (Ng et al., 1999; Wang et al., 2004)) were proposed to reduce the dependence on heuristic rules. However, these methods still made strong assumptions about table layouts and relied on handcrafted features, which limited their generalization ability. In recent years, many deep learning based approaches have emerged and outperformed these traditional methods significantly in terms of both accuracy and capability. These approaches can be roughly divided into three categories: row/column extraction based methods, image-to-markup generation based methods and bottom-up methods.
Row/column extraction based methods. These approaches leverage object detection or semantic segmentation methods to detect entire rows and columns first, then intersect them to form a grid of cells. DeepDeSRT (Schreiber et al., 2017) first applied an FCN-based semantic segmentation method (Long et al., 2015) to table structure extraction. TableNet (Paliwal et al., 2019) proposed an end-to-end FCN-based model to simultaneously detect tables and recognize table structures. However, these vanilla FCN based TSR methods are not robust to tables containing large blank spaces due to limited receptive fields. To alleviate this problem, methods like (Siddiqui et al., 2019b; Tensmeyer et al., 2019; Khan et al., 2019) tried different context enhancement techniques, e.g., pooling features along rows and columns of pixels on some intermediate feature maps of FCN models or using sequential models like bi-directional gated recurrent unit networks (GRU), to improve row/column segmentation accuracy. Another group of approaches (Siddiqui et al., 2019a; Hashmi et al., 2021) treated TSR as an object detection problem and used some object detection methods to directly detect the bounding boxes of rows and columns. Among these methods, only SPLERGE (Tensmeyer et al., 2019) can deal with spanning cells, which proposed to add a simple cell merging module after a row/column extraction module to recover spanning cells by merging adjacent cells. Later, several works were proposed to further improve the cell merging module. TGRNet (Xue et al., 2021) designed a network to jointly predict the spatial locations and spanning information of table cells. SEM (Zhang et al., 2022) fused the features of each cell from both vision and text modalities. Raja et al. (Raja et al., 2022) improved this “split-and-merge” paradigm by targeting row, column and cell detection as object detection tasks and forming rectilinear associations through a graph-based formulation for generating row/column spanning information. Different from this two-stage paradigm, Zou et al. (Zou and Ma, 2020) proposed a one-stage approach to predicting the real row and column separators to handle spanning cells. Although these methods have achieved impressive performance on some previous benchmarks, e.g., (Göbel et al., 2013; Chi et al., 2019; Zhong et al., 2020), they cannot handle distorted tables because they rely on an assumption that tables are axis-aligned. Our previous work, RobusTabNet (Ma et al., 2022), proposed a new split-and-merge based method by incorporating a spatial CNN module (Pan et al., 2018) into an image segmentation based split module to improve its robustness to distorted tables, which makes this new TSR approach able to recognize distorted tables robustly to some extend. However, the performance of this approach is affected by a heuristic mask-to-line module, which struggles with some low-quality separator masks predicted by the split module.
Image-to-markup generation based methods. This type of methods treat TSR as an image-to-markup generation problem and adopt existing image-to-markup models to directly convert each source table image into target presentational markup that fully describes its structure and cell contents. Prior arts tried different image-to-markup models to to convert table images into LaTeX symbols (Deng et al., 2019; He et al., 2021) or HTML sequences (Li et al., 2020; Zhong et al., 2020). These methods rely on a large amount of data to train their models and still struggle with big and complex tables (Li et al., 2020; Zhong et al., 2020).
Bottom-up methods. Bottom-up methods can be further categorized into two groups. The first group (Qasim et al., 2019; Chi et al., 2019; Li et al., 2021a; Xue et al., 2019) treats words or cell contents as nodes in a graph and uses graph neural networks to predict whether each sampled node pair is in a same cell, row or column. However, the cell contents used by these methods are not directly available when the inputs are table images. To bypass this problem, the second group of methods (Zheng et al., 2021; Prasad et al., 2020; Raja et al., 2020; Li et al., 2021b; Qiao et al., 2021; Liu et al., 2021) detects the bounding boxes of table cells or cell contents directly and uses different methods to group them into rows and columns. After cell detection, methods like (Zheng et al., 2021; Li et al., 2021b; Qiao et al., 2021) used heuristic rules to cluster detected cells into rows and columns. CascadeTabNet (Prasad et al., 2020) recovered cell relations based on some rules for borderless tables while intersected detected separation lines to extract the grid of bordered tables. TabStruct-Net (Raja et al., 2020) proposed an end-to-end network to detect cells and predict cell relations jointly. FLAG-Net (Liu et al., 2021) predicted adjacency relationships between detected word bounding boxes rather than cells. However, these approaches fail to handle tables containing a large number of empty cells or distorted/curved tables. Cycle-CenterNet (Long et al., 2021) detected the vertices and center points of cells simultaneously, and grouped the cells into tabular objects by learning the common vertices. This method can handle curved bordered tables in wild scenes, but does not take borderless tables into account.
2.2. DETR and Its Variants
DETR (Carion et al., 2020) is a novel Transformer-based (Vaswani et al., 2017) object detection algorithm, which introduced the concept of object query and set prediction loss to object detection. These novel attributes make DETR get rid of many hand-designed components in previous CNN-based object detectors like anchor design and non-maximum suppression (NMS). However, DETR has its own issues: 1) Slow training convergence; 2) Unclear physical meaning of object queries; 3) Hard to leverage high-resolution feature maps due to high computational complexity. Deformable DETR (Zhu et al., 2021) proposed several effective techniques to address these issues: 1) Formulating queries as 2D anchor points; 2) Designing a deformable attention module that only attends to certain sampling points around a reference point to efficiently leverage multi-scale feature maps; 3) Proposing a two-stage DETR framework and an iterative bounding box refinement algorithm to further improve accuracy. Inspired by the concept of reference point in Deformable DETR, some follow-up works attempted to address the slow convergence issue by giving spatial priors to the object query. For instance, Conditional DETR (Meng et al., 2021) divided the cross-attention weights into two parts, i.e., content attention weights and spatial attention weights, and proposed a conditional spatial query to make each cross attention head in each decoder layer focus on a different part of an object. Anchor DETR (Wang et al., 2021) generated object queries from 2D anchor points directly. DAB-DETR (Liu et al., 2022) proposed to use 4D anchor box coordinates to represent queries and dynamically update boxes in each decoder layer. SMCA (Gao et al., 2021) first predicted a reference 4D box for each query and then directly generated its related spatial cross attention weights with a Gaussian prior in the transformer decoder. Inspired by two-stage Deformable DETR, Efficient DETR (Yao et al., 2021) took top-K scored proposals output from the first dense prediction stage and their encoder features as the reference boxes and object queries, respectively. Different from the above works, TSP (Sun et al., 2021) discarded the whole DETR decoder and proposed an encoder-only DETR. Recently, DN-DETR (Li et al., 2022) pointed out that the bipartite matching algorithm used in Hungarian loss is another reason for slow convergence and proposed a denoising based training method to speed up DETR convergence.
3. Methodology
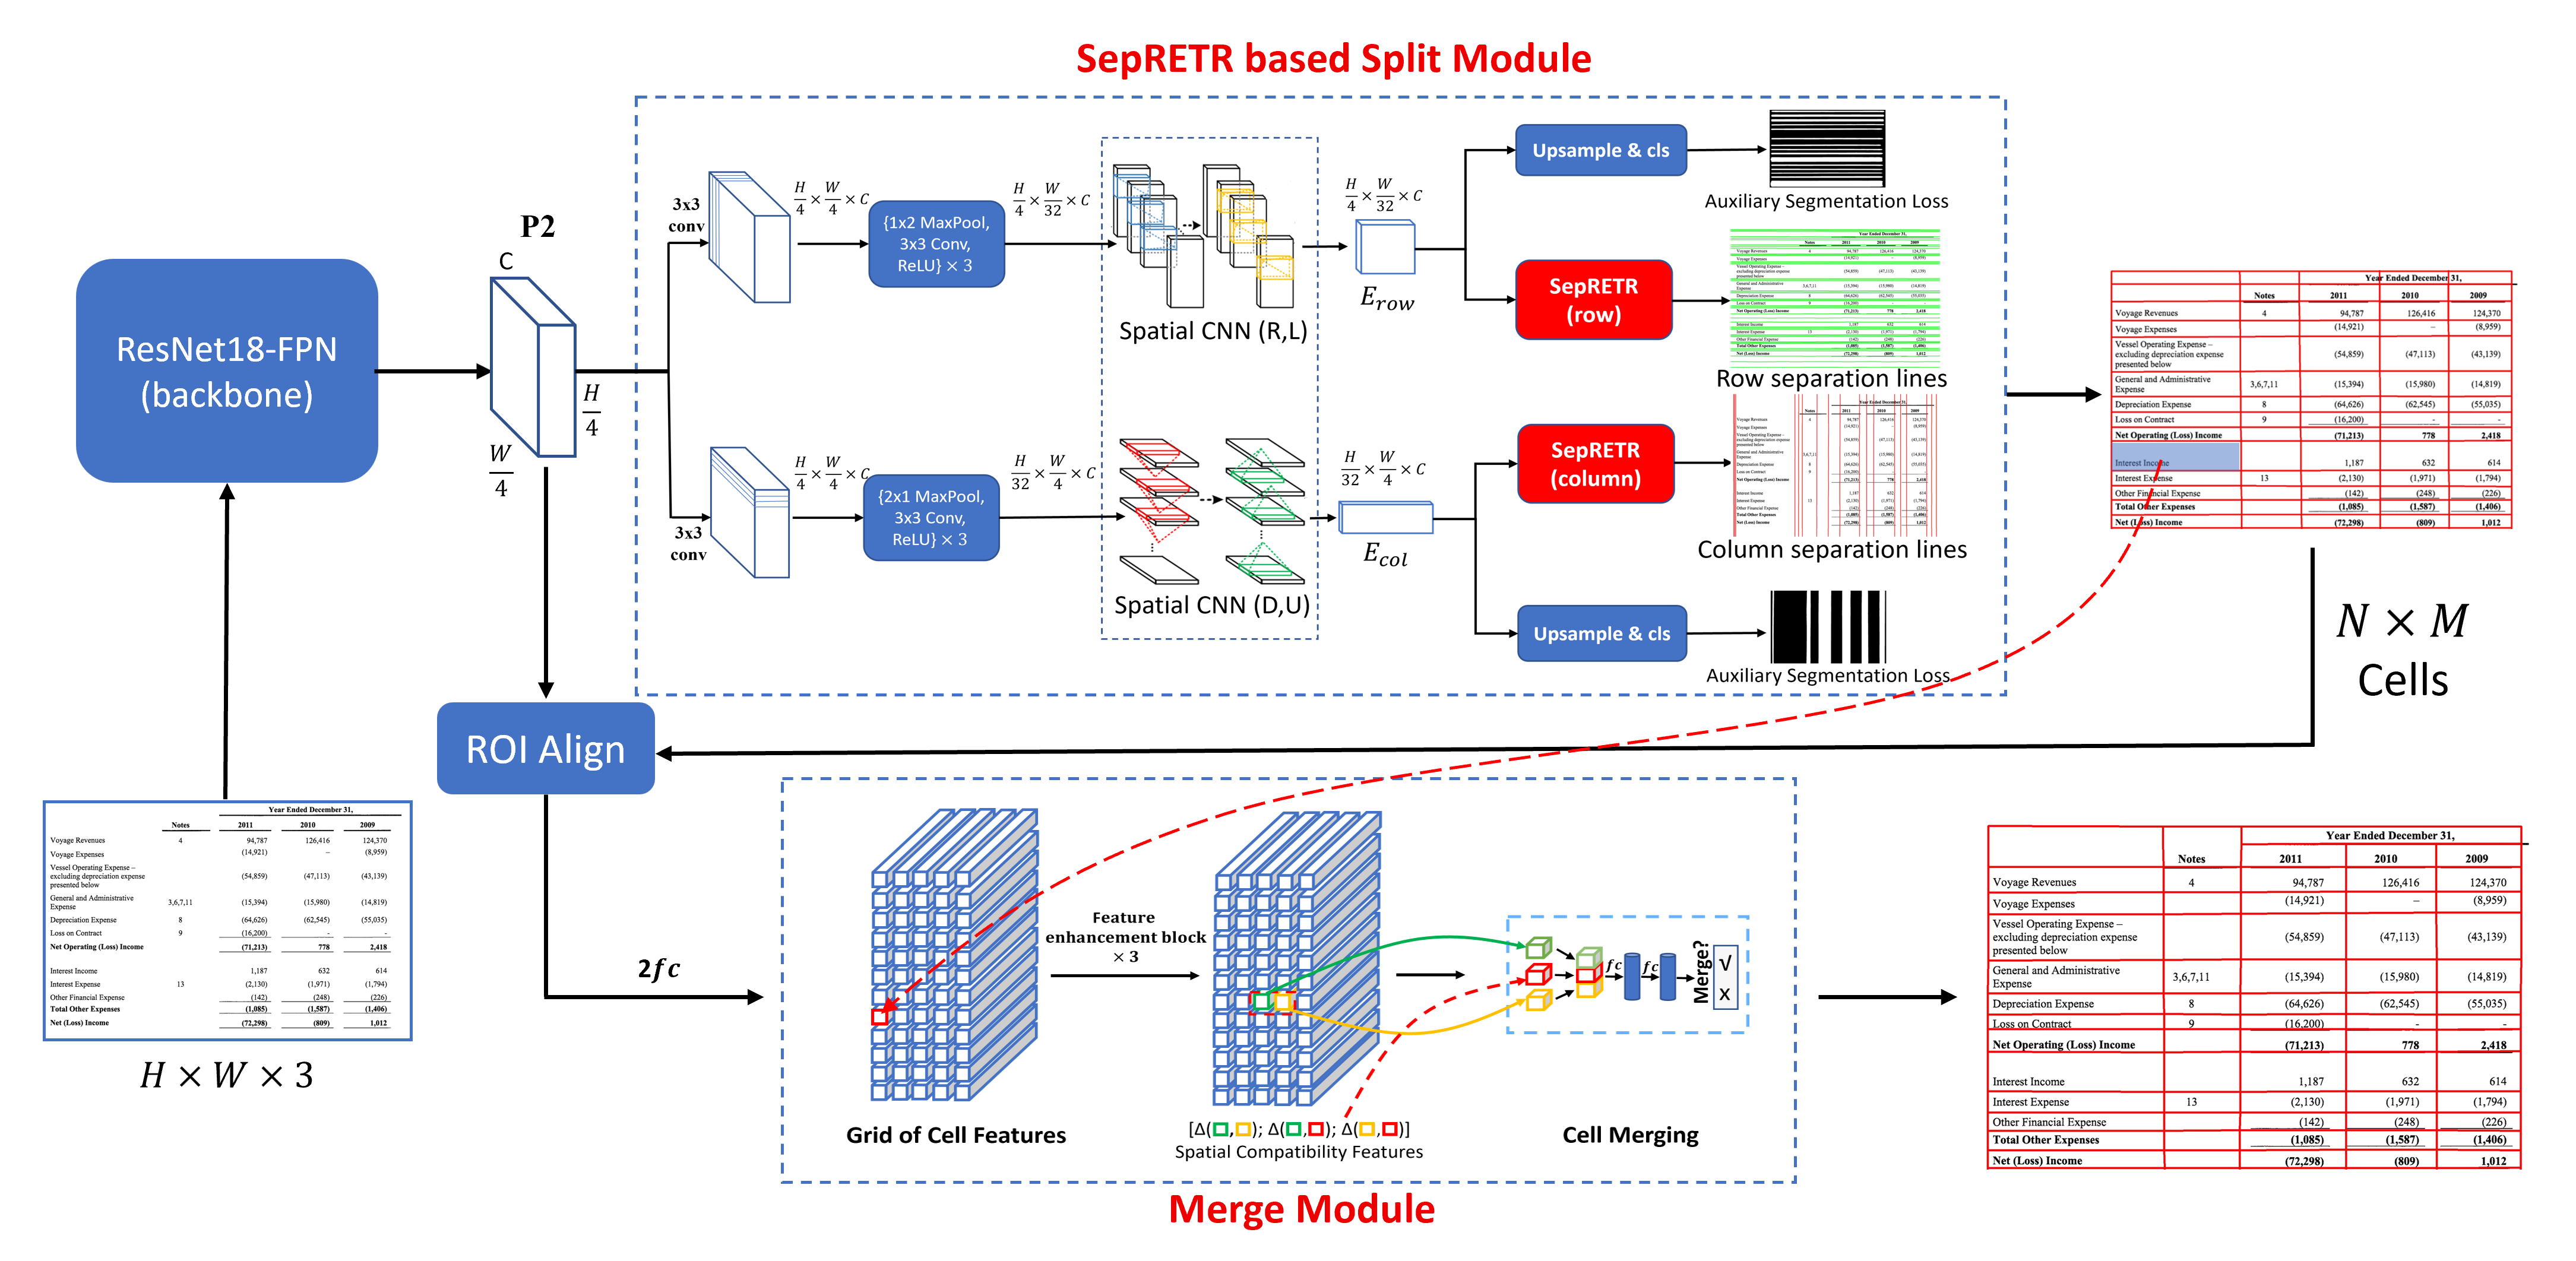
As depicted in Fig. 1, TSRFormer contains two key components: 1) A SepRETR based split module to predict all row and column separation lines from each input table image; 2) A relation network based cell merging module to recover spanning cells. These two modules are attached to a shared convolutional feature map generated by a ResNet-FPN backbone (He et al., 2016; Lin et al., 2017a).
3.1. SepRETR based Split Module
In the split module, two parallel branches are attached to the shared feature map to predict row and column separators, respectively. Each branch comprises three modules: (1) A feature enhancement module to generate a context-enhanced feature map; (2) A SepRETR based separation line prediction module; (3) An auxiliary separation line segmentation module. In subsequent sections, we will take the row separation line prediction branch as an example to introduce the details of these three modules.
Feature enhancement. As shown in Fig. 1, we add a convolutional layer and three repeated down-sampling blocks, each composed of a sequence of a max-pooling layer, a convolutional layer and a ReLU activation function, after sequentially to generate a down-sampled feature map first. Then, following (Ma et al., 2022), two cascaded spatial CNN (SCNN) (Pan et al., 2018) modules are attached to to enhance its feature representation ability further by propagating contextual information across the whole feature map in rightward and leftward directions. Take the rightward direction as an example, the SCNN module splits into slices along the width direction and propagates the information slice by slice from left to right. For each slice, it is first sent to a convolutional layer with the kernel size of and then merged with the next slice by element-wise addition. With the help of SCNN modules, each pixel in the output context-enhanced feature map can leverage the structural information from both sides for better representation ability.

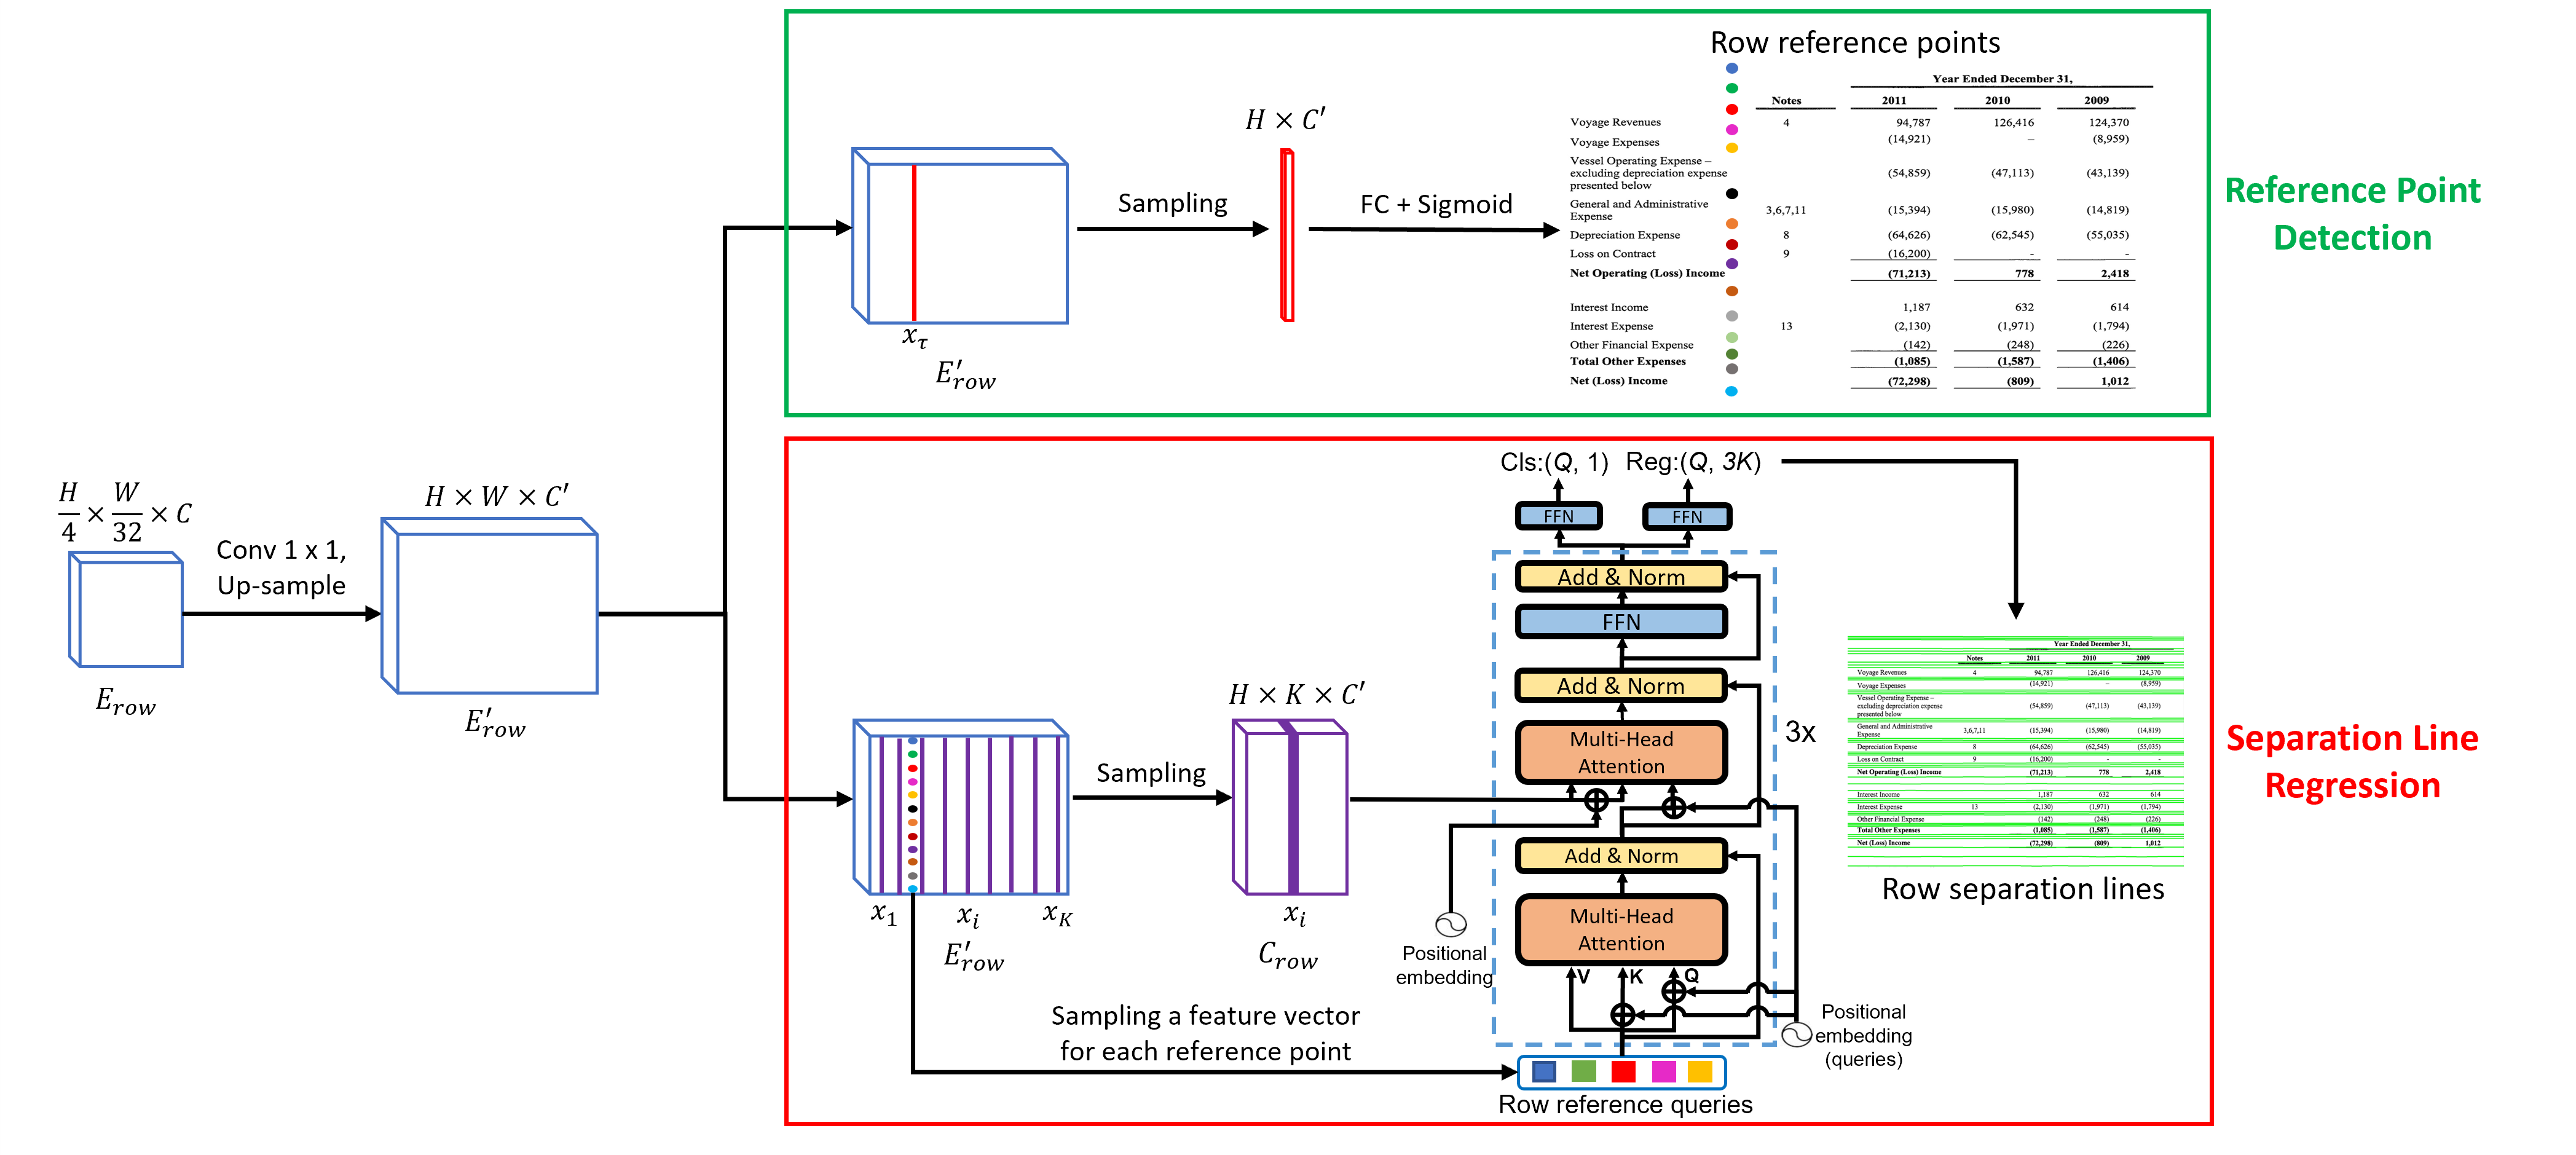
SepRETR based separation line prediction. As shown in Fig. 3, we use three parallel curvilinear lines to represent the top boundary, center line and bottom boundary of each row separator, respectively. Each curvilinear line is represented by points, whose x-coordinates are set to , respectively. For each row separator, the y-coordinates of its points are predicted by our SepRETR model directly. Here, we set for the x-coordinate. For y-coordinates in the column branch, we only need replace with . As depicted in Fig. 2, our SepRETR contains two modules: a reference point detection module and a DETR decoder for separation line regression. The reference point detection module tries to predict a reference point for each row separator from the enhanced feature map first. The features of detected reference points are taken as object queries and fed into a DETR decoder to generate an enhanced embedding for each query. These enhanced query embeddings are then independently decoded into separation line coordinates and class labels by feedforward networks. Both of the two modules are attached to a shared high-resolution feature map , which is generated by adding a convolutional layer and an up-sampling layer sequentially to .
1) Reference point detection. This module tries to predict a reference point for each row separator at a fixed position along the width direction of the raw image. To this end, each pixel in the column of is fed into a sigmoid classifier to predict a score to estimate the probability that a reference point is located at its position . Here, we set the hyper-parameter as for row line prediction and as for column line prediction in all experiments. Given the probability of each pixel in the column of , we apply non-maximal suppression by using a max-pooling layer on this column to remove duplicate reference points. After that, top-100 row reference points are selected and further filtered by a score threshold of . The remaining row reference points are taken as the object queries of the DETR decoder in the row separation line regression module.
2) Separation line regression. For the sake of efficiency, we don’t use transformer encoders to enhance the features output by the CNN backbone. Instead, we concatenate the , and columns of the high-resolution feature map to create a new down-sampled feature map . Then, the features of row reference points extracted from at their positions are treated as object queries and fed into a 3-layer transformer decoder to interact with for separation line regression. The positional embedding of position is generated by concatenating the sinusoidal embeddings of normalized coordinates and , which is the same as in DETR. After enhanced by the transformer decoder, the feature of each query is fed into two feedforward networks for classification and regression, respectively. The ground truth of y-coordinates for row separator regression are normalized to .
Prior-enhanced bipartite matching. Given a set of predictions and their corresponding ground truth objects from an input image, DETR used the Hungarian algorithm to assign ground-truth labels to the system predictions. However, it is found that the original bipartite matching algorithm in DETR is unstable in the training stage (Li et al., 2022), i.e., a query could be matched with different objects in a same image in different training epochs, which slows down model convergence significantly. We find that most of the reference points detected in the first stage locate between the top and bottom boundaries of their corresponding row separators consistently in different training epochs, so we leverage this prior information to match each reference point with its closest ground-truth (GT) separator directly. In this way, the matching results will become stable during training. Specifically, we generate a cost matrix by measuring the distance between each reference point and each GT separator. If a reference point is located between the top and bottom boundaries of a GT separator, the cost is set to the distance from this reference point to the GT reference point of this separator. Otherwise, the cost is set to . Based on this cost matrix, we use the Hungarian algorithm to produce an optimal bipartite matching between reference points and ground truth separators. After getting the optimal matching result, we further remove the pair with cost to bypass unreasonable label assignments. The experiments in Sec. 4.4 show that the convergence of our SepRETR becomes much faster with our prior-enhanced bipartite matching strategy.
Auxiliary separation line segmentation. This auxiliary branch aims to predict whether each pixel is located in the region of any separator. We add an up-sampling operation followed by a convolutional layer and a sigmoid classifier after to predict a binary mask for calculating this auxiliary loss.
3.2. Relation Network based Cell Merging
After separation line prediction, we intersect row lines with column lines to generate a grid of cells and use a relation network (Zhang et al., 2017) to recover spanning cells by merging some adjacent cells. As shown in Fig. 1, we first use RoI Align algorithm (He et al., 2017) to extract a feature map from based on the bounding box of each cell, which is then fed into a two-layer MLP with 512 nodes at each layer to generate a 512-d feature vector. These cell features can be arranged in a grid with rows and columns to form a feature map , which is then enhanced by three repeated feature enhancement blocks to obtain wider context information and fed into a relation network to predict the relationship between adjacent cells. Each feature enhancement block contains three parallel branches with a row-level max-pooling layer, a column-level max-pooling layer and a 3x3 convolutional layer, respectively. The output feature maps of these three branches are concatenated together and convoluted by a convolutional layer for dimension reduction. In the relation network, for each pair of adjacent cells, we concatenate their features and an 18-d spatial compatibility feature introduced in (Zhang et al., 2017). A binary classifier is then applied on this feature to predict whether these two cells should be merged or not. The classifier is implemented with a 2-hidden-layer MLP with 512 nodes at each hidden layer and a sigmoid activation function.
3.3. Loss Function
The loss functions for training the split module and the cell merging module in TSRFormer are defined in this section. For the split module, we take row separator prediction as an example, and denote the corresponding loss items as . Likewise, we can also calculate the losses for column separator prediction, denoted as .
Reference point detection. We adopt a variant of focal loss (Lin et al., 2017b) to train the row reference point detection module:
| (1) |
where is the number of row separation lines, and are two hyper-parameters set to 2 and 4 respectively as in (Law and Deng, 2018), and are the predicted and ground-truth labels for the pixel in the column of . Here, has been augmented with unnormalized Gaussians, which are truncated at the boundary of separators, to reduce the penalty around the ground-truth reference point locations. Specifically, let denote the ground-truth reference point for the row separator, which is the intersection point of the center line of this row separator and the vertical line . The vertical distance between the top and bottom boundaries of the row separator is taken as its thickness, denoted as . Then, can be defined as follows:
| (2) |
where is adaptive to the thickness of the separator to make sure that within this row separator is no less than 0.1.
Separation line regression. Let denote the set of ground-truth row separators, where and indicate the target class and row separator position respectively, denote the set of predictions. After getting the optimal bipartite matching result , the loss of row separation line regression can be calculated as:
| (3) |
where is focal loss and is L1 loss.
Auxiliary segmentation loss. The auxiliary segmentation loss of row separators is a binary cross-entropy loss:
| (4) |
where denotes the set of sampled pixels from , and denote the predicted and ground-truth labels for the pixel in respectively. is 1 only if this pixel is located within a row separator, otherwise it is 0.
Cell merging. The loss of the cell merging module is a binary cross-entropy loss:
| (5) |
where denotes the set of sampled cell pairs, and denote the predicted and ground-truth labels for the cell pair, respectively.
Overall loss. All the modules in TSRFormer can be trained jointly. The overall loss function is as follows:
| (6) |
where is a control parameter set to 0.2 in our experiments.
4. Experiments
4.1. Datasets and Evaluation Protocols
We conduct experiments on three popular public benchmarks, including SciTSR (Chi et al., 2019), PubTabNet (Zhong et al., 2020) and WTW (Long et al., 2021), to verify the effectiveness of the proposed method. Moreover, we also collected a more challenging in-house dataset, which includes many challenging tables with complex structures, borderless cells, large blank spaces, empty or spanning cells as well as distorted or even curved shapes, to demonstrate the superiority of our TSRFormer.
SciTSR (Chi et al., 2019) contains 12,000 training samples and 3,000 testing samples of axis-aligned tables cropped from scientific literatures. There are also 716 complicated tables selected by authors from the testing set to create a more challenging test subset, called SciTSR-COMP. In this dataset, the cell adjacency relationship metric (Göbel et al., 2013) is used as the evaluation metric.
PubTabNet (Zhong et al., 2020) contains 500,777 training, 9,115 validating, and 9,138 testing images generated by matching the XML and PDF representations of scientific articles. All the tables are axis-aligned. Since the annotations of the testing set are not released, we only report results on the validation set. This work proposed a new Tree-Edit-Distance-based Similarity (TEDS) metric for table recognition task, which can identify both table structure recognition and OCR errors. However, taking OCR errors into account may cause unfair comparison because of different OCR models used by different TSR methods. Some recent works (Zheng et al., 2021; Raja et al., 2020; Qiao et al., 2021) have proposed a modified TEDS metric named TEDS-Struct to evaluate table structure recognition accuracy only by ignoring OCR errors. We also use this modified metric to evaluate our approach on this dataset.
WTW (Long et al., 2021) contains 10,970 training images and 3,611 testing images collected from wild complex scenes. This dataset focuses on bordered tabular objects only and contains the annotated information of table id, tabular cell coordinates and row/column information. We crop table regions from original images for both training and testing, and follow (Long et al., 2021) to use the cell adjacency relationship (IoU=0.6) (Göbel et al., 2012) as the evaluation metric of this dataset.
In-House dataset contains 40,590 training images and 1,053 testing images, cropped from heterogeneous document images including scientific publications, financial statements, invoices, etc. Most images in this dataset are captured by cameras so tables in these images may be skewed or even curved. Some examples can be found in Fig. 4 and Fig. 5. The cTDaR TrackB metric (Gao et al., 2019) is used for evaluation. We use GT text boxes as table contents and report results based on IoU=0.9.

| Methods | SciTSR (%) | SciTSR-COMP (%) | ||||
| Prec. | Rec. | F1 | Prec. | Rec. | F1 | |
| TabStruct-Net (Raja et al., 2020) | 92.7 | 91.3 | 92.0 | 90.9 | 88.2 | 89.5 |
| GraphTSR (Chi et al., 2019) | 95.9 | 94.8 | 95.3 | 96.4 | 94.5 | 95.5 |
| LGPMA (Qiao et al., 2021) | 98.2 | 99.3 | 98.8 | 97.3 | 98.7 | 98.0 |
| FLAG-Net (Liu et al., 2021) | 99.7 | 99.3 | 99.5 | 98.4 | 98.6 | 98.5 |
| TSRFormer | 99.5 | 99.4 | 99.4 | 99.1 | 98.7 | 98.9 |
| TSRFormer* | 99.7 | 99.6 | 99.6 | 99.4 | 99.1 | 99.2 |
| Methods | Training Dataset | TEDS (%) | TEDS-Struct (%) |
|---|---|---|---|
| EDD (Zhong et al., 2020) | PubTabNet | 88.3 | - |
| TableStruct-Net (Raja et al., 2020) | SciTSR | - | 90.1 |
| GTE (Zheng et al., 2021) | PubTabNet | - | 93.0 |
| LGPMA (Qiao et al., 2021) | PubTabNet | 94.6 | 96.7 |
| FLAG-Net (Liu et al., 2021) | SciTSR | 95.1 | - |
| TSRFormer | PubTabNet | - | 97.5 |
4.2. Implementation Details
All experiments are implemented in Pytorch v1.6.0 and conducted on a workstation with 8 Nvidia Tesla V100 GPUs. We use ResNet18-FPN as the backbone and set the channel number of to 64 in all experiments. The weights of RestNet-18 are initialized with a pre-trained model for the ImageNet classification task. The models are optimized by AdamW (Loshchilov and Hutter, 2017) algorithm with batch size 16. We use a polynomial decay schedule with the power of 0.9 to decay learning rate, and the initial learning rate, betas, epsilon and weight decay are set as 1e-4, (0.9, 0.999), 1e-8 and 5e-4, respectively. Synchronized BatchNorm is applied during training. In SepRETR based split modules, we set the channel number of / to 256, and the query dimension, head number and dimension of feedforward networks in transformer decoders to 256, 16 and 1024, respectively.
In the training phase, we randomly rescale the shorter side of table images to a number in {416, 512, 608, 704, 800} while keeping the aspect ratio for all datasets except WTW. For WTW, we generate the ground-truth (GT) separation lines by extending the borders of annotated cells and follow (Long et al., 2021) to resize both sides of each training image to 1024 pixels. Given the GT of separation lines, we follow (Ma et al., 2022) to generate the GT masks of auxiliary segmentation branches in split module and the GT of cell merging module. Then, the center line and two boundaries of each mask will be considered as the GT of regression targets. In each image, a mini-batch of 1024 positive pixels and 1024 negative pixels are randomly sampled for each auxiliary segmentation branch. Furthermore, we sample a mini-batch of 64 hard positive and 64 hard negative cell pairs for the cell merging module. The hard samples are selected with the OHEM (Shrivastava et al., 2016) alogrithm. During training, we first train the reference point detection and auxiliary segmentation modules jointly for epochs and then jointly train these two modules and the separation line regression module for epochs. Finally, the cell merging module is further added and jointly trained for another epochs. Here, is set as 12 for PubTabNet and 20 for the other datasets.
In the testing phase, we rescale the longer side of each image to 1024 while keeping the aspect ratio for SciTSR, PubTabNet and in-house dataset. For WTW, the strategy is the same as in training.
| Methods | Prec. (%) | Rrec. (%) | F1-score (%) |
|---|---|---|---|
| Cycle-CenterNet (Long et al., 2021) | 93.3 | 91.5 | 92.4 |
| TSRFormer | 93.7 | 93.2 | 93.4 |
| Methods | Dataset | Prec. (%) | Rec. (%) | F1. (%) | TEDS-Struct (%) |
|---|---|---|---|---|---|
| SPLERGE | SciTSR | 99.3 | 98.9 | 99.1 | - |
| TSRFormer | SciTSR | 99.5 | 99.4 | 99.4 | - |
| SPLERGE | SciTSR-COMP | 98.8 | 98.0 | 98.4 | - |
| TSRFormer | SciTSR-COMP | 99.1 | 98.7 | 98.9 | - |
| SPLERGE | PubTabNet | - | - | - | 97.1 |
| TSRFormer | PubTabNet | - | - | - | 97.5 |
| SPLERGE | In-house | 85.4 | 82.3 | 83.8 | - |
| TSRFormer | In-house | 95.1 | 95.3 | 95.2 | - |

4.3. Comparisons with Prior Arts
We compare our proposed TSRFormer with several state-of-the-art methods on public SciTSR, PubTabNet and WTW datasets. For SciTSR, since the evaluation tool provided by the authors contains two different settings (consider or ignore empty cells) and some previous works did not explain which one they used, we report the results of both settings. As reported in Table 1, our approach has achieved state-of-the-art performance on the testing set and the complicated subset, respectively. The excellent result on SciTSR-COMP demonstrates that our method is more robust to complicated tables. On PubTabNet, as shown in Table 2, our method has achieved 97.5% in TEDS-Struct score, which is 0.8% better than that of LGPMA (the winner of ICDAR 2021 Competition on Scientific Literature Parsing Task B). To verify the effectiveness of our approach on bordered distorted/curved tabular objects in wild scenes, we conduct experiments on WTW dataset and the results in Table 3 show that our method is 1.0% better than Cycle-CenterNet (specially designed for this scenario) in F1-score.
In order to verify the effectiveness of TSRFormer for more challenging borderless tables, we re-implement another split-and-merge based method SPLERGE (Tensmeyer et al., 2019) and compare our approach with it on serveral datasets. For fair comparison, we leverage the same model architecture of TSRFormer and just implement another separation line prediction module which first enhances feature maps by row/column level poolings and then predict axis-aligned separators through classifying pixels in horizantal/vertical slices. As shown in Table 4, the re-implemented SPLERGE can achieve competitve results on SciTSR and PubTabNet datasets while it is still 11.4% worse than TSRFormer in F1-score on our challenging in-house dataset. The qualitative results in Fig. 5 and Fig. 4 illustrate that our approach is robust to tables with complex structures, borderless cells, large blank spaces, empty or spanning cells as well as distorted or even curved shapes.
| SCNN | Aux-seg. | SepRETR | Cell Merging | F1. (%) | |
| Segmentation based | ✓ | 83.5 | |||
| ✓ | ✓ | 90.0 | |||
| ✓ | ✓ | ✓ | 92.3 | ||
| Regression based | ✓ | 88.6 | |||
| ✓ | ✓ | 91.0 | |||
| ✓ | ✓ | ✓ | 92.6 | ||
| ✓ | ✓ | ✓ | ✓ | 95.2 |
| Cross-attention Feature | Transformer Decoder | Set Prediction | F1. (%) |
|---|---|---|---|
| — | 90.5 | ||
| — | ✓ | 90.7 | |
| ✓ | 92.2 | ||
| ✓ | ✓ | 92.1 | |
| ✓ | ✓ | 92.6 |
| Matching Strategy | #Epochs | F1. (%) |
|---|---|---|
| Original in DETR | 20 | 90.1 |
| Prior-enhanced | 20 | 92.6 |
| Original in DETR | 40 | 91.6 |
| Prior-enhanced | 40 | 92.8 |
4.4. Ablation Studies
We conduct a series of experiments to evaluate the effectiveness of different modules in our approach on our in-house dataset.
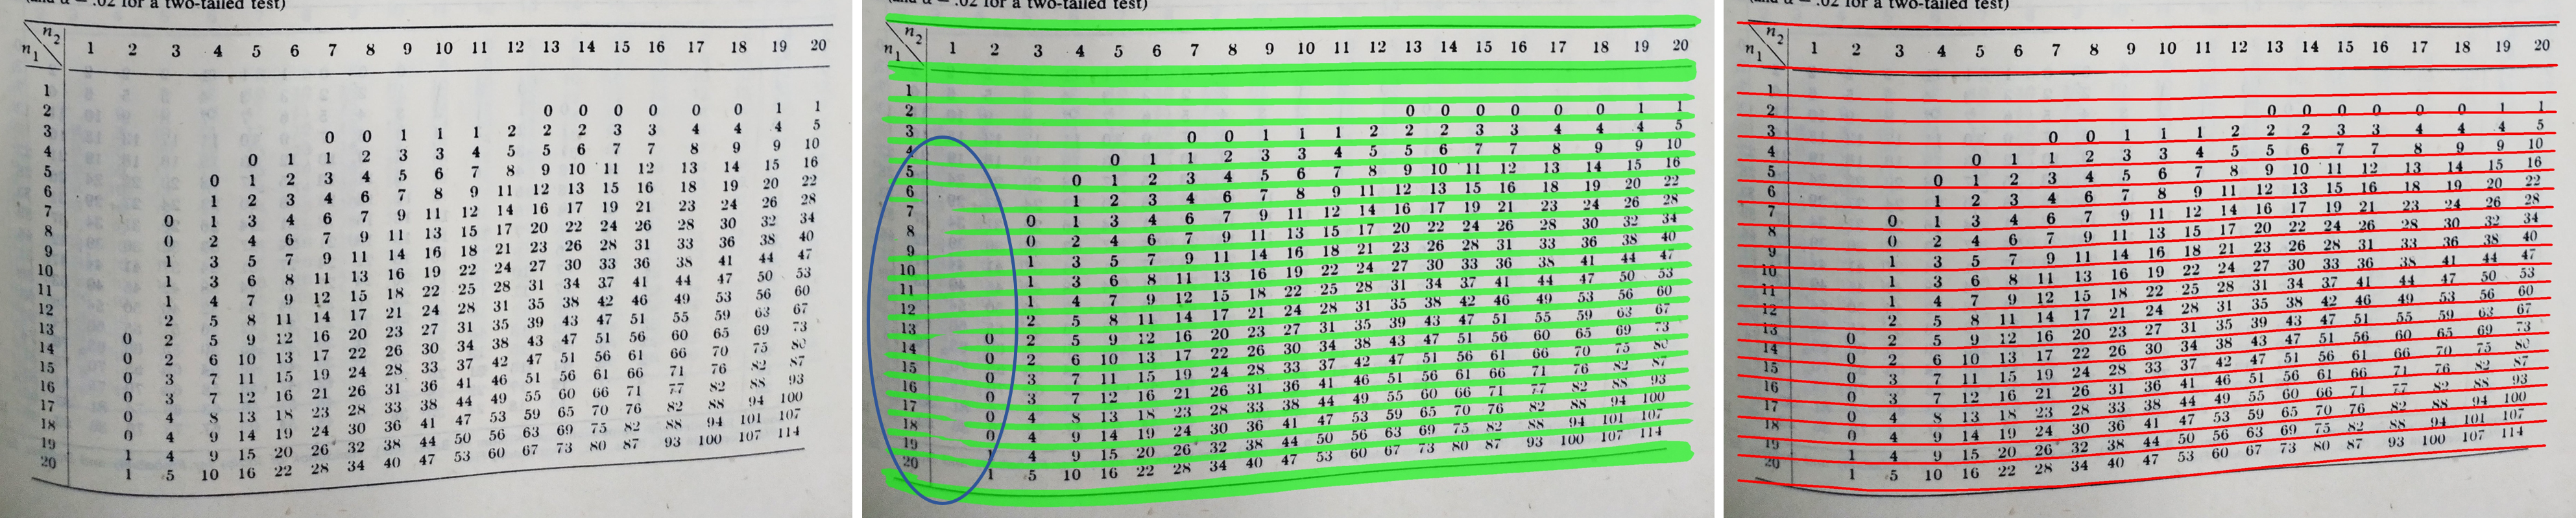
Effectiveness of SepRETR based split module. To verify the effectiveness of our regression based separator prediction module, we follow RobusTabNet (Ma et al., 2022) to implement another segmentation based split module by removing the SepRETR based separation line regression module and directly using auxiliary segmentation branches for separation line prediction. The heuristic mask-to-line module is also the same as in (Ma et al., 2022). The results in Table 5 show that our separator regression module is significantly better than the segmentation based split module. Fig. 6 shows some qualitative results. It’s very hard for the post-processing module to handle such low-quality masks well. In contrast, our regression based approach is heuristics free and robust to such challenging tables.
Ablation studies of the design of SepRETR. We also conduct the following ablation studies to further examine the contributions of three key components in SepRETR, i.e., the transformer decoder, features used in cross-attention and set prediction. For the experiments without set prediction, we design a heuristic rule for label assignment. If a reference point is located between the two boundaries of a separator, its corresponding query is treated as a positive sample and the regression target is the separator it locates in. Otherwise, the query of this reference point is a negative sample. Since this strategy may assign more than one queries to a separation line, to remove duplicate results, we apply NMS on polygons generated from the two boundaries of each predicted line. As shown in Table 6, using transformer decoders to help each query leverage both global context and local information can significantly improve the performance of SepRETR based split module. Moreover, the last two rows in Table 6 show that using sampled high-resolution feature map and can further improve the F1-score by 0.5%. Although the result without set prediction is good, we find that this approach is very sensitive to some heuristic designs like the rules of label assignment and NMS. On the contrary, training SepRETR with set prediction loss can not only achieve better results, but also get rid of the limitations of such heuristic designs.
Effectiveness of prior-enhanced bipartite matching strategy. We conduct several experiments by training the SepRETR based split module with different matching strategies and epochs. As shown in Table 7, training the model with the original strategy in DETR by 40 epochs achieves much higher accuracy than training by 20 epochs, which means the split module has not fully converged. In contrast, using the proposed prior-enhanced matching strategy can achieve better results. The small performance gap between models trained with 20 and 40 epochs shows that these two models have converged well, which demonstrates that our prior-enhanced matching strategy can make convergence much faster.
5. Conclusion
In this paper, we presented TSRFormer, a new approach for table structure recognition, which contains two effective components: a SepRETR based split module for separation line prediction and a relation network based cell merging module for spanning cell recovery. Compared with previous image segmentation based separation line detection methods, our SepRETR-based separation line regression approach can achieve higher TSR accuracy without relying on heuristic mask-to-line modules. Furthermore, experimental results show that the proposed prior-enhanced bipartite matching strategy can accelerate the convergence speed of two-stage DETR effectively. Consequently, our approach has achieved state-of-the-art performance on three public benchmarks, including SciTSR, PubTabNet and WTW. We have further validated the robustness of our approach to tables with complex structures, borderless cells, large blank spaces, empty or spanning cells as well as distorted or curved shapes on a more challenging real-world in-house dataset.
References
- (1)
- Carion et al. (2020) Nicolas Carion, Francisco Massa, Gabriel Synnaeve, Nicolas Usunier, Alexander Kirillov, and Sergey Zagoruyko. 2020. End-to-end object detection with transformers. In European conference on computer vision. Springer, 213–229.
- Chi et al. (2019) Zewen Chi, Heyan Huang, Heng-Da Xu, Houjin Yu, Wanxuan Yin, and Xian-Ling Mao. 2019. Complicated table structure recognition. arXiv preprint arXiv:1908.04729 (2019).
- Deng et al. (2019) Yuntian Deng, David Rosenberg, and Gideon Mann. 2019. Challenges in end-to-end neural scientific table recognition. In 2019 International Conference on Document Analysis and Recognition (ICDAR). IEEE, 894–901.
- Gao et al. (2019) Liangcai Gao, Yilun Huang, Hervé Déjean, Jean-Luc Meunier, Qinqin Yan, Yu Fang, Florian Kleber, and Eva Lang. 2019. ICDAR 2019 competition on table detection and recognition (cTDaR). In 2019 International Conference on Document Analysis and Recognition (ICDAR). IEEE, 1510–1515.
- Gao et al. (2021) Peng Gao, Minghang Zheng, Xiaogang Wang, Jifeng Dai, and Hongsheng Li. 2021. Fast convergence of detr with spatially modulated co-attention. In Proceedings of the IEEE/CVF International Conference on Computer Vision. 3621–3630.
- Göbel et al. (2012) Max Göbel, Tamir Hassan, Ermelinda Oro, and Giorgio Orsi. 2012. A methodology for evaluating algorithms for table understanding in PDF documents. In Proceedings of the 2012 ACM symposium on Document engineering. 45–48.
- Göbel et al. (2013) Max Göbel, Tamir Hassan, Ermelinda Oro, and Giorgio Orsi. 2013. ICDAR 2013 table competition. In 2013 12th International Conference on Document Analysis and Recognition. IEEE, 1449–1453.
- Hashmi et al. (2021) Khurram Azeem Hashmi, Didier Stricker, Marcus Liwicki, Muhammad Noman Afzal, and Muhammad Zeshan Afzal. 2021. Guided table structure recognition through anchor optimization. IEEE Access 9 (2021), 113521–113534.
- He et al. (2017) Kaiming He, Georgia Gkioxari, Piotr Dollár, and Ross Girshick. 2017. Mask r-cnn. In Proceedings of the IEEE international conference on computer vision. 2961–2969.
- He et al. (2016) Kaiming He, Xiangyu Zhang, Shaoqing Ren, and Jian Sun. 2016. Deep Residual Learning for Image Recognition. In 2016 IEEE Conference on Computer Vision and Pattern Recognition (CVPR). 770–778. https://doi.org/10.1109/CVPR.2016.90
- He et al. (2021) Yelin He, Xianbiao Qi, Jiaquan Ye, Peng Gao, Yihao Chen, Bingcong Li, Xin Tang, and Rong Xiao. 2021. PingAn-VCGroup’s Solution for ICDAR 2021 Competition on Scientific Table Image Recognition to Latex. arXiv preprint arXiv:2105.01846 (2021).
- Itonori (1993) Katsuhiko Itonori. 1993. Table structure recognition based on textblock arrangement and ruled line position. In ICDAR. 765–768.
- Khan et al. (2019) Saqib Ali Khan, Syed Muhammad Daniyal Khalid, Muhammad Ali Shahzad, and Faisal Shafait. 2019. Table structure extraction with bi-directional gated recurrent unit networks. In ICDAR. 1366–1371.
- Kieninger and Dengel (1998) Thomas Kieninger and Andreas Dengel. 1998. The t-recs table recognition and analysis system. In International Workshop on Document Analysis Systems. Springer, 255–270.
- Laurentini and Viada (1992) A Laurentini and P Viada. 1992. Identifying and understanding tabular material in compound documents. In International Conference on Pattern Recognition. IEEE COMPUTER SOCIETY PRESS, 405–405.
- Law and Deng (2018) Hei Law and Jia Deng. 2018. Cornernet: Detecting objects as paired keypoints. In Proceedings of the European conference on computer vision (ECCV). 734–750.
- Li et al. (2022) Feng Li, Hao Zhang, Shilong Liu, Jian Guo, Lionel M Ni, and Lei Zhang. 2022. DN-DETR: Accelerate DETR Training by Introducing Query DeNoising. arXiv preprint arXiv:2203.01305 (2022).
- Li et al. (2020) Minghao Li, Lei Cui, Shaohan Huang, Furu Wei, Ming Zhou, and Zhoujun Li. 2020. Tablebank: Table benchmark for image-based table detection and recognition. In Proceedings of The 12th language resources and evaluation conference. 1918–1925.
- Li et al. (2021b) Xiao-Hui Li, Fei Yin, Xu-Yao Zhang, and Cheng-Lin Liu. 2021b. Adaptive Scaling for Archival Table Structure Recognition. In International Conference on Document Analysis and Recognition. Springer, 80–95.
- Li et al. (2021a) Yiren Li, Zheng Huang, Junchi Yan, Yi Zhou, Fan Ye, and Xianhui Liu. 2021a. GFTE: graph-based financial table extraction. In International Conference on Pattern Recognition. Springer, 644–658.
- Lin et al. (2017a) Tsung-Yi Lin, Piotr Dollár, Ross Girshick, Kaiming He, Bharath Hariharan, and Serge Belongie. 2017a. Feature pyramid networks for object detection. In Proceedings of the IEEE conference on computer vision and pattern recognition. 2117–2125.
- Lin et al. (2017b) Tsung-Yi Lin, Priya Goyal, Ross Girshick, Kaiming He, and Piotr Dollár. 2017b. Focal loss for dense object detection. In Proceedings of the IEEE international conference on computer vision. 2980–2988.
- Liu et al. (2021) Hao Liu, Xin Li, Bing Liu, Deqiang Jiang, Yinsong Liu, Bo Ren, and Rongrong Ji. 2021. Show, Read and Reason: Table Structure Recognition with Flexible Context Aggregator. In Proceedings of the 29th ACM International Conference on Multimedia. 1084–1092.
- Liu et al. (2022) Shilong Liu, Feng Li, Hao Zhang, Xiao Yang, Xianbiao Qi, Hang Su, Jun Zhu, and Lei Zhang. 2022. DAB-DETR: Dynamic anchor boxes are better queries for DETR. arXiv preprint arXiv:2201.12329 (2022).
- Long et al. (2015) Jonathan Long, Evan Shelhamer, and Trevor Darrell. 2015. Fully convolutional networks for semantic segmentation. In Proceedings of the IEEE conference on computer vision and pattern recognition. 3431–3440.
- Long et al. (2021) Rujiao Long, Wen Wang, Nan Xue, Feiyu Gao, Zhibo Yang, Yongpan Wang, and Gui-Song Xia. 2021. Parsing Table Structures in the Wild. In Proceedings of the IEEE/CVF International Conference on Computer Vision. 944–952.
- Loshchilov and Hutter (2017) Ilya Loshchilov and Frank Hutter. 2017. Decoupled weight decay regularization. arXiv preprint arXiv:1711.05101 (2017).
- Ma et al. (2022) Chixiang Ma, Weihong Lin, Lei Sun, and Qiang Huo. 2022. Robust Table Detection and Structure Recognition from Heterogeneous Document Images. arXiv preprint arXiv:2203.09056 (2022).
- Meng et al. (2021) Depu Meng, Xiaokang Chen, Zejia Fan, Gang Zeng, Houqiang Li, Yuhui Yuan, Lei Sun, and Jingdong Wang. 2021. Conditional detr for fast training convergence. In Proceedings of the IEEE/CVF International Conference on Computer Vision. 3651–3660.
- Ng et al. (1999) Hwee Tou Ng, Chung Yong Lim, and Jessica Li Teng Koo. 1999. Learning to recognize tables in free text. In Proceedings of the 37th Annual Meeting of the Association for Computational Linguistics. 443–450.
- Paliwal et al. (2019) Shubham Singh Paliwal, D Vishwanath, Rohit Rahul, Monika Sharma, and Lovekesh Vig. 2019. Tablenet: Deep learning model for end-to-end table detection and tabular data extraction from scanned document images. In 2019 International Conference on Document Analysis and Recognition (ICDAR). IEEE, 128–133.
- Pan et al. (2018) Xingang Pan, Jianping Shi, Ping Luo, Xiaogang Wang, and Xiaoou Tang. 2018. Spatial as deep: Spatial cnn for traffic scene understanding. In Proceedings of the AAAI Conference on Artificial Intelligence.
- Prasad et al. (2020) Devashish Prasad, Ayan Gadpal, Kshitij Kapadni, Manish Visave, and Kavita Sultanpure. 2020. CascadeTabNet: An approach for end to end table detection and structure recognition from image-based documents. In Proceedings of the IEEE/CVF conference on computer vision and pattern recognition workshops. 572–573.
- Qasim et al. (2019) Shah Rukh Qasim, Hassan Mahmood, and Faisal Shafait. 2019. Rethinking table recognition using graph neural networks. In ICDAR. 142–147.
- Qiao et al. (2021) Liang Qiao, Zaisheng Li, Zhanzhan Cheng, Peng Zhang, Shiliang Pu, Yi Niu, Wenqi Ren, Wenming Tan, and Fei Wu. 2021. LGPMA: Complicated Table Structure Recognition with Local and Global Pyramid Mask Alignment. In ICDAR.
- Raja et al. (2020) Sachin Raja, Ajoy Mondal, and CV Jawahar. 2020. Table structure recognition using top-down and bottom-up cues. In European Conference on Computer Vision. 70–86.
- Raja et al. (2022) Sachin Raja, Ajoy Mondal, and CV Jawahar. 2022. Visual Understanding of Complex Table Structures from Document Images. In Proceedings of the IEEE/CVF Winter Conference on Applications of Computer Vision. 2299–2308.
- Rastan et al. (2019) Roya Rastan, Hye-Young Paik, and John Shepherd. 2019. Texus: A unified framework for extracting and understanding tables in pdf documents. Information Processing & Management 56, 3 (2019), 895–918.
- Schreiber et al. (2017) Sebastian Schreiber, Stefan Agne, Ivo Wolf, Andreas Dengel, and Sheraz Ahmed. 2017. Deepdesrt: Deep learning for detection and structure recognition of tables in document images. In ICDAR, Vol. 1. 1162–1167.
- Shigarov et al. (2016) Alexey Shigarov, Andrey Mikhailov, and Andrey Altaev. 2016. Configurable table structure recognition in untagged PDF documents. In Proceedings of the 2016 ACM symposium on document engineering. 119–122.
- Shrivastava et al. (2016) Abhinav Shrivastava, Abhinav Gupta, and Ross Girshick. 2016. Training region-based object detectors with online hard example mining. In Proceedings of the IEEE conference on computer vision and pattern recognition. 761–769.
- Siddiqui et al. (2019a) Shoaib Ahmed Siddiqui, Imran Ali Fateh, Syed Tahseen Raza Rizvi, Andreas Dengel, and Sheraz Ahmed. 2019a. DeepTabStR: deep learning based table structure recognition. In ICDAR. 1403–1409.
- Siddiqui et al. (2019b) Shoaib Ahmed Siddiqui, Pervaiz Iqbal Khan, Andreas Dengel, and Sheraz Ahmed. 2019b. Rethinking semantic segmentation for table structure recognition in documents. In ICDAR. 1397–1402.
- Sun et al. (2021) Zhiqing Sun, Shengcao Cao, Yiming Yang, and Kris M Kitani. 2021. Rethinking transformer-based set prediction for object detection. In Proceedings of the IEEE/CVF International Conference on Computer Vision. 3611–3620.
- Tensmeyer et al. (2019) Chris Tensmeyer, Vlad I. Morariu, Brian Price, Scott Cohen, and Tony Martinez. 2019. Deep Splitting and Merging for Table Structure Decomposition. In 2019 International Conference on Document Analysis and Recognition (ICDAR). 114–121. https://doi.org/10.1109/ICDAR.2019.00027
- Vaswani et al. (2017) Ashish Vaswani, Noam Shazeer, Niki Parmar, Jakob Uszkoreit, Llion Jones, Aidan N Gomez, Łukasz Kaiser, and Illia Polosukhin. 2017. Attention is all you need. Advances in neural information processing systems 30 (2017).
- Wang et al. (2004) Yalin Wang, Ihsin T Phillips, and Robert M Haralick. 2004. Table structure understanding and its performance evaluation. Pattern recognition 37, 7 (2004), 1479–1497.
- Wang et al. (2021) Yingming Wang, Xiangyu Zhang, Tong Yang, and Jian Sun. 2021. Anchor detr: Query design for transformer-based detector. arXiv preprint arXiv:2109.07107 (2021).
- Xue et al. (2019) Wenyuan Xue, Qingyong Li, and Dacheng Tao. 2019. ReS2TIM: Reconstruct syntactic structures from table images. In 2019 International Conference on Document Analysis and Recognition (ICDAR). IEEE, 749–755.
- Xue et al. (2021) Wenyuan Xue, Baosheng Yu, Wen Wang, Dacheng Tao, and Qingyong Li. 2021. TGRNet: A Table Graph Reconstruction Network for Table Structure Recognition. In Proceedings of the IEEE/CVF International Conference on Computer Vision. 1295–1304.
- Yao et al. (2021) Zhuyu Yao, Jiangbo Ai, Boxun Li, and Chi Zhang. 2021. Efficient detr: improving end-to-end object detector with dense prior. arXiv preprint arXiv:2104.01318 (2021).
- Zhang et al. (2017) Ji Zhang, Mohamed Elhoseiny, Scott Cohen, Walter Chang, and Ahmed Elgammal. 2017. Relationship proposal networks. In Proceedings of the IEEE conference on computer vision and pattern recognition. 5678–5686.
- Zhang et al. (2022) Zhenrong Zhang, Jianshu Zhang, Jun Du, and Fengren Wang. 2022. Split, embed and merge: An accurate table structure recognizer. Pattern Recognition (2022), 108565.
- Zheng et al. (2021) Xinyi Zheng, Douglas Burdick, Lucian Popa, Xu Zhong, and Nancy Xin Ru Wang. 2021. Global table extractor (gte): A framework for joint table identification and cell structure recognition using visual context. In Proceedings of the IEEE/CVF winter conference on applications of computer vision. 697–706.
- Zhong et al. (2020) Xu Zhong, Elaheh ShafieiBavani, and Antonio Jimeno Yepes. 2020. Image-based table recognition: data, model, and evaluation. In European Conference on Computer Vision. Springer, 564–580.
- Zhu et al. (2021) Xizhou Zhu, Weijie Su, Lewei Lu, Bin Li, Xiaogang Wang, and Jifeng Dai. 2021. Deformable detr: Deformable transformers for end-to-end object detection. In International Conference on Learning Representations.
- Zou and Ma (2020) Yajun Zou and Jinwen Ma. 2020. A deep semantic segmentation model for image-based table structure recognition. In 2020 15th IEEE International Conference on Signal Processing (ICSP), Vol. 1. IEEE, 274–280.