Block Selection Method for Using Feature Norm in Out-of-distribution Detection
Abstract
Detecting out-of-distribution (OOD) inputs during the inference stage is crucial for deploying neural networks in the real world. Previous methods commonly relied on the output of a network derived from the highly activated feature map. In this study, we first revealed that a norm of the feature map obtained from the other block than the last block can be a better indicator of OOD detection. Motivated by this, we propose a simple framework consisting of FeatureNorm: a norm of the feature map and NormRatio: a ratio of FeatureNorm for ID and OOD to measure the OOD detection performance of each block. In particular, to select the block that provides the largest difference between FeatureNorm of ID and FeatureNorm of OOD, we create Jigsaw puzzle images as pseudo OOD from ID training samples and calculate NormRatio, and the block with the largest value is selected. After the suitable block is selected, OOD detection with the FeatureNorm outperforms other OOD detection methods by reducing FPR95 by up to 52.77% on CIFAR10 benchmark and by up to 48.53% on ImageNet benchmark. We demonstrate that our framework can generalize to various architectures and the importance of block selection, which can improve previous OOD detection methods as well.
1 Introduction
Neural networks have widely been utilized in the real world, such as in autonomous cars[9, 20] and medical diagnoses[39, 7]. In the real world, neural networks often encounter previously unseen input that are different from the training data. If the system fails to recognize those input as unknown input, there can be a dangerous consequence. For example, a medical diagnosis system may recognize an unseen disease image as one of the known diseases. This gives rise to the importance of the out-of-distribution (OOD) detection, which makes users operate a neural network system more safely in the real world.
In practice, various outputs of the network can be used as an indicator to separate the in-distribution (ID) and out-of-distribution (OOD) data. For instance, output probability[14], calibrated output probability[27], and output energy[29] are used as an indicator. The output of a neural network is commonly calculated using a feature vector of the feature extractor and a weight vector of the classification layer. It is known that the norm of the feature vector can be an indicator of input image quality[38, 41, 22] or level of awareness[50]. Thus, we ask the following question: Can we use the norm of the feature as an indicator to separate ID and OOD?
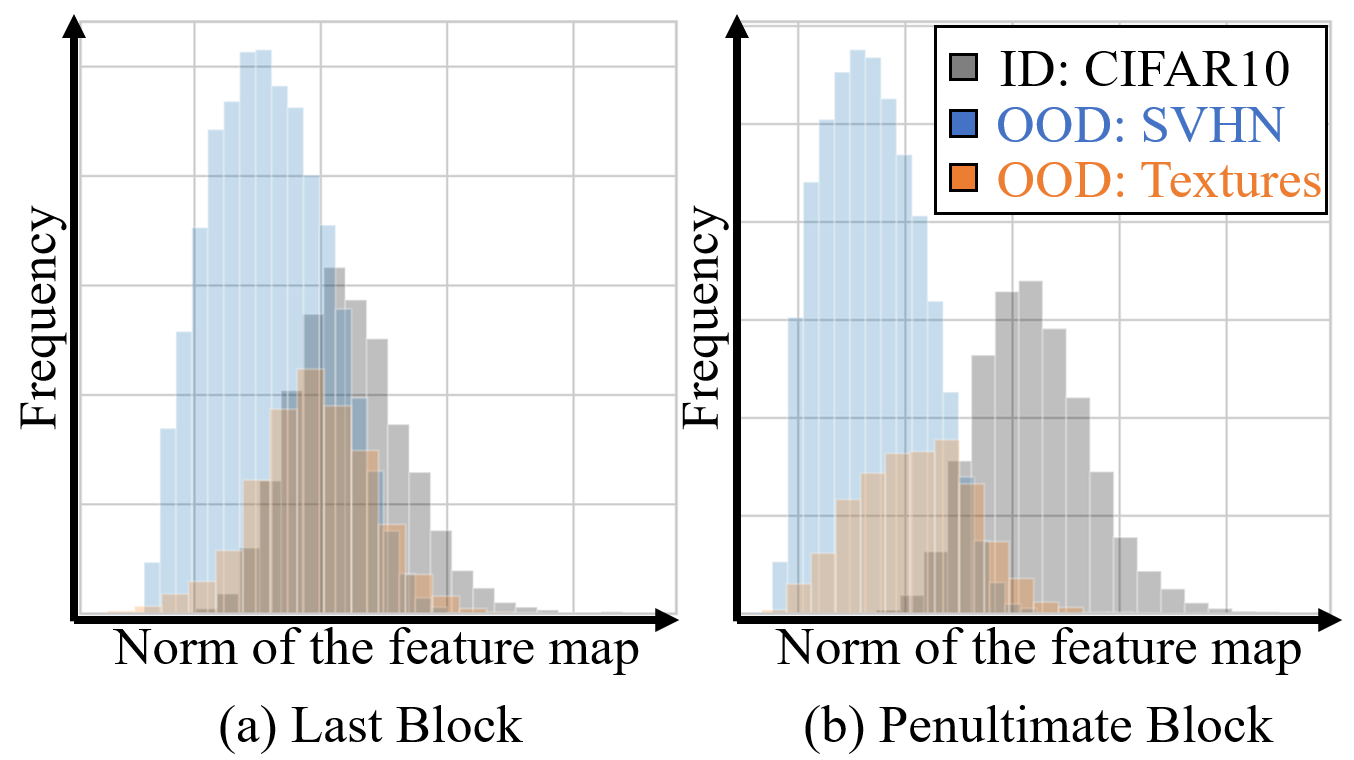
In this paper, we first reveal the key observation concerning the last block of neural networks sometimes deteriorating owing to the overconfidence issue[10, 11]. Empirically, we show that OOD images highly activate filters of the last block (i.e., large norm; see Figure 1, left) on a network trained with CIFAR10 while lowly activate filters of the penultimate block (i.e., small norm; see Figure 1, right). As a result, OOD detection methods that consider overactivated feature[44] and overconfident output[27] have been successful. However, we find that the norm of the feature map for the OOD and ID is quite separable in the penultimate block compared to the last block.
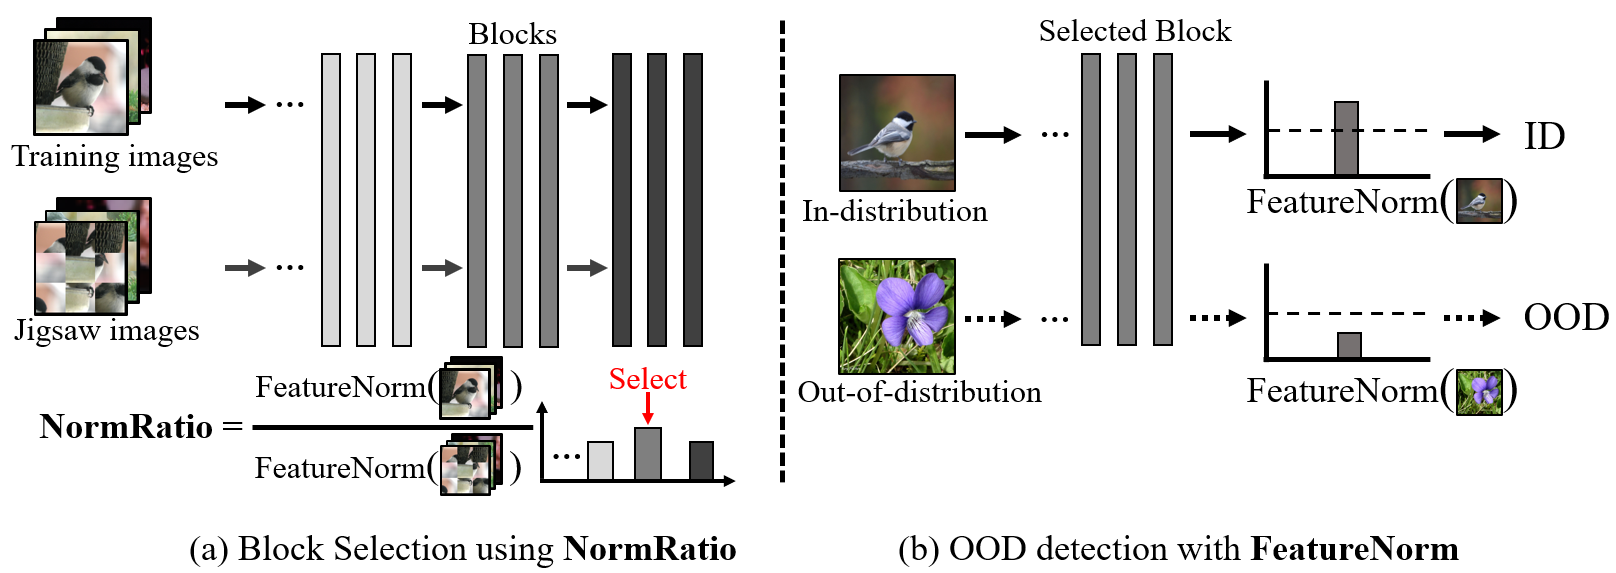
This motivates a simple and effective OOD detection framework consists of (1) FeatureNorm: the norm of the feature map and (2) NormRatio: the ratio of FeatureNorm for ID and OOD. In the case of a suitable block for OOD detection, the FeatureNorm of ID is large, and the FeatureNorm of OOD is small since its filters are trained to be activated on ID[55, 1]. Thus, we use FeatureNorm of the block that has the largest NormRatio as an indicator to separate ID and OOD. Although NormRatio directly represents the OOD detection performance of the block, we cannot access to the OOD before deployment. In order to select the block, that provides the largest difference between FeatureNorm of ID and FeatureNorm of OOD, we create pseudo OOD from ID training samples by generating Jigsaw puzzles[36] and calculate NormRatio with them, and the block with the largest value is selected without accessing OOD. Subsequently, we calculate FeatureNorm of the given test image for OOD detection. The proposed OOD detection framework is shown in Figure 2.
We provide empirical and theoretical analysis of our proposed framework. We conduct experiments on common OOD detection benchmarks and show that our simple framework outperforms previous OOD detection methods. Below, we summarize our key results and contributions:
-
•
We introduce the FeatureNorm, a norm of the feature map, and the NormRatio, a ratio of FeatureNorm for ID and OOD to select a block for OOD detection. To the best of our knowledge, FeatureNorm and NormRatio are the first to explore and demonstrate the norm of the feature map can be an indicator of OOD detection.
-
•
We extensively evaluate our proposed framework on common benchmarks and establish state-of-the-art performances among post-hoc OOD detection methods. Our framework outperforms the best baseline by reducing FPR95 by up to 52.77% on CIFAR10 benchmark and by up to 48.53% on ImageNet benchmark.
-
•
We provide ablation and theoretical analysis that improve understanding of our framework. Our analysis demonstrates an importance of norm from the suitable block, which can improve previous OOD detection methods.
2 Preliminaries
We first describe the general setting of the supervised learning problem for the image classification network. In the general setting, the classification network is trained with cross-entropy loss for the given training dataset , where is the input RGB image and is the corresponding label with class categories. An OOD detection method is considered as post-hoc method if it does not modify anything during the training stage.
Out-of-distribution detection
When deploying a network in the real world, a user can trust the network if the network classify known images correctly and detect the OOD image as ”unknown”. For an OOD detection problem with image classification networks, the given test image is considered as an OOD image when semantically (e.g., object identity) or non-semantically (e.g., camera settings or style of the image) differs from the images of the . The decision of the OOD detection is a binary classification with a scoring function that produce ID-ness for the given image . The main object of the OOD detection research is to find the scoring function that can effectively separate the ID samples and OOD samples.
Elements of convolutional neural networks
Convolutional neural networks (CNNs) usually consist of a feature extractor and a classification layer. A feature extractor encodes an RGB image to a feature map with channel using its block, where and refer to the width and height of each feature map. Also, a classification layer encodes a feature map to a logit vector . There have been various CNN architectures such as AlexNet[24], VGG[43], ResNet[12], and MobileNet[16]. In this paper, we consider a block as a set of a single convolutional layer with an activation function in VGG architecture and a block as a residual block in ResNet and MobileNet.
Note that the output logit and the output probability of a CNN are commonly calculated as follows:
where , , , and denote the -norm, -th element of logit , feature vector, and -th class weight, respectively. Also, refers to the angle between the feature vector and -th class weight vector . Since the output probability distribution is calculated by applying a softmax function on the logit, larger -norm feature and larger -norm class weight produce a harder probability distribution[52]. Because the cross-entropy loss force the network to produce 1.0 probability for all training data, the norm of the feature vector and the norm of class weight are forced to be large.
3 Method
3.1 Overview of OOD detection framework
Our OOD detection framework is based on the idea that the norm of feature map obtained from a suitable block for OOD detection can be a good indicator and the suitable block can be selected with ratio of ID and pseudo OOD which are generated from ID training samples. We illustrate our framework in Figure 2. After the training is done, we select the block by NormRatio for OOD detection (Figure 2; left). Then, we use the norm of the feature map FeatureNorm obtained from the selected feature map for OOD detection during the inference stage (Figure 2; right). Specifically, we first generate the Jigsaw puzzle image as pseudo OOD from ID training samples and calculate NormRatio of training samples and corresponding pseudo OOD. Since the Jigsaw puzzle images has destroyed object information, we argue that these images can be considered as OOD that is semantically shifted. Thus, NormRatio of ID training samples and pseudo OOD (i.e., Jigsaw puzzle images) is suitable for finding the block that produce FeatureNorm that can separate ID and OOD samples during the inference stage. Note that our proposed OOD detection framework does not modify the training stage of the network and once the input image is detected as in-distribution image during the inference stage, we can always obtain original output without having any disadvantage on classification accuracy.
3.2 FeatureNorm: norm of the feature map
We consider FeatureNorm, a norm of the feature map, is an indicator of activation level of the block for the given image. In practice, we consider a pre-trained neural network for -category image classification with a feature extractor and a classification layer. We denote by feature map obtained by the block of the feature extractor. The norm of each channel of feature map is calculated as follows:
| (1) |
where is the -th, -th element of the feature map . This equation can be interpreted as Frobenius norm of the rectified by ReLU function. We utilize a ReLU function to eliminate the effect of negative elements of feature map, which can be seemed as deactivation of filters. Thus, the represents the level of activation of -th channel for the obtained feature map .
Subsequently, the channel-wise averaged norm of the feature map for the block is calculated as follows:
| (2) |
where is the level of activation for the given image and the block . During the inference stage, OOD detection using FeatureNorm with a suitable block can be conducted with a threshold :
| (3) |
where the threshold is typically chosen so that 95% of ID data is correctly classified as ID (i.e., true positive rate of 95%) and the refers to the neural network.
3.3 NormRatio: measure of block’s suitability
We consider the NormRatio, a ratio of ID FeatureNorm and pseudo OOD FeatureNorm, is an indicator of block’s suitability for OOD detection. NormRatio directly represents suitability of the block for OOD detection since the suitable block will produce large ID FeatureNorm and the small OOD FeatureNorm. In practice, the main problem of the NormRatio for selecting a block is that we cannot access the OOD before deployment. Thus, we need to generate the pseudo OOD, that can represent the OOD may seem during the inference stage, to calculate NormRatio. We argue that using the NormRatio for selecting the block with pseudo OOD that can represent the most hard OOD can achieve the best OOD detection results, and since the semantically shifted OOD images are known to be the hardest OOD to detect[17], we generate the 33 Jigsaw puzzle image, which is semantically shifted, as done in [36] using training samples. Our selection algorithm using NormRatio is described as Algorithm 1.
4 Experiments
Setup
We use commonly utilized CNN architectures: ResNet18[12], VGG11[43] and WideResNet[58] with depth 28 and width 10 (WRN28) for the CIFAR10[23] benchmark. The ResNet18 and VGG11 are trained with batch size 128 for 100 epochs with weight decay of 0.0005. The WRN28 is trained with batch size 128 for 200 epochs with weight decay of 0.0005. In all training, the SGD optimizer with momentum 0.9 and initial learning rate of 0.1 is utilized, except VGG11 use initial learning rate of 0.05. The learning rate is decreased by a factor of 10 at 50, 75, 90 training epochs for ResNet18 and VGG11, and at 100, 150 training epochs for WRN28. Also, we use pretrained ResNet50[12], VGG16[43], and MobileNetV3_large[16] (MobileNetV3) architectures provided by Pytorch for ImageNet[4] benchmark. At test time, all images are resize to 3232 for CIFAR10 networks, and to 256256 and center crop to size of 224224 for ImageNet networks. We use SVHN[34], Textures[2], LSUN-crop[56](LSUN(c)), LSUN-resize[56](LSUN(r)), iSUN[53], and Places365[59] as OOD datasets for CIFAR10 benchmark. We use iNaturalist[49], SUN[51], PLACES[59], and Textures[2], which are sampled by Huang et al. [18], as OOD dataset For the ImageNet benchmark.
Evaluation Metrics
We measure the quality of OOD detection using the two most widely adopted metrics in OOD detection researches: which are (1) area under the receiver operating characteristic curve (AUROC; [3, 8]) and (2) false positive rate at 95% true positive rate (FPR95; [27]). AUROC plots the true positive rate of ID data against false positive rate of OOD data by varying a OOD detection threshold. Thus, it can represent the probability that ID samples will have a higher score than OOD samples. FPR95 is a false positive rate at threshold is set to produce 95% true positive rate. Therefore, it can represent OOD detection performance when an application requirement is recall of 95%. In summary, the higher AUROC and the lower FPR95 represent the better quality of the OOD detection method.
Comparison with previous methods
We compare our framework with other post-hoc OOD detection method which calculate OOD score from a model trained on ID data using cross-entropy loss. Although, ODIN[27] requires validation set of ID and OOD for hyperparameter setting, we set these hyperparameters without OOD data as in [17] for fair comparison without access to OOD. As a result, we compare our method with Maximum Softmax Probability (MSP; [14]), ODIN[27], Energy[29], Energy+ReAct[44], and Energy+DICE[45].
| ID | Architecture | Selected Block Name | Output Size | Depth |
|---|---|---|---|---|
| CIFAR10 | ResNet18 | Block 4.1 | 512 4 4 | N-1 |
| WRN28 | Block 3.3 | 640 8 8 | N-1 | |
| VGG11 | Layer 7 | 512 4 4 | N-2 | |
| ImageNet | ResNet50 | Block 4.2 | 2048 7 7 | N-1 |
| VGG16 | Layer 13 | 512 14 14 | N | |
| MobileNetV3 | Block 17 | 960 7 7 | N |
Block selection for OOD detection using NormRatio
we evaluate OOD detection performance of proposed FeatureNorm with the block selection using NormRatio of ID and pseudo OOD. Pseudo OOD are 33 Jigsaw puzzle images that generated from each ID training sample. Once the training of the network is done, we calculate the NormRatio for every block using Algorithm 1. Since the various architectures are used for the experiments, we summarize results of block selection in Table 1. We find that our method choose the block for each architecture consistently. For instance, the Block 4.1, Block 3.3 and Layer 7 are selected for ResNet18, WRN28 and VGG11 in all five trials.
| OOD | |||||||||||||||
| SVHN | Textures | LSUN© | LSUN® | iSUN | Places365 | Average | |||||||||
| Architecture | Method | FPR95↓ | AUROC↑ | FPR95↓ | AUROC↑ | FPR95↓ | AUROC↑ | FPR95↓ | AUROC↑ | FPR95↓ | AUROC↑ | FPR95↓ | AUROC↑ | FPR95↓ | AUROC↑ |
| MSP[14] | 52.12 | 92.20 | 59.47 | 89.56 | 32.83 | 95.62 | 48.35 | 93.07 | 50.30 | 92.58 | 60.70 | 88.42 | 50.63 | 91.91 | |
| ODIN[27] | 33.83 | 93.03 | 45.49 | 90.01 | 7.29 | 98.62 | 20.05 | 96.56 | 23.09 | 96.01 | 45.06 | 89.86 | 29.14 | 94.02 | |
| Energy[29] | 30.47 | 94.05 | 45.83 | 90.37 | 7.21 | 98.63 | 23.62 | 95.93 | 27.14 | 95.34 | 43.67 | 90.29 | 29.66 | 94.10 | |
| Energy+ReAct[44] | 40.54 | 90.54 | 48.61 | 88.44 | 15.12 | 96.86 | 27.01 | 94.74 | 30.57 | 93.95 | 44.99 | 89.37 | 34.47 | 92.32 | |
| Energy+DICE[45] | 25.95 | 94.66 | 47.22 | 89.82 | 3.83 | 99.26 | 27.70 | 95.01 | 31.07 | 94.42 | 49.28 | 88.08 | 30.84 | 93.54 | |
| ResNet18 | FeatureNorm (ours) | 7.13 | 98.65 | 31.18 | 92.31 | 0.07 | 99.96 | 27.08 | 95.25 | 26.02 | 95.38 | 62.54 | 84.62 | 25.67 | 94.36 |
| MSP[14] | 42.10 | 91.85 | 53.30 | 87.45 | 24.85 | 96.37 | 37.81 | 93.71 | 40.11 | 93.05 | 50.73 | 88.58 | 41.49 | 91.84 | |
| ODIN[27] | 37.08 | 88.36 | 47.58 | 82.85 | 6.14 | 98.65 | 20.51 | 95.04 | 22.95 | 94.22 | 41.03 | 86.57 | 29.22 | 90.95 | |
| Energy[29] | 33.11 | 90.54 | 46.06 | 85.09 | 5.86 | 98.76 | 22.68 | 94.90 | 25.12 | 94.17 | 39.08 | 88.50 | 28.65 | 91.99 | |
| Energy+ReAct[44] | 98.31 | 39.94 | 91.85 | 60.80 | 96.76 | 57.11 | 77.63 | 80.15 | 79.48 | 78.67 | 73.29 | 77.98 | 86.22 | 65.78 | |
| Energy+DICE[45] | 37.84 | 86.99 | 50.77 | 79.70 | 2.54 | 99.43 | 26.30 | 92.89 | 28.30 | 92.14 | 43.46 | 84.65 | 31.53 | 89.30 | |
| WRN28 | FeatureNorm (ours) | 3.83 | 99.18 | 14.23 | 97.06 | 0.32 | 99.81 | 8.13 | 98.32 | 5.98 | 98.71 | 48.69 | 90.91 | 13.53 | 97.33 |
| MSP[14] | 68.07 | 90.02 | 63.86 | 89.37 | 46.63 | 93.73 | 70.19 | 86.29 | 71.81 | 85.71 | 68.08 | 87.25 | 64.77 | 88.73 | |
| ODIN[27] | 53.84 | 92.23 | 48.09 | 91.94 | 19.95 | 97.01 | 54.29 | 89.47 | 56.61 | 88.87 | 52.34 | 89.86 | 47.52 | 91.56 | |
| Energy[29] | 53.13 | 92.26 | 47.04 | 92.08 | 18.51 | 97.20 | 53.02 | 89.58 | 55.39 | 88.97 | 51.67 | 89.95 | 46.46 | 91.67 | |
| Energy+ReAct[44] | 58.81 | 83.28 | 51.73 | 87.47 | 23.40 | 94.77 | 47.19 | 89.68 | 51.30 | 88.07 | 50.47 | 87.39 | 47.15 | 88.44 | |
| Energy+DICE[45] | 47.81 | 93.27 | 50.95 | 91.77 | 16.73 | 97.06 | 64.26 | 87.83 | 65.83 | 87.43 | 59.23 | 88.53 | 50.80 | 90.98 | |
| VGG11 | FeatureNorm (ours) | 8.84 | 98.24 | 24.62 | 95.11 | 3.38 | 99.36 | 71.17 | 83.12 | 62.80 | 86.05 | 65.25 | 85.20 | 39.34 | 91.18 |
5 Results
5.1 Result on CIFAR10 benchmark
In Table 2, we report the performance of OOD detection for ResNet18, WRN28, and VGG11 architectures using various post-hoc detection methods. The performance are calculated using FPR95 and AUROC on six OOD datasets. Our proposed method achieved the best average performance on both ResNet18 and WRN28, and best FPR95 on VGG11. Note that our method reduces the average FPR95 by 13.45%, 52.77%, and 15.33% compared to the second best results on ResNet18, WRN28, and VGG11, respectively.
As shown in Table 2, our method consistently outperforms other method on three OOD datasets: SVHN, Textures and LSUN(c). Also, we find that our method is weaker to LSUN(r), iSUN, and Places365. We argue that our method is stronger to detect images from SVHN, Textures and LSUN(c) since its image has low complexity compare to CIFAR10[28] and activation of the image cumulatively differs from the early stage of the network to later stage (see 6.2). In contrast, LSUN(r) and iSUN have large complexity[28], which makes its activation large on the shallow layer and to be detected more easily when using a deeper architecture (i.e., WRN28). Finally, Places365 has similar complexity as CIFAR10[28] which can be interpreted as images from Places365 have similar low-level abstraction information and semantically shifted compared to ID (i.e., semantically shifted OOD[17]).
5.2 Result on ImageNet benchmark
| OOD | |||||||||||
| iNaturalist | SUN | PLACES | Textures | Average | |||||||
| Architecture | Method | FPR95↓ | AUROC↑ | FPR95↓ | AUROC↑ | FPR95↓ | AUROC↑ | FPR95↓ | AUROC↑ | FPR95↓ | AUROC↑ |
| MSP†[14] | 54.99 | 87.74 | 70.83 | 80.86 | 73.99 | 79.76 | 68.00 | 79.61 | 66.95 | 81.99 | |
| ODIN†[27] | 47.66 | 89.66 | 60.15 | 84.59 | 67.89 | 81.78 | 50.23 | 85.62 | 56.48 | 85.41 | |
| Energy†[29] | 55.72 | 89.95 | 59.26 | 85.89 | 64.92 | 82.86 | 53.72 | 85.99 | 58.41 | 86.17 | |
| Energy+ReAct†[44] | 20.38 | 96.22 | 24.20 | 94.20 | 33.85 | 91.58 | 47.30 | 89.80 | 31.43 | 92.95 | |
| Energy+DICE†[45] | 25.63 | 94.49 | 35.15 | 90.83 | 46.49 | 87.48 | 31.72 | 90.30 | 34.75 | 90.78 | |
| ResNet50 | FeatureNorm (Ours) | 22.01 | 95.76 | 42.93 | 90.21 | 56.80 | 84.99 | 20.07 | 95.39 | 35.45 | 91.59 |
| MSP[14] | 56.72 | 87.26 | 75.66 | 78.31 | 77.89 | 77.60 | 64.84 | 81.66 | 68.78 | 81.21 | |
| ODIN[27] | 42.66 | 92.13 | 61.31 | 86.51 | 67.33 | 83.87 | 44.57 | 89.82 | 53.97 | 88.08 | |
| Energy[29] | 44.60 | 91.77 | 59.34 | 86.82 | 66.27 | 83.95 | 43.90 | 89.94 | 53.53 | 88.12 | |
| Energy+ReAct[44] | 99.94 | 34.50 | 99.87 | 35.01 | 99.25 | 37.54 | 96.45 | 49.12 | 98.88 | 39.04 | |
| Energy+DICE[45] | 49.70 | 90.03 | 58.42 | 86.71 | 68.97 | 83.04 | 38.95 | 90.66 | 54.01 | 87.61 | |
| VGG16 | FeatureNorm (Ours) | 16.78 | 96.69 | 28.09 | 94.37 | 41.78 | 90.21 | 23.53 | 95.05 | 27.55 | 94.08 |
| MSP[14] | 56.04 | 87.31 | 74.19 | 79.08 | 77.03 | 78.23 | 65.00 | 81.64 | 68.07 | 81.57 | |
| ODIN[27] | 39.93 | 93.10 | 55.22 | 87.87 | 64.11 | 85.09 | 38.28 | 91.24 | 49.39 | 89.33 | |
| Energy[29] | 54.04 | 91.15 | 68.13 | 85.89 | 69.37 | 83.91 | 54.91 | 88.88 | 61.61 | 87.46 | |
| Energy+ReAct[44] | 40.98 | 91.17 | 59.82 | 84.80 | 63.07 | 81.53 | 58.78 | 85.17 | 55.66 | 85.67 | |
| Energy+DICE[45] | 60.94 | 84.72 | 63.4 | 82.7 | 75.88 | 77.88 | 42.98 | 87.36 | 60.80 | 83.17 | |
| MobileNetV3 | FeatureNorm (Ours) | 33.10 | 92.71 | 42.41 | 88.60 | 58.46 | 81.79 | 8.60 | 98.26 | 35.64 | 90.34 |
In Table 3, we report the performance of OOD detection for ResNet50, VGG16, and MobileNetV3 architectures. The performance are calculated using FPR95 and AUROC on four datasets. Our proposed method achieved the best averaged performance on VGG16 and MobileNetV3 architectures. Note that our method reduces the FPR95 on ImageNet benchmark by 48.53% and 27.84% compared to the second best results when using VGG16 and MobileNetV3 architectures. In contrast, we find that our method does not effective on ResNet50 architecture compared to the other methods. We argue that the block structure with batch normalization layer of ResNet reduced the separation gap between ID and OOD samples (see 6.4).
Note that our method consistently outperforms other methods on detecting Textures dataset. We argue that images of Textures are far-OOD[54] and have a lot of low-level complexity images compared to the other OOD dataset, and the activation cumulatively differs from the early stage of the network to later stage (see 6.2). Also, iNaturalist usually have higher complexity images compared to ImageNet. As a result, deep networks can detect the iNaturalist as OOD unlike VGG11 and ResNet18 on CIFAR10 benchmark. Finally, SUN and PLACES have similar complexity level compared to ImageNet, which means that OOD images is semantically shifted and hard to be detected[17].
6 Discussion
6.1 Effect of NormRatio
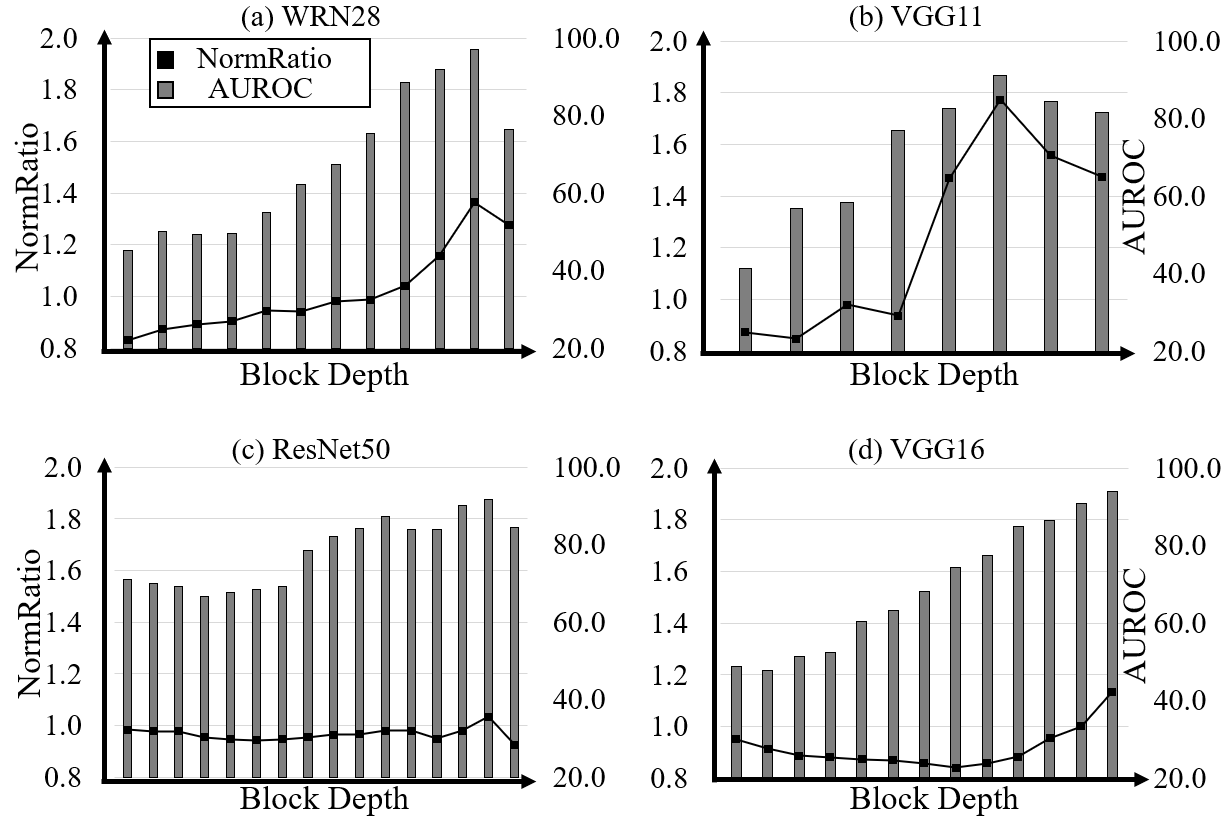
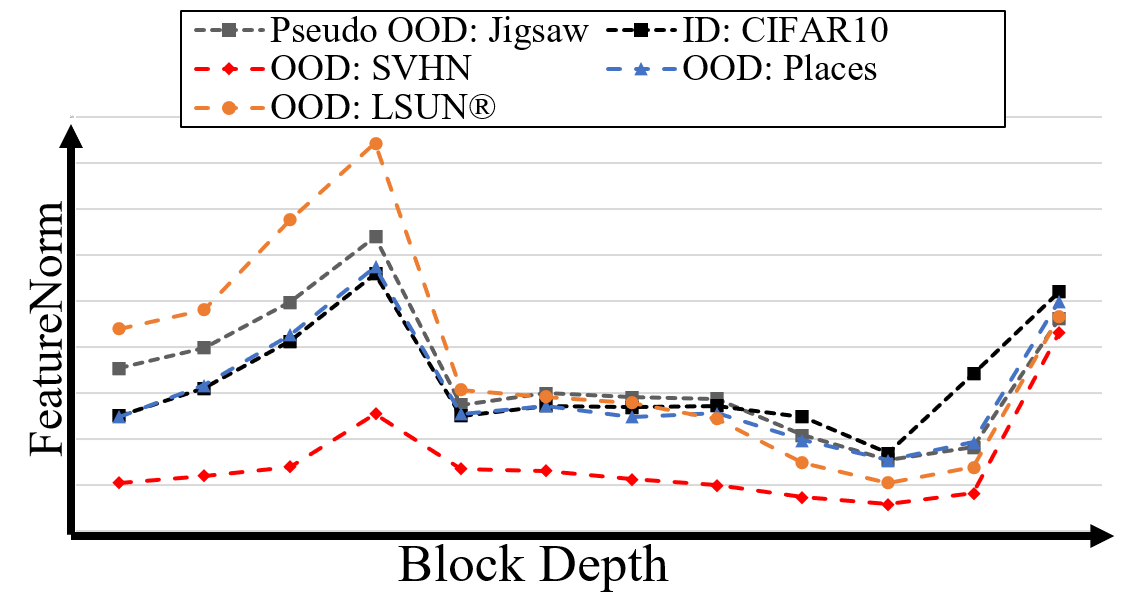
We calculate the NormRatio using the ID training samples and the pseudo OOD, which is a jigsaw puzzle generated from the ID image, to select the suitable block for OOD detection. Our insight is that the block that has the largest NormRatio is the suitable for detecting pseudo OOD (i.e., jigsaw puzzle) and the other OOD can be seen during the inference stage as well. To find out that the NormRatio can represent the OOD detection performance of the block, we calculate the NormRatio and OOD detection performance for each block. In Figure 3, we show that the best OOD detection performance can be achieved by the block that produce the largest NormRatio. Also, in Figure 4, we show that FeatureNorm for the given ID (black), pseudo OOD (gray) and various OOD (SVHN: red, Places: blue, LSUN(r): orange). We see that the FeatureNorm of pseudo OOD (gray) acts as the FeatureNorm of OOD images that has enough low-level abstraction (blue, orange).
6.2 Effect of FeatureNorm
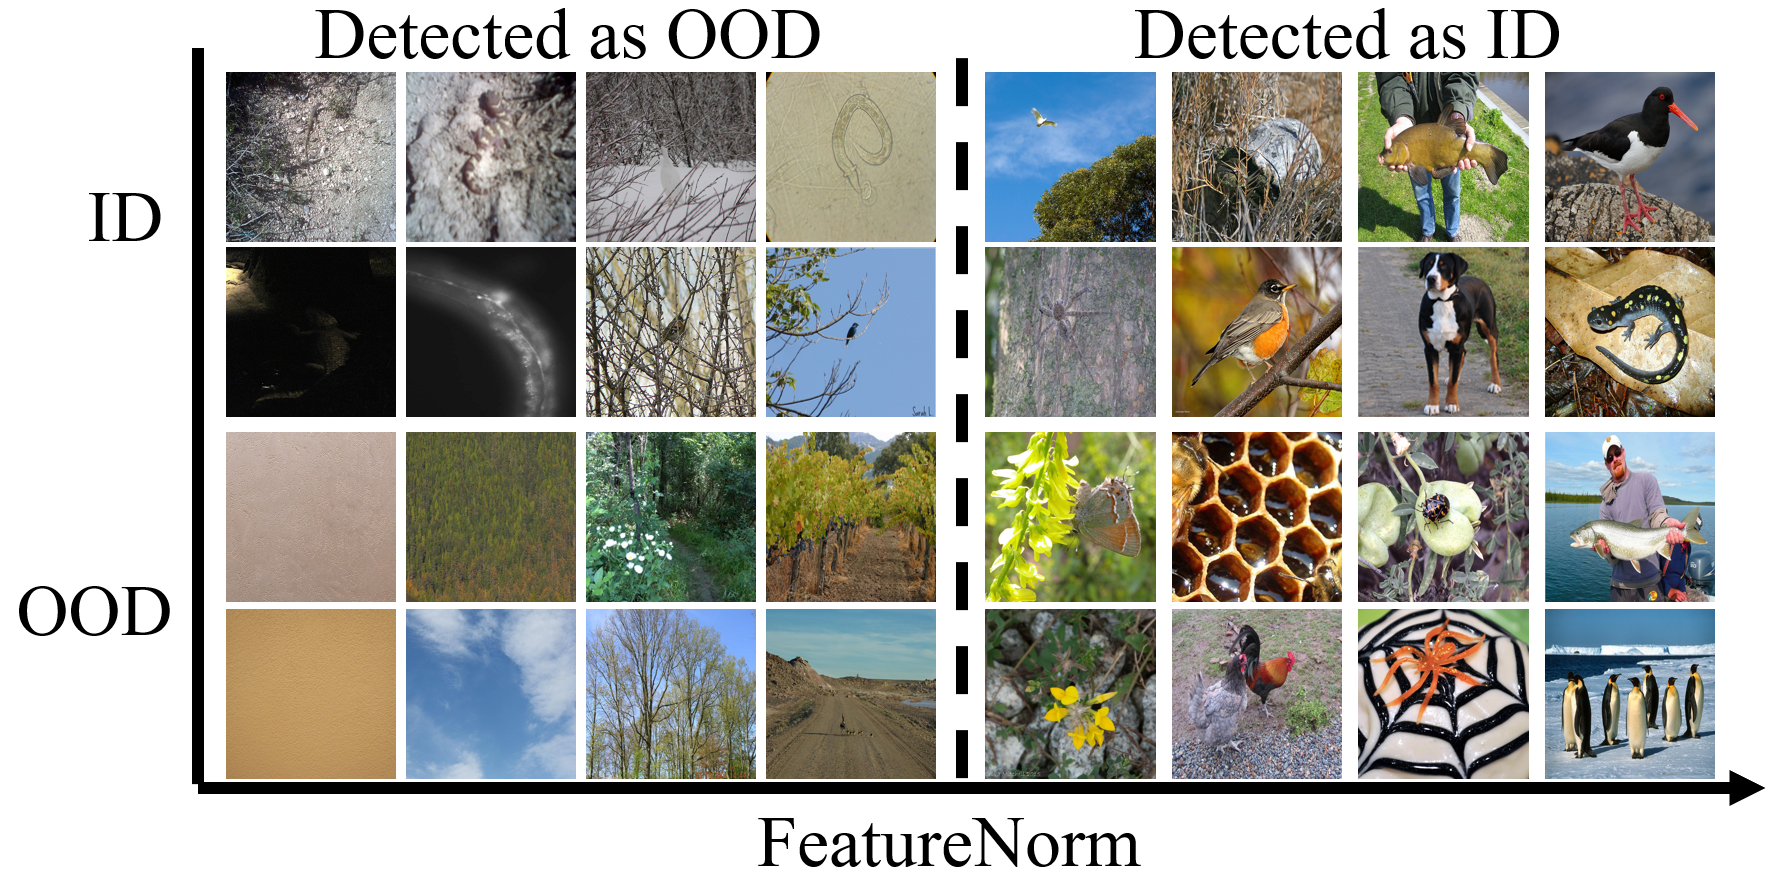
To demonstrate the effectiveness of FeatureNorm as an indicator for OOD detection, we show the change of FeatureNorm of various input through blocks in Figure 4. In Figure 4, we demonstrate that norm of the OOD images with low-complexity (SVHN) is low consistently on all blocks except the last one. On the other way, FeatureNorm of the OOD images with high complexity (LSUN(r)) is higher than ID in shallow blocks since the shallow block of network act as edge detector[1, 55] and the high level complexity image tends to have large low-level abstraction. Also, high complexity images obtain large FeatureNorm in shallow blocks, the FeatureNorm is reduced since it cannot activate deeper blocks that act as high-level abstraction detector. We argue that network like VGG11 or ResNet18 is hard to separate ID and OOD with high-level complexity since it has a few deep blocks compared to WRN28. As a result, the low quality ID image obtains low FeatureNorm and the high quality ID image or OOD image with high-level semantic information obtains high FeatureNorm as shown in Figure 5.
6.3 Output calibration using the selected block
The output of the network is deteriorated when the last block of the network produces a high norm for both ID and OOD, and we argue that the network output can be calibrated by replacing the norm of the last block with the norm of the selected block. We evaluate the OOD detection method on ResNet18, WRN28, and VGG11, which are suffered by overconfident last block, with and without replacing. In the Table 4, we show that the existing OOD detection methods that utilize the output of the network can be improved by selecting a suitable norm for the OOD detection. This suggests that the current network is underperforming in OOD detection by the overconfident last block, and can be calibrated by the block selection.
| Architecture | Method | w/o the selected norm | w/ the selected norm | ||
|---|---|---|---|---|---|
| FPR95↓ | AUROC↑ | FPR95↓ | AUROC↑ | ||
| ResNet18 | MSP | 50.63 | 91.91 | 35.56 | 94.66 |
| ODIN | 29.14 | 94.02 | 15.99 | 97.03 | |
| Energy | 29.66 | 94.10 | 17.59 | 96.69 | |
| WRN28 | MSP | 41.49 | 91.84 | 38.38 | 93.59 |
| ODIN | 29.22 | 90.95 | 23.71 | 94.75 | |
| Energy | 28.65 | 91.99 | 24.01 | 94.87 | |
| VGG11 | MSP | 64.77 | 88.73 | 56.57 | 90.55 |
| ODIN | 47.52 | 91.56 | 35.62 | 93.50 | |
| Energy | 46.46 | 91.67 | 35.42 | 93.58 | |
6.4 Structure of the block cause the overconfidence
Despite the effect of FeatureNorm and NormRatio for OOD detection, our method cannot achieve the best results on Resnet18 and ResNet50 architectures, and we argue that the structure of the residual block is the reason for it. In particular, we demonstrate that the position of the Batch Normalization (BN) layer[19] can cause the large OOD FeatureNorm in Table 5. Note that the order of the layer in block of ResNet[12] is Conv-BN-ReLU, but BN-ReLU-Conv in WRN[58] for faster training and better accuracy. There have been reports that the BN layer cause the overconfidence[10] and overactivation[44] since it calculate the output by standardizing the input elements with moving average and moving variance of ID, and the absolute value of output elements becomes large. Then, the element-wise addition between input and BN output of the residual block (i.e., , where is a block operation for given input feature map ) will make FeatureNorm of the output feature map larger, especially for high-complexity images that produce higher norm that is not rectified by ReLU. However, with the block that has order of BN-ReLU-Conv produce lower OOD FeatureNorm since the filters of the convolutional layer will be lowly activated for OOD inputs; as a result, FeatureNorm of the output feature map is smaller for the given OOD. Thus, we argue that the block order is an important aspect for the OOD detection. In Table 5, we show that the ResNet18 with block order of BN-ReLU-Conv outperforms the ResNet18 with block order of Conv-BN-ReLU.
| Conv-BN-ReLU | BN-ReLU-Conv | |||
|---|---|---|---|---|
| OOD | FPR95↓ | AUROC↑ | FPR95↓ | AUROC↑ |
| SVHN | 7.13 | 98.65 | 6.92 | 98.68 |
| Textures | 31.18 | 92.31 | 36.89 | 91.91 |
| LSUN(c) | 0.07 | 99.96 | 0.50 | 99.82 |
| LSUN(r) | 27.08 | 95.25 | 17.93 | 96.97 |
| iSUN | 26.02 | 95.38 | 14.62 | 97.39 |
| Places365 | 62.54 | 84.62 | 49.30 | 90.76 |
| Average | 25.67 | 94.36 | 21.03 | 95.92 |
7 Related Work
7.1 Out-of-distribution detection
To detect OOD samples during the inference stage with pre-trained network using cross-entropy loss, Hendrycks et al. [14] proposed maximum softmax probability (MSP), based on their observation that the classifier tends to have lower confidence for the OOD sample than for the ID sample. Similarly, the ODIN[27], which is an enhanced version of the MSP, applies two strategies, namely input preprocessing and temperature scaling, to separate the confidence of ID samples and the one of OOD samples, which leads to improved OOD detection performance. In the other hand, Lee et al. [26] proposed to use Mahalanobis distance between prototype feature vector, build with training data, and feature vector for the given input sample to detect OOD sample. Also, Liu et al. [29] proposed to use energy function for OOD detection. Recently, Sun et al. [44] proposed a simple technique that clips activation of the produced feature based on the observation that OOD features have few outsized activations. Also, Sunet al. [45] proposed a weight selection method to select important weight of the overparameterized network, and it can separate energy score between ID and OOD. The above methods can be utilized with any off-the-shelf network. Despite the convenience that it can use by any trained network, its improvement of OOD detection performance is limited. Our method also belongs to the category of post-hoc methods, and we compare our method with other post-hoc methods in this paper.
The other branch of OOD detection aims to train the network for improving its OOD detection performance. For example, Hendrycks et al.[15] proposed the outlier exposure, which trains the network to have low confidence in outlier data examples, and found that it results in the network calibrated better and enhance OOD detection performance. Also, Papadopoulos et al.[37] improved outlier exposure with confidence control to improve the calibration of the network. Macêdo et al.[30] proposed a novel loss to replace the cross-entropy loss to follow the maximum entropy principle[47]. The above works with outlier exposure can improve the OOD detection performance by a large margin, but its drawback is that it requires an outlier dataset, which can be hard to require in practice. There have been works that utilize self-supervised learning to improve performance. For instance, Tack et al. [46] proposed a novelty detection method based on representation knowledge of the model, which is learned by contrastive learning of visual representations. Also, Sehwang et al. [42] proposed to use the Mahalanobis distance based detection using the model trained with self-supervised learning method. Recently, However, the main drawback of these methods is that it cannot use with a pre-trained network, and it may reduce the classification accuracy. In this paper, we did not compare performance with these methods since our method is a post-hoc method.
7.2 Calibration of neural networks
We prefer a well-calibrated network for deploying the neural network in the real world since a calibrated network will produce low confidence for the given unseen input. However, there has been a report the deep neural network, especially modern architecture, is poorly calibrated[10] due to the overfitting and Batch Normalization. The calibration methods can be categorized into post-hoc methods, which utilize the recalibration function for pre-trained model, and pre-hoc methods, which utilize extra training procedure. The very basic way to improve model calibration using recalibration method is temperature scaling of logit[10]. Also, Gupta et al. [11] proposed to utilize a recalibration function based on splines, which maps the logit to calibrated class probabilities. These methods are performed using a held-out calibration set to calculate hyperparameter of the calibration method. Calibration methods with training procedure use data augmentation [48, 57] or modify training loss[25, 33, 21]. These calibration methods may be helpful for OOD detection researches since the well-calibrated network should produce low probability for OOD.
7.3 Feature of neural networks
It is known that the norm of the feature vector will be lower for unseen images since the feature extractor is forced to produce higher norm in the training stage[50]. Also, there have been reports that the norm of the feature vectors represented the quality of the input image in the face recognition[41, 40, 22], and the norm of the feature vectors for unknown samples is often lower than those of known[5, 50]. However, it is also known that the network can be easily fooled by unrecognizable images[35, 32, 13] or adversarial attack[31, 6] which means that the filter of the network can be activated by unseen image. Also, the feature vector, which is directly used for calculating logit by dot product, is forced to be large during its training stage by cross-entropy loss[52]. Since our work utilizes the norm of the feature map, we believe that our framework can be improved by considering aforementioned works.
8 Conclusion
We propose a simple OOD detection framework that consists of two operations: (1) FeatureNorm, which is a norm of feature map from the block, and (2) NormRatio, which is a ratio of FeatureNorm for given ID and OOD images. We demonstrate that the suitable block for OOD detection can be selected without access to OOD by choosing the block that produce the largest NormRatio with ID and pseudo OOD that is generated from ID, and using FeatureNorm of suitable block for OOD detection outperforms existing approaches. We provide empirical and theoretical analysis to help understand our framework. Extensive experiments show our framework can improve other existing methods as well. We hope our research can help to solve the overconfidence issue of neural networks.
Acknowledgement
This work was partially supported by the ICT R&D program of MSIT/IITP[2020-0-00857, Development of Cloud Robot Intelligence Augmentation, Sharing and Framework Technology to Integrate and Enhance the Intelligence of Multiple Robots] and by Institute of Information & communications Technology Planning & Evaluation (IITP) grant funded by the Korea government (MSIT) (No. 2022-0-00951, Development of Uncertainty-Aware Agents Learning by Asking Questions).
References
- [1] Saad Albawi, Tareq Abed Mohammed, and Saad Al-Zawi. Understanding of a convolutional neural network. In 2017 international conference on engineering and technology (ICET), pages 1–6. Ieee, 2017.
- [2] M. Cimpoi, S. Maji, I. Kokkinos, S. Mohamed, , and A. Vedaldi. Describing textures in the wild. In Proceedings of the IEEE Conf. on Computer Vision and Pattern Recognition (CVPR), 2014.
- [3] Jesse Davis and Mark Goadrich. The relationship between precision-recall and roc curves. In Proceedings of the 23rd international conference on Machine learning, pages 233–240, 2006.
- [4] J. Deng, W. Dong, R. Socher, L.-J. Li, K. Li, and L. Fei-Fei. ImageNet: A Large-Scale Hierarchical Image Database. In CVPR09, 2009.
- [5] Akshay Raj Dhamija, Manuel Günther, and Terrance Boult. Reducing network agnostophobia. Advances in Neural Information Processing Systems, 31, 2018.
- [6] Yinpeng Dong, Fangzhou Liao, Tianyu Pang, Hang Su, Jun Zhu, Xiaolin Hu, and Jianguo Li. Boosting adversarial attacks with momentum. In Proceedings of the IEEE conference on computer vision and pattern recognition, pages 9185–9193, 2018.
- [7] Andre Esteva, Katherine Chou, Serena Yeung, Nikhil Naik, Ali Madani, Ali Mottaghi, Yun Liu, Eric Topol, Jeff Dean, and Richard Socher. Deep learning-enabled medical computer vision. NPJ digital medicine, 4(1):1–9, 2021.
- [8] Tom Fawcett. An introduction to roc analysis. Pattern recognition letters, 27(8):861–874, 2006.
- [9] Angelos Filos, Panagiotis Tigkas, Rowan Mcallister, Nicholas Rhinehart, Sergey Levine, and Yarin Gal. Can autonomous vehicles identify, recover from, and adapt to distribution shifts? In Hal Daumé III and Aarti Singh, editors, Proceedings of the 37th International Conference on Machine Learning, volume 119 of Proceedings of Machine Learning Research, pages 3145–3153. PMLR, 13–18 Jul 2020.
- [10] Chuan Guo, Geoff Pleiss, Yu Sun, and Kilian Q Weinberger. On calibration of modern neural networks. In International Conference on Machine Learning, pages 1321–1330. PMLR, 2017.
- [11] Kartik Gupta, Amir Rahimi, Thalaiyasingam Ajanthan, Thomas Mensink, Cristian Sminchisescu, and Richard Hartley. Calibration of neural networks using splines. In International Conference on Learning Representations, 2021.
- [12] Kaiming He, Xiangyu Zhang, Shaoqing Ren, and Jian Sun. Deep residual learning for image recognition. In Proceedings of the IEEE conference on computer vision and pattern recognition, pages 770–778, 2016.
- [13] Matthias Hein, Maksym Andriushchenko, and Julian Bitterwolf. Why relu networks yield high-confidence predictions far away from the training data and how to mitigate the problem. In Proceedings of the IEEE/CVF Conference on Computer Vision and Pattern Recognition, pages 41–50, 2019.
- [14] Dan Hendrycks and Kevin Gimpel. A baseline for detecting misclassified and out-of-distribution examples in neural networks. In Proceedings of International Conference on Learning Representations, 2017.
- [15] Dan Hendrycks, Mantas Mazeika, and Thomas Dietterich. Deep anomaly detection with outlier exposure. In International Conference on Learning Representations, 2019.
- [16] Andrew Howard, Mark Sandler, Grace Chu, Liang-Chieh Chen, Bo Chen, Mingxing Tan, Weijun Wang, Yukun Zhu, Ruoming Pang, Vijay Vasudevan, et al. Searching for mobilenetv3. In Proceedings of the IEEE/CVF international conference on computer vision, pages 1314–1324, 2019.
- [17] Yen-Chang Hsu, Yilin Shen, Hongxia Jin, and Zsolt Kira. Generalized odin: Detecting out-of-distribution image without learning from out-of-distribution data. In Proceedings of the IEEE/CVF Conference on Computer Vision and Pattern Recognition, pages 10951–10960, 2020.
- [18] Rui Huang and Yixuan Li. Mos: Towards scaling out-of-distribution detection for large semantic space. In Proceedings of the IEEE/CVF Conference on Computer Vision and Pattern Recognition, 2021.
- [19] Sergey Ioffe and Christian Szegedy. Batch normalization: Accelerating deep network training by reducing internal covariate shift. In International conference on machine learning, pages 448–456. PMLR, 2015.
- [20] Joel Janai, Fatma Güney, Aseem Behl, Andreas Geiger, et al. Computer vision for autonomous vehicles: Problems, datasets and state of the art. Foundations and Trends® in Computer Graphics and Vision, 12(1–3):1–308, 2020.
- [21] Archit Karandikar, Nicholas Cain, Dustin Tran, Balaji Lakshminarayanan, Jonathon Shlens, Michael C Mozer, and Becca Roelofs. Soft calibration objectives for neural networks. Advances in Neural Information Processing Systems, 34:29768–29779, 2021.
- [22] Minchul Kim, Anil K Jain, and Xiaoming Liu. Adaface: Quality adaptive margin for face recognition. In Proceedings of the IEEE/CVF Conference on Computer Vision and Pattern Recognition, 2022.
- [23] Alex Krizhevsky, Geoffrey Hinton, et al. Learning multiple layers of features from tiny images. 2009.
- [24] Alex Krizhevsky, Ilya Sutskever, and Geoffrey E Hinton. Imagenet classification with deep convolutional neural networks. Communications of the ACM, 60(6):84–90, 2017.
- [25] Aviral Kumar, Sunita Sarawagi, and Ujjwal Jain. Trainable calibration measures for neural networks from kernel mean embeddings. In International Conference on Machine Learning, pages 2805–2814. PMLR, 2018.
- [26] Kimin Lee, Kibok Lee, Honglak Lee, and Jinwoo Shin. A simple unified framework for detecting out-of-distribution samples and adversarial attacks. Advances in neural information processing systems, 31, 2018.
- [27] Shiyu Liang, Yixuan Li, and R Srikant. Enhancing the reliability of out-of-distribution image detection in neural networks. In 6th International Conference on Learning Representations, ICLR 2018, 2018.
- [28] Ziqian Lin, Sreya Dutta Roy, and Yixuan Li. Mood: Multi-level out-of-distribution detection. In Proceedings of the IEEE/CVF Conference on Computer Vision and Pattern Recognition, pages 15313–15323, 2021.
- [29] Weitang Liu, Xiaoyun Wang, John Owens, and Yixuan Li. Energy-based out-of-distribution detection. Advances in Neural Information Processing Systems, 2020.
- [30] David Macêdo, Tsang Ing Ren, Cleber Zanchettin, Adriano L. I. Oliveira, and Teresa Ludermir. Entropic out-of-distribution detection: Seamless detection of unknown examples. IEEE Transactions on Neural Networks and Learning Systems, pages 1–15, 2021.
- [31] Aleksander Madry, Aleksandar Makelov, Ludwig Schmidt, Dimitris Tsipras, and Adrian Vladu. Towards deep learning models resistant to adversarial attacks. arXiv preprint arXiv:1706.06083, 2017.
- [32] Seyed-Mohsen Moosavi-Dezfooli, Alhussein Fawzi, and Pascal Frossard. Deepfool: a simple and accurate method to fool deep neural networks. In Proceedings of the IEEE conference on computer vision and pattern recognition, pages 2574–2582, 2016.
- [33] Jishnu Mukhoti, Viveka Kulharia, Amartya Sanyal, Stuart Golodetz, Philip Torr, and Puneet Dokania. Calibrating deep neural networks using focal loss. Advances in Neural Information Processing Systems, 33:15288–15299, 2020.
- [34] Yuval Netzer, Tao Wang, Adam Coates, Alessandro Bissacco, Bo Wu, and Andrew Y Ng. Reading digits in natural images with unsupervised feature learning. 2011.
- [35] Anh Nguyen, Jason Yosinski, and Jeff Clune. Deep neural networks are easily fooled: High confidence predictions for unrecognizable images. In Proceedings of the IEEE conference on computer vision and pattern recognition, pages 427–436, 2015.
- [36] Mehdi Noroozi and Paolo Favaro. Unsupervised learning of visual representations by solving jigsaw puzzles. In European conference on computer vision, pages 69–84. Springer, 2016.
- [37] Aristotelis-Angelos Papadopoulos, Mohammad Reza Rajati, Nazim Shaikh, and Jiamian Wang. Outlier exposure with confidence control for out-of-distribution detection. Neurocomputing, 441:138–150, 2021.
- [38] Connor J. Parde, Carlos Domingo Castillo, Matthew Q. Hill, Y. Ivette Colón, Swami Sankaranarayanan, Jun-Cheng Chen, and Alice J. O’Toole. Deep convolutional neural network features and the original image. ArXiv, abs/1611.01751, 2016.
- [39] Eduardo HP Pooch, Pedro Ballester, and Rodrigo C Barros. Can we trust deep learning based diagnosis? the impact of domain shift in chest radiograph classification. In International Workshop on Thoracic Image Analysis, pages 74–83. Springer, 2020.
- [40] Zhuwei Qin, Fuxun Yu, Chenchen Liu, and Xiang Chen. How convolutional neural networks see the world—a survey of convolutional neural network visualization methods. Mathematical Foundations of Computing, 1(2):149, 2018.
- [41] Rajeev Ranjan, Carlos D Castillo, and Rama Chellappa. L2-constrained softmax loss for discriminative face verification. arXiv preprint arXiv:1703.09507, 2017.
- [42] Vikash Sehwag, Mung Chiang, and Prateek Mittal. Ssd: A unified framework for self-supervised outlier detection. In International Conference on Learning Representations, 2021.
- [43] Karen Simonyan and Andrew Zisserman. Very deep convolutional networks for large-scale image recognition. arXiv preprint arXiv:1409.1556, 2014.
- [44] Yiyou Sun, Chuan Guo, and Yixuan Li. React: Out-of-distribution detection with rectified activations. In Advances in Neural Information Processing Systems, 2021.
- [45] Yiyou Sun and Yixuan Li. Dice: Leveraging sparsification for out-of-distribution detection. In European Conference on Computer Vision, 2022.
- [46] Jihoon Tack, Sangwoo Mo, Jongheon Jeong, and Jinwoo Shin. Csi: Novelty detection via contrastive learning on distributionally shifted instances. In Advances in Neural Information Processing Systems, 2020.
- [47] MTCAJ Thomas and A Thomas Joy. Elements of information theory. Wiley-Interscience, 2006.
- [48] Sunil Thulasidasan, Gopinath Chennupati, Jeff A Bilmes, Tanmoy Bhattacharya, and Sarah Michalak. On mixup training: Improved calibration and predictive uncertainty for deep neural networks. Advances in Neural Information Processing Systems, 32, 2019.
- [49] Grant Van Horn, Oisin Mac Aodha, Yang Song, Yin Cui, Chen Sun, Alex Shepard, Hartwig Adam, Pietro Perona, and Serge Belongie. The inaturalist species classification and detection dataset, 2017.
- [50] Sagar Vaze, Kai Han, Andrea Vedaldi, and Andrew Zisserman. Open-set recognition: A good closed-set classifier is all you need. In International Conference on Learning Representations, 2022.
- [51] Jianxiong Xiao, James Hays, Krista A. Ehinger, Aude Oliva, and Antonio Torralba. Sun database: Large-scale scene recognition from abbey to zoo. In 2010 IEEE Computer Society Conference on Computer Vision and Pattern Recognition, pages 3485–3492, 2010.
- [52] Kunran Xu, Lai Rui, Yishi Li, and Lin Gu. Feature normalized knowledge distillation for image classification. In Computer Vision–ECCV 2020: 16th European Conference, Glasgow, UK, August 23–28, 2020, Proceedings, Part XXV 16, pages 664–680. Springer, 2020.
- [53] Pingmei Xu, Krista A Ehinger, Yinda Zhang, Adam Finkelstein, Sanjeev R. Kulkarni, and Jianxiong Xiao. Turkergaze: Crowdsourcing saliency with webcam based eye tracking, 2015.
- [54] Jingkang Yang, Pengyun Wang, Dejian Zou, Zitang Zhou, Kunyuan Ding, Wenxuan Peng, Haoqi Wang, Guangyao Chen, Bo Li, Yiyou Sun, Xuefeng Du, Kaiyang Zhou, Wayne Zhang, Dan Hendrycks, Yixuan Li, and Ziwei Liu. Openood: Benchmarking generalized out-of-distribution detection. 2022.
- [55] Jason Yosinski, Jeff Clune, Anh Nguyen, Thomas Fuchs, and Hod Lipson. Understanding neural networks through deep visualization. arXiv preprint arXiv:1506.06579, 2015.
- [56] Fisher Yu, Yinda Zhang, Shuran Song, Ari Seff, and Jianxiong Xiao. Lsun: Construction of a large-scale image dataset using deep learning with humans in the loop. arXiv preprint arXiv:1506.03365, 2015.
- [57] Sangdoo Yun, Dongyoon Han, Seong Joon Oh, Sanghyuk Chun, Junsuk Choe, and Youngjoon Yoo. Cutmix: Regularization strategy to train strong classifiers with localizable features. In Proceedings of the IEEE/CVF international conference on computer vision, pages 6023–6032, 2019.
- [58] Sergey Zagoruyko and Nikos Komodakis. Wide residual networks. In Edwin R. Hancock Richard C. Wilson and William A. P. Smith, editors, Proceedings of the British Machine Vision Conference (BMVC), pages 87.1–87.12. BMVA Press, September 2016.
- [59] Bolei Zhou, Agata Lapedriza, Aditya Khosla, Aude Oliva, and Antonio Torralba. Places: A 10 million image database for scene recognition. IEEE Transactions on Pattern Analysis and Machine Intelligence, 40(6):1452–1464, 2018.