GraphCare: Enhancing Healthcare Predictions with Personalized Knowledge Graphs
Abstract
Clinical predictive models often rely on patients’ electronic health records (EHR), but integrating medical knowledge to enhance predictions and decision-making is challenging. This is because personalized predictions require personalized knowledge graphs (KGs), which are difficult to generate from patient EHR data. To address this, we propose GraphCare, a framework that uses external KGs to improve EHR-based predictions. Our method extracts knowledge from large language models (LLMs) and external biomedical KGs to build patient-specific KGs, which are then used to train our proposed Bi-attention AugmenTed (BAT) graph neural network (GNN) for healthcare predictions. On two public datasets, MIMIC-III and MIMIC-IV, GraphCare surpasses baselines in four vital healthcare prediction tasks: mortality, readmission, length of stay (LOS), and drug recommendation. On MIMIC-III, it boosts AUROC by 17.6% and 6.6% for mortality and readmission, and F1-score by 7.9% and 10.8% for LOS and drug recommendation, respectively. Notably, GraphCare demonstrates a substantial edge in scenarios with limited data. Our findings highlight the potential of using external KGs in healthcare prediction tasks and demonstrate the promise of GraphCare in generating personalized KGs for promoting personalized medicine.
1 Introduction
The digitization of healthcare systems has led to the accumulation of vast amounts of electronic health record (EHR) data that encode valuable information about patients, treatments, etc. Machine learning models have been developed on these data and demonstrated huge potential for enhancing patient care and resource allocation via predictive tasks, including mortality prediction (Blom et al., 2019; Courtright et al., 2019), length-of-stay (LOS) estimation (Cai et al., 2015; Levin et al., 2021), readmission prediction (Ashfaq et al., 2019; Xiao et al., 2018), and drug recommendations (Bhoi et al., 2021; Shang et al., 2019b).
To improve predictive performance and integrate expert knowledge with data insights, clinical knowledge graphs (KGs) were adopted to complement EHR modeling (Chen et al., 2019; Choi et al., 2020; Rotmensch et al., 2017). These KGs represent medical concepts (e.g., diagnoses, procedures, drugs) and their relationships, enabling effective learning of patterns and dependencies. However, existing approaches mainly focus on simple hierarchical relations (Choi et al., 2017; 2018; 2020) rather than leveraging comprehensive relationships among biomedical entities despite incorporating valuable contextual information from established biomedical knowledge bases (e.g., UMLS (Bodenreider, 2004)) could enhance predictions. Moreover, large language models (LLMs) such as GPT (Brown et al., 2020; Chowdhery et al., 2022; Luo et al., 2022; OpenAI, 2023) pre-trained on web-scale biomedical literature could serve as alternative resources for extracting clinical knowledge given their remarkable reasoning abilities on open-world data. There is a substantial body of existing research demonstrating their potential use as knowledge bases (Lv et al., 2022; Petroni et al., 2019; AlKhamissi et al., 2022).
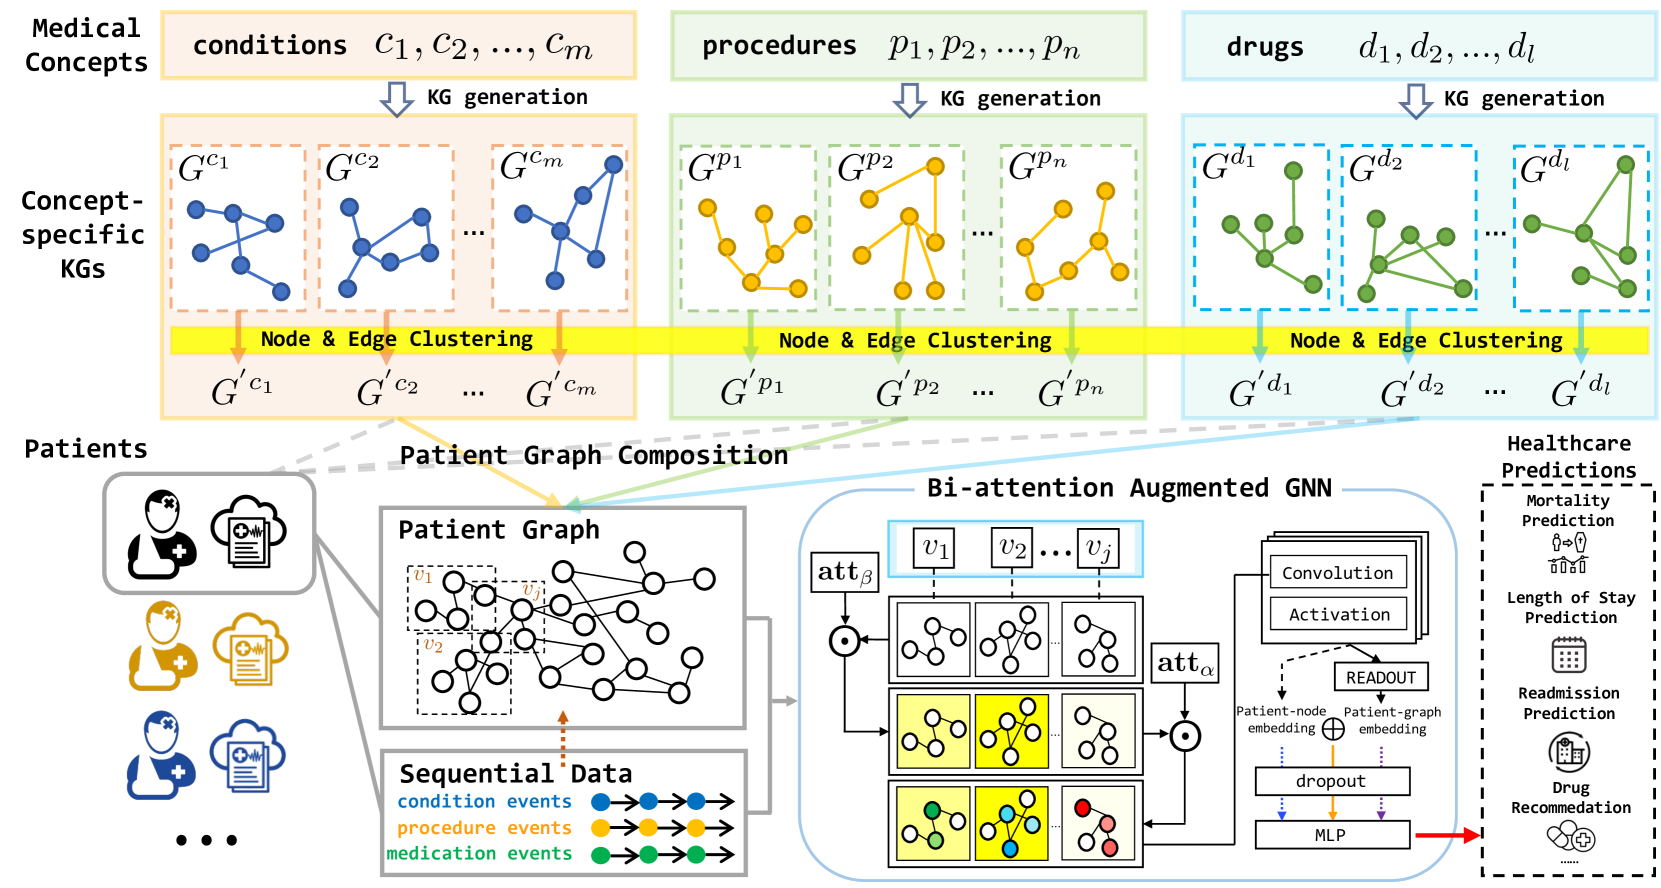
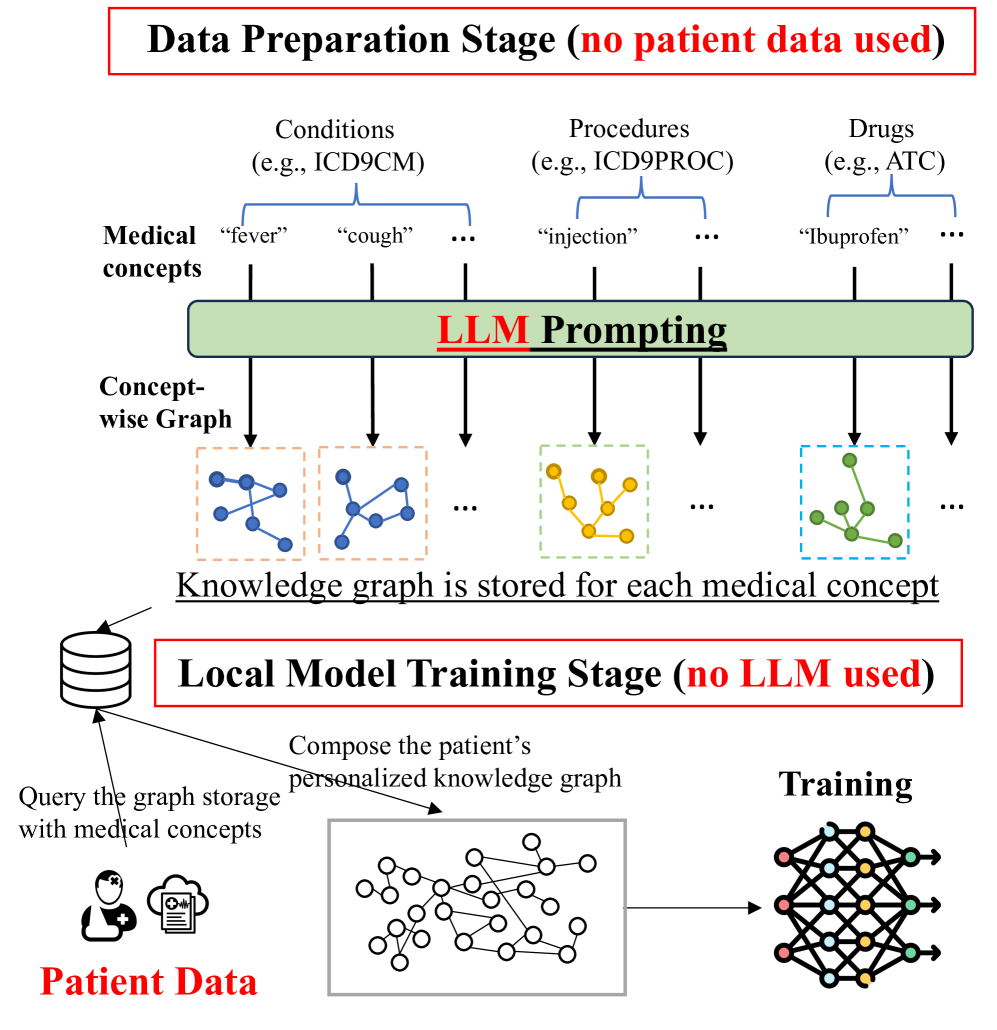
To fill the gap in personalized medical KGs, we propose to leverage the exceptional reasoning abilities of LLMs to extract and integrate personalized KG from open-world data. Our proposed method GraphCare (Personalized Graph-based HealthCare Prediction) is a framework designed to generate patient-specific KGs by effectively harnessing the wealth of clinical knowledge. As shown in Figure 1, our patient KG generation module first takes medical concepts as input and generates concept-specific KGs by prompting LLMs or retrieving subgraphs from existing graphs. It then clusters nodes and edges to create a more aggregated KG for each medical concept. Next, it constructs a personalized KG for each patient by merging their associated concept-specific KGs and incorporating temporal information from their sequential visit data. These patient-specific graphs are then fed into our Bi-attention AugmenTed (BAT) graph neural network (GNN) for diverse downstream prediction tasks.
We evaluated the effectiveness of GraphCare using two widely-used EHR datasets, MIMIC-III (Johnson et al., 2016) and MIMIC-IV (Johnson et al., 2020). Through extensive experimentation, we found that GraphCare outperforms several baselines, while BAT outperforms state-of-the-art GNN models (Veličković et al., 2017; Hu et al., 2019; Rampášek et al., 2022) on four common healthcare prediction tasks: mortality prediction, readmission prediction, LOS prediction, and drug recommendation. Our experimental results demonstrate that GraphCare, equipped with the BAT, achieves average AUROC improvements of 17.6%, 6.6%, 4.1%, 2.1% and 7.9%, 3.8%, 3.5%, 1.8% over all baselines on MIMIC-III and MIMIC-IV, respectively. Furthermore, our approach requires significantly fewer patient records to achieve comparable results, providing compelling evidence for the benefits of integrating open-world knowledge into healthcare predictions.
2 Related Works
Clinical Predictive Models. EHR data has become increasingly recognized as a valuable resource in the medical domain, with numerous predictive tasks utilizing this data (Ashfaq et al., 2019; Bhoi et al., 2021; Blom et al., 2019; Cai et al., 2015). A multitude of deep learning models have been designed to cater to this specific type of data, leveraging its rich, structured nature to achieve enhanced performance (Shickel et al., 2017; Miotto et al., 2016; Choi et al., 2016c; a; b; Shang et al., 2019b; Yang et al., 2021a; Choi et al., 2020; Zhang et al., 2020; Ma et al., 2020b; a; Gao et al., 2020; Yang et al., 2023b). Among these models, some employ a graph structure to improve prediction accuracy, effectively capturing underlying relationships among medical entities (Choi et al., 2020; Su et al., 2020; Zhu & Razavian, 2021; Li et al., 2020; Xie et al., 2019; Lu et al., 2021a; Yang et al., 2023b; Shang et al., 2019b). However, a limitation of these existing works is that they do not link the local graph to an external knowledge base, which contains a large amount of valuable relational information (Lau-Min et al., 2021; Pan & Cimino, 2014). We propose to create a customized knowledge graph for each medical concept in an open-world setting by probing relational knowledge from either LLMs or KGs, enhancing its predictive capabilities for healthcare.
Personalized Knowledge Graphs. Personalized KGs have emerged as promising tools for improving healthcare prediction (Ping et al., 2017; Gyrard et al., 2018; Shirai et al., 2021; Rastogi & Zaki, 2020; Li et al., 2022). Previous approaches such as GRAM (Choi et al., 2017) and its successors (Ma et al., 2018; Shang et al., 2019a; Yin et al., 2019; Panigutti et al., 2020; Lu et al., 2021b) incorporated hierarchical graphs to improve predictions of deep learning-based models; however, they primarily focus on simple parent-child relationships, overlooking the rich complexities found in large knowledge bases. MedML (Gao et al., 2022) employs graph data for COVID-19 related prediction. However, the KG in this work has a limited scope and relies heavily on curated features. To bridge these gaps, we introduce two methods for creating detailed, personalized KGs using open sources. The first solution is prompting (Liu et al., 2023) LLMs to generate KGs tailored to medical concepts. This approach is inspired by previous research (Yao et al., 2019; Wang et al., 2020a; Chen et al., 2022; Lovelace & Rose, 2022; Chen et al., 2023; Jiang et al., 2023), showing that pre-trained LMs can function as comprehensive knowledge bases. The second method involves subgraph sampling from established KGs (Bodenreider, 2004), enhancing the diversity of the knowledge base.
Attention-augmented GNNs. Attention mechanisms (Bahdanau et al., 2014) have been widely utilized in GNNs to capture the most relevant information from the graph structure for various tasks (Veličković et al., 2017; Lee et al., 2018; Zhang et al., 2018; Wang et al., 2020b; Zhang et al., 2021a; Knyazev et al., 2019). The incorporation of attention mechanisms in GNNs allows for enhanced graph representation learning, which is particularly useful in the context of EHR data analysis (Choi et al., 2020; Lu et al., 2021b). In GraphCare, we introduce a new GNN BAT leveraging both visit-level and node-level attention, edge weights, and attention initialization for EHR-based predictions with personalized KGs.
3 Personalized Graph-based HealthCare Prediction
In this section, we present GraphCare, a comprehensive framework designed to generate personalized KGs and utilize them for healthcare predictions. It operates through three general steps:
Step 1: Generate concept-specific KGs for every medical concept using LLM prompts and by subsampling from existing KGs. Perform clustering on nodes and edges across these KGs.
Step 2: For each patient, merge relevant concept-specific KGs to form a personalized KG.
Step 3: Employ the novel Bi-attention Augmented (BAT) Graph Neural Network (GNN) to predict based on the personalized KGs.
3.1 Step 1: Concept-Specific Knowledge Graph Generation.
Denote a medical concept as , where , , and correspond to sets of medical concepts for conditions, procedures, and drugs, with sizes of , , and , respectively. The goal of this step is to generate a KG for each medical concept , where represents nodes, and denotes edges in the graph.
Our approach comprises two strategies: (1) LLM-based KG extraction via prompting: Utilizing a template with instruction, example, and prompt. For example, with an instruction “Given a prompt, extrapolate as many relationships as possible of it and provide a list of updates”, an example “prompt: systemic lupus erythematosus. updates: [systemic lupus erythematosus is, treated with, steroids]…” and a prompt “prompt: tuberculosis. updates:”, the LLM would respond with a list of KG triples such as “[tuberculosis, may be treated with, antibiotics], [tuberculosis, affects, lungs]…” where each triple contains a head entity, a relation, and a tail entity. Our curated prompts are detailed in Appendix D.1. After running times, we aggregate111To address ethical concerns with LLM use, we collaborate with medical professionals to evaluate the extracted KG triples, which minimizes the risk of including any inaccurate or potentially misleading information. and parse the outputs to form a KG for each medical concept, . (2) Subgraph sampling from existing KGs: Leveraging pre-existing biomedical KGs (Belleau et al., 2008; Bodenreider, 2004; Donnelly et al., 2006), we extract specific graphs for a concept via subgraph sampling. This involves choosing relevant nodes and edges from the primary KG. For this method, we first pinpoint the entity in the biomedical KG corresponding to the concept . We then sample a -hop subgraph originated from the entity, resulting in . We detail the sampling process in Appendix D.2. Consequently, for each medical concept, the KG is represented as .
Node and Edge Clustering. Next, we perform clustering of nodes and edges based on their similarity, to refine the concept-specific KGs. The similarity is computed using the cosine similarity between their word embeddings. We apply the agglomerative clustering algorithm (Müllner, 2011) on the cosine similarity with a distance threshold , to group similar nodes and edges in the global graph of all concepts. After the clustering process, we obtain and which map the nodes and edges in the original graph to new nodes and edges , respectively. With these two mappings, we obtain a new global graph , and we create a new graph for each concept. The node embedding and the edge embedding are initialized by the averaged word embedding in each cluster, where denotes the dimension of the word embedding.
3.2 Step 2: Personalized Knowledge Graph Composition
For each patient, we compose their personalized KG by merging the clustered KGs of their medical concepts. We create a patient node () and connect it to its direct EHR nodes in the graph. The personalized KG for a patient can be represented as , where and , with being the medical concepts directly associated with the patient, being the number of concepts, and being the edge connecting and . Further, as a patient is represented as a sequence of visits (Choi et al., 2016a), the visit-subgraphs for patient can be represented as for visits where and for . We introduce for the interconnectedness across these visit-subgraphs, defined as: . This set includes edges that connect nodes and from different visit-subgraphs and respectively, provided that there exists an edge in the global graph . The final representation of the patient’s personalized KG, , integrating both the visit-specific data and the broader inter-visit connections, is given as: .
3.3 Step 3: Bi-attention AugmenTed Graph Neural Network
Given that each patient’s data encompasses multiple visit-subgraphs, it becomes imperative to devise a specialized model capable of managing this temporal graph data. Graph Neural Networks (GNNs), known for their proficiency in this domain, can be generalized as:
| (1) |
where represents the updated node representation of node at the -th layer of the GNN. The function aggregates the node representations of all neighbors of node at the -th layer. and are the learnable weight matrix and bias vector at the -th layer, respectively. denotes an activation function. Nonetheless, the conventional GNN approach overlooks the temporal characteristics of our patient-specific graphs and misses the intricacies of personalized healthcare. To address this, we propose a Bi-attention Augmented (BAT) GNN that better accommodates temporal graph data and offers more nuanced predictive healthcare insights.
Our model. In GraphCare, we incorporate attention mechanisms to effectively capture relevant information from the personalized KG. We first reduce the size of node and edge embedding from the word embedding to the hidden embedding to improve model’s efficiency. The dimension-reduced hidden embeddings are computed as follows:
| (2) |
where , are learnable vectors, are input embedding, are hidden embedding of the -th node in -th visit-subgraph of patient, and the hidden embedding of the edge between the nodes and , respectively. is the size of the hidden embedding.
Subsequently, we compute two sets of attention weights: one set corresponds to the subgraph associated with each visit, and the other pertains to the nodes within each subgraph. The node-level attention weight for the -th node in the -th visit-subgraph of patient , denoted as , and the visit-level attention weight for the -th visit of patient , denoted as , are shown as follows:
| (3) |
where is a multi-hot vector representation of visit-subgraph , indicating the nodes appeared for the -th visit of patient where is the number of nodes in the global graph . represents the multi-hot matrix of patient ’s graph where is the maximum visits across all patients. , , and are learnable parameters. is the decay coefficient vector, is the number of visits of patient , where when and otherwise, is coefficient for the visit , with decay rate , initializing higher weights for more recent visits.
Attention initialization. To further incorporate prior knowledge from LLMs and help the model converge, we initialize for the node-level attention based on the cosine similarity between the node embedding and the word embedding of a specific term for the a prediction task-feature pair (e.g., “terminal condition” for mortality-condition. We provide more details on this in Appendix C). Formally, we first calculate the weights for the nodes in the global graph by where is the input embedding of the -th node in , and is the weight computed. We normalize the weights s.t. . We initialize as a diagonal matrix.
Next, we update the node embedding by aggregating the neighboring nodes across all visit-subgraphs incorporating the attention weights for visits and nodes computed in Eq (3.3) and the weights for edges. Based on Eq (1), we design our convolutional layer BAT as follows:
| (4) |
where is the ReLU function, are learnable parameters, is the edge weight vector at the layer , and is the scalar weight for the edge embedding . In Eq (4), the node aggregation term captures the contribution of the attention-weighted nodes, while the edge aggregation term represents the influence of the edges connecting the nodes. This convolutional layer integrates both node and edge features, allowing the model to learn a rich representation of the patient’s EHR data. After several layers of convolution, we obtain the node embeddings of the final layer (), which are used for the predictions:
| (5) |
where is the number of visits of patient , is the number of nodes in visit , denotes the patient graph embedding obtained by averaging the embeddings of all nodes across visit-subgraphs and the various nodes within each subgraph for patient . represents the patient node embedding computed by averaging node embeddings of the direct medical concept linked to the patient node. is a binary label indicating whether a node corresponds to a direct medical concept for patient . Finally, we apply a multilayer perception (MLP) to either , , or the concatenated embedding to obtain logits , or respectively. We discuss more details of the patient representation learning in Appendix E.
3.4 Training and Prediction
The model can be adapted for a variety of healthcare prediction tasks. Consider a set of samples for each patient with visits, where each tuple represents a sample consisting of a sequence of consecutive visits.
Mortality (MT.) prediction predicts the mortality label of the subsequent visit for each sample, with the last sample dropped. Formally, where is a binary label indicating the patient’s survival status recorded in visit .
Readmission (RA.) prediction predicts if the patient will be readmitted into hospital within days. Formally, where denotes the encounter time of visit . equals 1 if , and 0 otherwise. In our study, we set days.
Length-Of-Stay (LOS) prediction (Harutyunyan et al., 2019) predicts the length of ICU stays for each visit. Formally, where is a one-hot vector indicating its class among classes. We set 10 classes , which signify the stays of length day , within one week , one to two weeks (), and two weeks ().
Drug recommendation predicts medication labels for each visit. Formally, where is a multi-hot vector where denotes the number of all drug types.
We use binary cross-entropy (BCE) loss with sigmoid function to train binary (MT. and RA.) and multi-label classification (Drug.) classification tasks, while we use corss-entropy (CE) loss with softmax function to train multi-class (LOS) classification tasks.
4 Experiments
4.1 Experimental Setting
Data. For the EHR data, we use the publicly available MIMIC-III (Johnson et al., 2016) and MIMIC-IV (Johnson et al., 2020) datasets. Table 1 presents statistics of the processed datasets. To build concept-specific KG (§3.1), we utilize GPT-4 (OpenAI, 2023) as the LLM for KG generation, and utilize UMLS-KG (Bodenreider, 2004) as an existing biomedical KG for subgraph sampling, which has 300K entities and 1M relations. and are set as parameters. We employ the GPT-3 embedding model to retrieve the word embeddings of the entities and relations.
| #patients | #visits | #visits/patient | #conditions/patient | #procedures/patient | #drugs/patient | |
|---|---|---|---|---|---|---|
| MIMIC-III | 35,707 | 44,399 | 1.24 | 12.89 | 4.54 | 33.71 |
| MIMIC-IV | 123,488 | 232,263 | 1.88 | 21.74 | 4.70 | 43.89 |
| Task 1: Mortality Prediction | Task 2: Readmission Prediction | ||||||||
| Model | MIMIC-III | MIMIC-IV | MIMIC-III | MIMIC-IV | |||||
| AUPRC | AUROC | AUPRC | AUROC | AUPRC | AUROC | AUPRC | AUROC | ||
| GRU | |||||||||
| Transformer | |||||||||
| RETAIN | |||||||||
| GRAM | |||||||||
| Deepr | |||||||||
| AdaCare | |||||||||
| GRASP | |||||||||
| StageNet | |||||||||
| GraphCare | w/ GAT | ||||||||
| w/ GINE | |||||||||
| w/ EGT | |||||||||
| w/ GPS | |||||||||
| w/ BAT | |||||||||
| Task 3: Length of Stay Prediction | |||||||||
| Model | MIMIC-III | MIMIC-IV | |||||||
| AUROC | Kappa | Accuracy | F1-score | AUROC | Kappa | Accuracy | F1-score | ||
| GRU | |||||||||
| Transformer | |||||||||
| RETAIN | |||||||||
| GRAM | |||||||||
| Deepr | |||||||||
| StageNet | |||||||||
| GraphCare | w/ GAT | ||||||||
| w/ GINE | |||||||||
| w/ EGT | |||||||||
| w/ GPS | |||||||||
| w/ BAT | |||||||||
| Task 4: Drug Recommendation | |||||||||
| Model | MIMIC-III | MIMIC-IV | |||||||
| AUPRC | AUROC | F1-score | Jaccard | AUPRC | AUROC | F1-score | Jaccard | ||
| GRU | |||||||||
| Transformer | |||||||||
| RETAIN | |||||||||
| GRAM | |||||||||
| Deepr | |||||||||
| StageNet | |||||||||
| SafeDrug | |||||||||
| MICRON | |||||||||
| GAMENet | |||||||||
| MoleRec | |||||||||
| GraphCare | w/ GAT | ||||||||
| w/ GINE | |||||||||
| w/ EGT | |||||||||
| w/ GPS | |||||||||
| w/ BAT | |||||||||
Baselines. Our baselines include GRU (Chung et al., 2014), Transformer (Vaswani et al., 2017), RETAIN (Choi et al., 2016c), GRAM (Choi et al., 2017), Deepr (Nguyen et al., 2016), StageNet (Gao et al., 2020), AdaCare (Ma et al., 2020a), GRASP (Zhang et al., 2021b), SafeDrug (Yang et al., 2021b), MICRON (Yang et al., 2021a), GAMENet (Shang et al., 2019b), and MoleRec (Yang et al., 2023b). AdaCare and GRASP are evaluated only on binary prediction tasks given their computational demands. For drug recommendation, we also consider task-specific models SafeDrug, MICRON, GAMENet, and MoleRec. Our GraphCare model’s performance is examined under five GNNs and graph transformers: GAT (Veličković et al., 2017), GINE (Hu et al., 2019), EGT (Hussain et al., 2022), GPS (Rampášek et al., 2022) and our BAT. We do not compare to models such as GCT (Choi et al., 2020) and CGL (Lu et al., 2021a) as they incorporate lab results and clinical notes, which are not used in this study. Implementation details are discussed in Appendix C.
Evaluation Metrics. We consider the following metrics: (a) Accuracy - the proportion of correctly predicted instances out of the total instances; (b) F1 - the harmonic mean of precision and recall; (c) Jaccard score - the ratio of the intersection to the union of predicted and true labels; (d) AUPRC - the area under the precision-recall curve, emphasizing the trade-off between precision and recall; (e) AUROC - the area under the receiver operating characteristic curve, capturing the trade-off between the true positive and the false positive rates. (f) Cohen’s Kappa - measures inter-rater agreement for categorical items, adjusting for the expected level of agreement by chance in multi-class classification.
4.2 Experimental Results
As demonstrated in Table 2, GraphCare consistently outperforms existing baselines across all prediction tasks for both MIMIC-III and MIMIC-IV datasets. For example, when combined with BAT, GraphCare exceeds StageNet’s best result by +14.3% in AUROC for mortality prediction on MIMIC-III. Within our GraphCare framework, our proposed BAT GNN consistently performs the best, underlining the effectiveness of the bi-attention mechanism. In the following, we analyze the effects of incorporating the personalized KG and our proposed BAT in detail.
4.2.1 Effect of Personalized Knowledge Graph
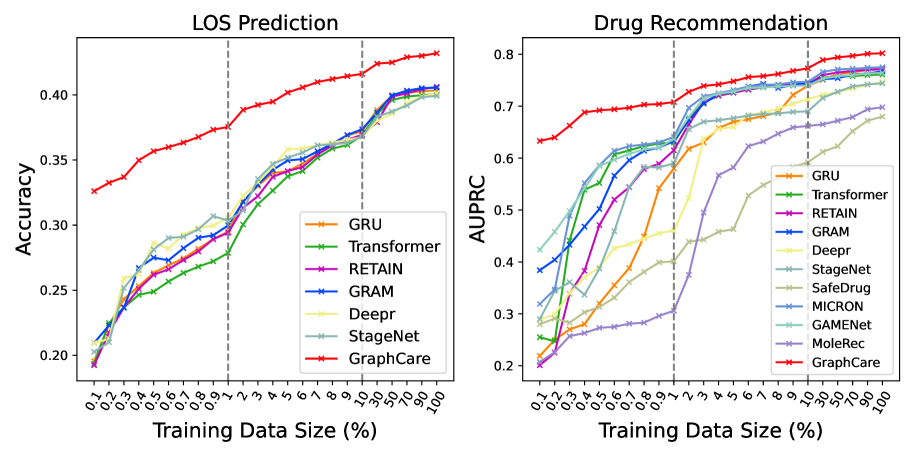
Effect of EHR Data Size. To examine the impact of training data volume on model performance, we conduct a comprehensive experiment where the size of the training data fluctuates between 0.1% and 100% of the original training set, while the validation/testing data remain constant. Performance metrics are averaged over 10 runs, each initiated with a different random seed. The results, depicted in Figure 2, suggest that GraphCare exhibits a considerable edge over other models when confronted with scarce training data. For instance, GraphCare, despite being trained on a mere 0.1% of the training data (36 patient samples), accomplished an LOS prediction accuracy comparable to the best baseline StageNet that trained on 2.0% of the training data (about 720 patient samples). A similar pattern appears in drug recommendation tasks. Notably, both GAMENet and GRAM also show a certain level of resilience against data limitations, likely due to their use of internal EHR graphs or external ontologies.
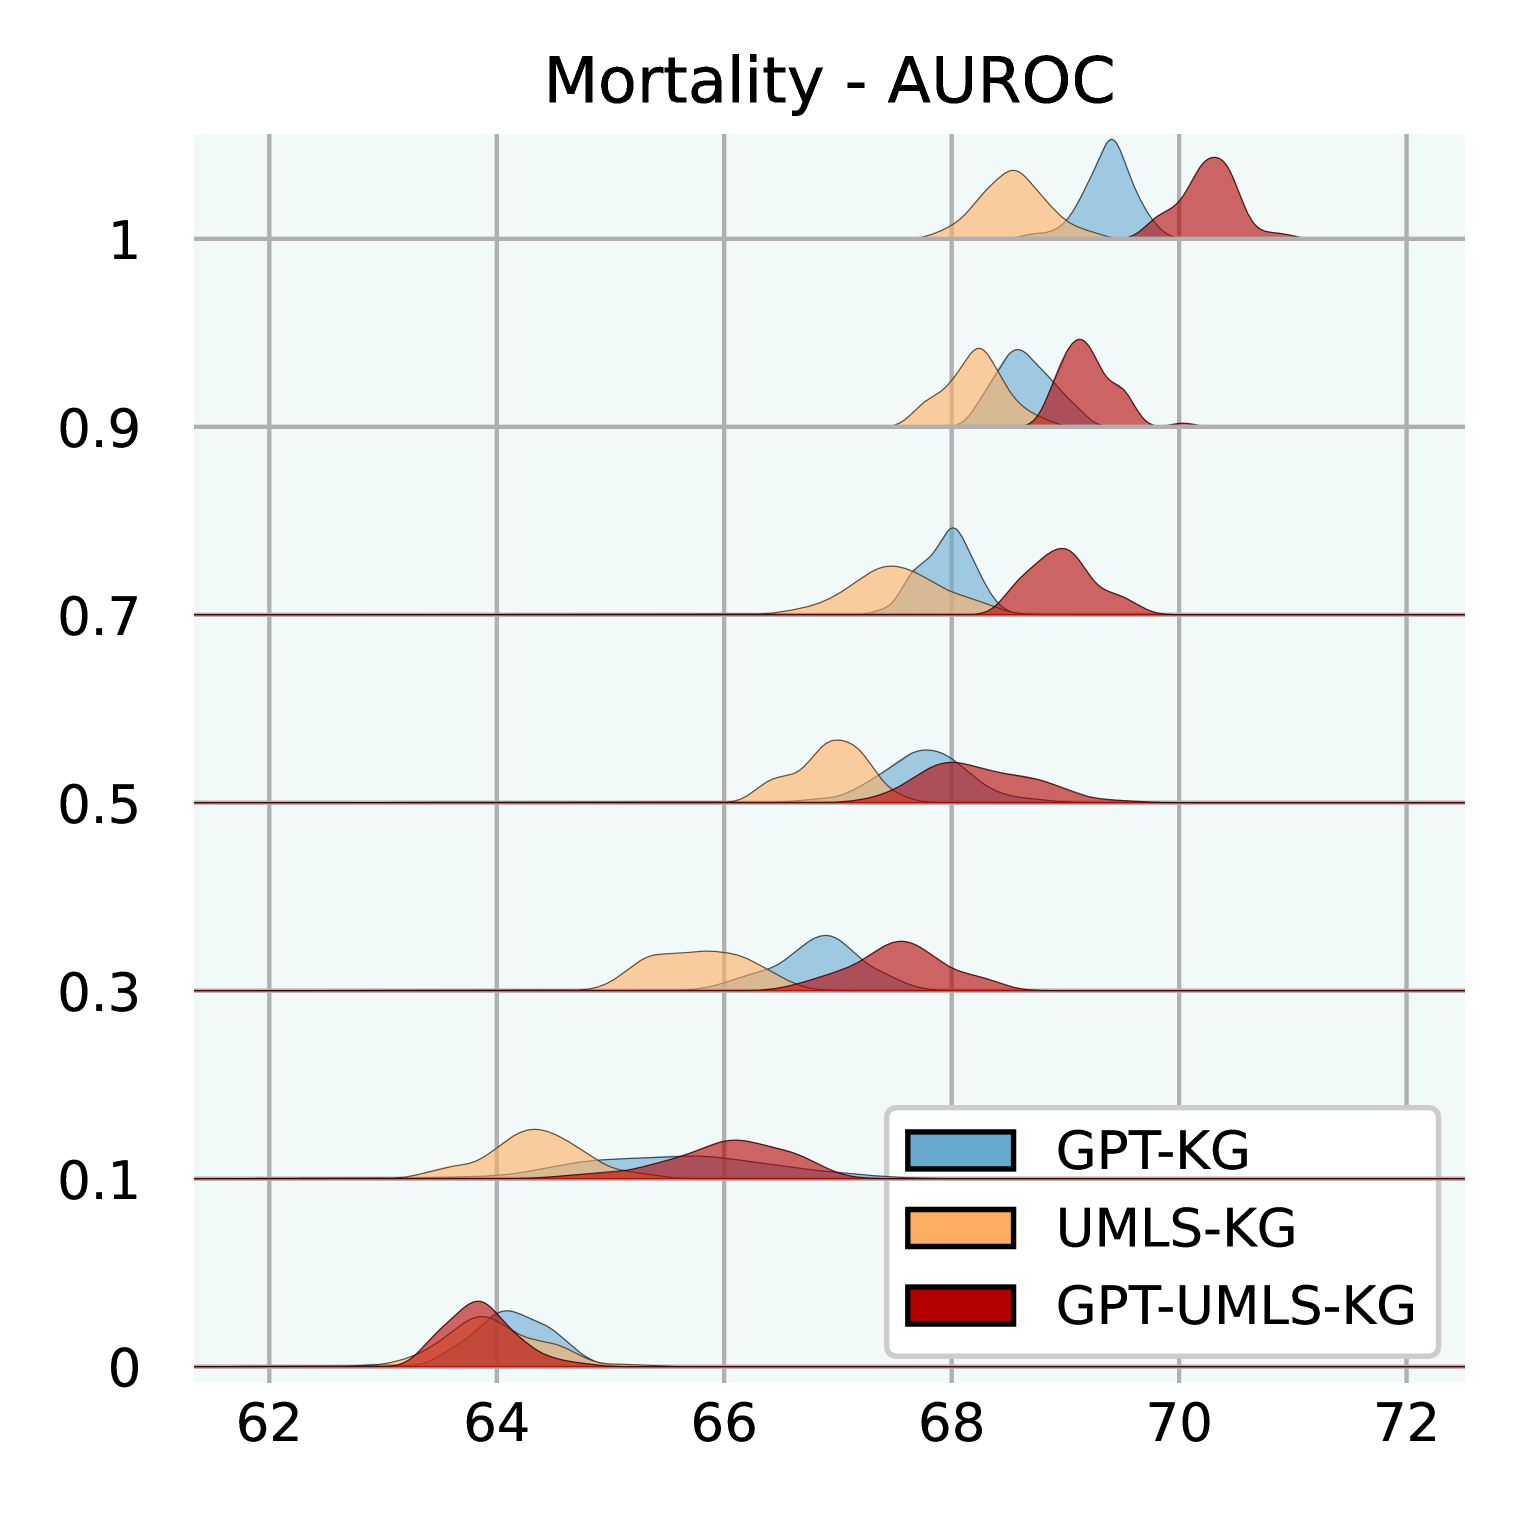
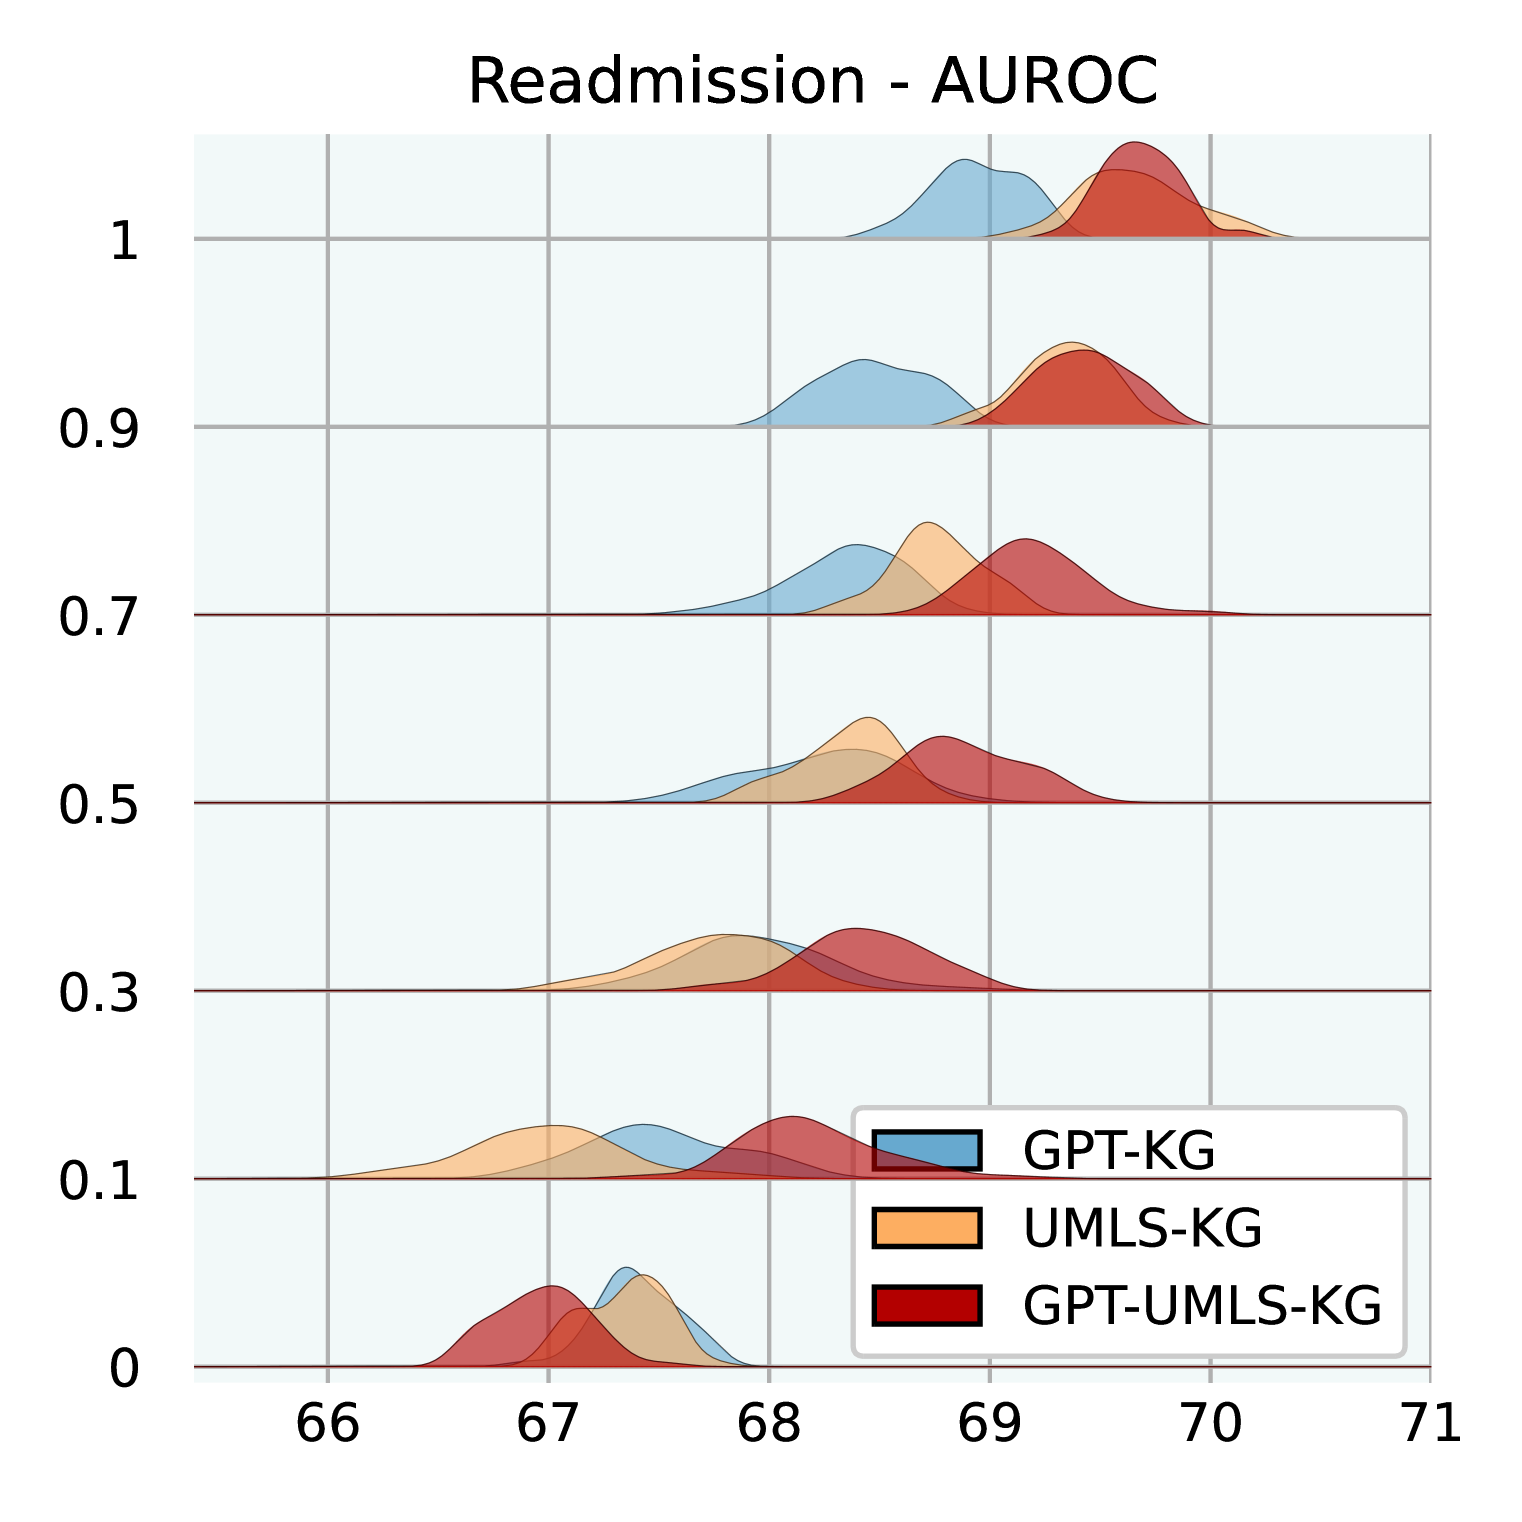
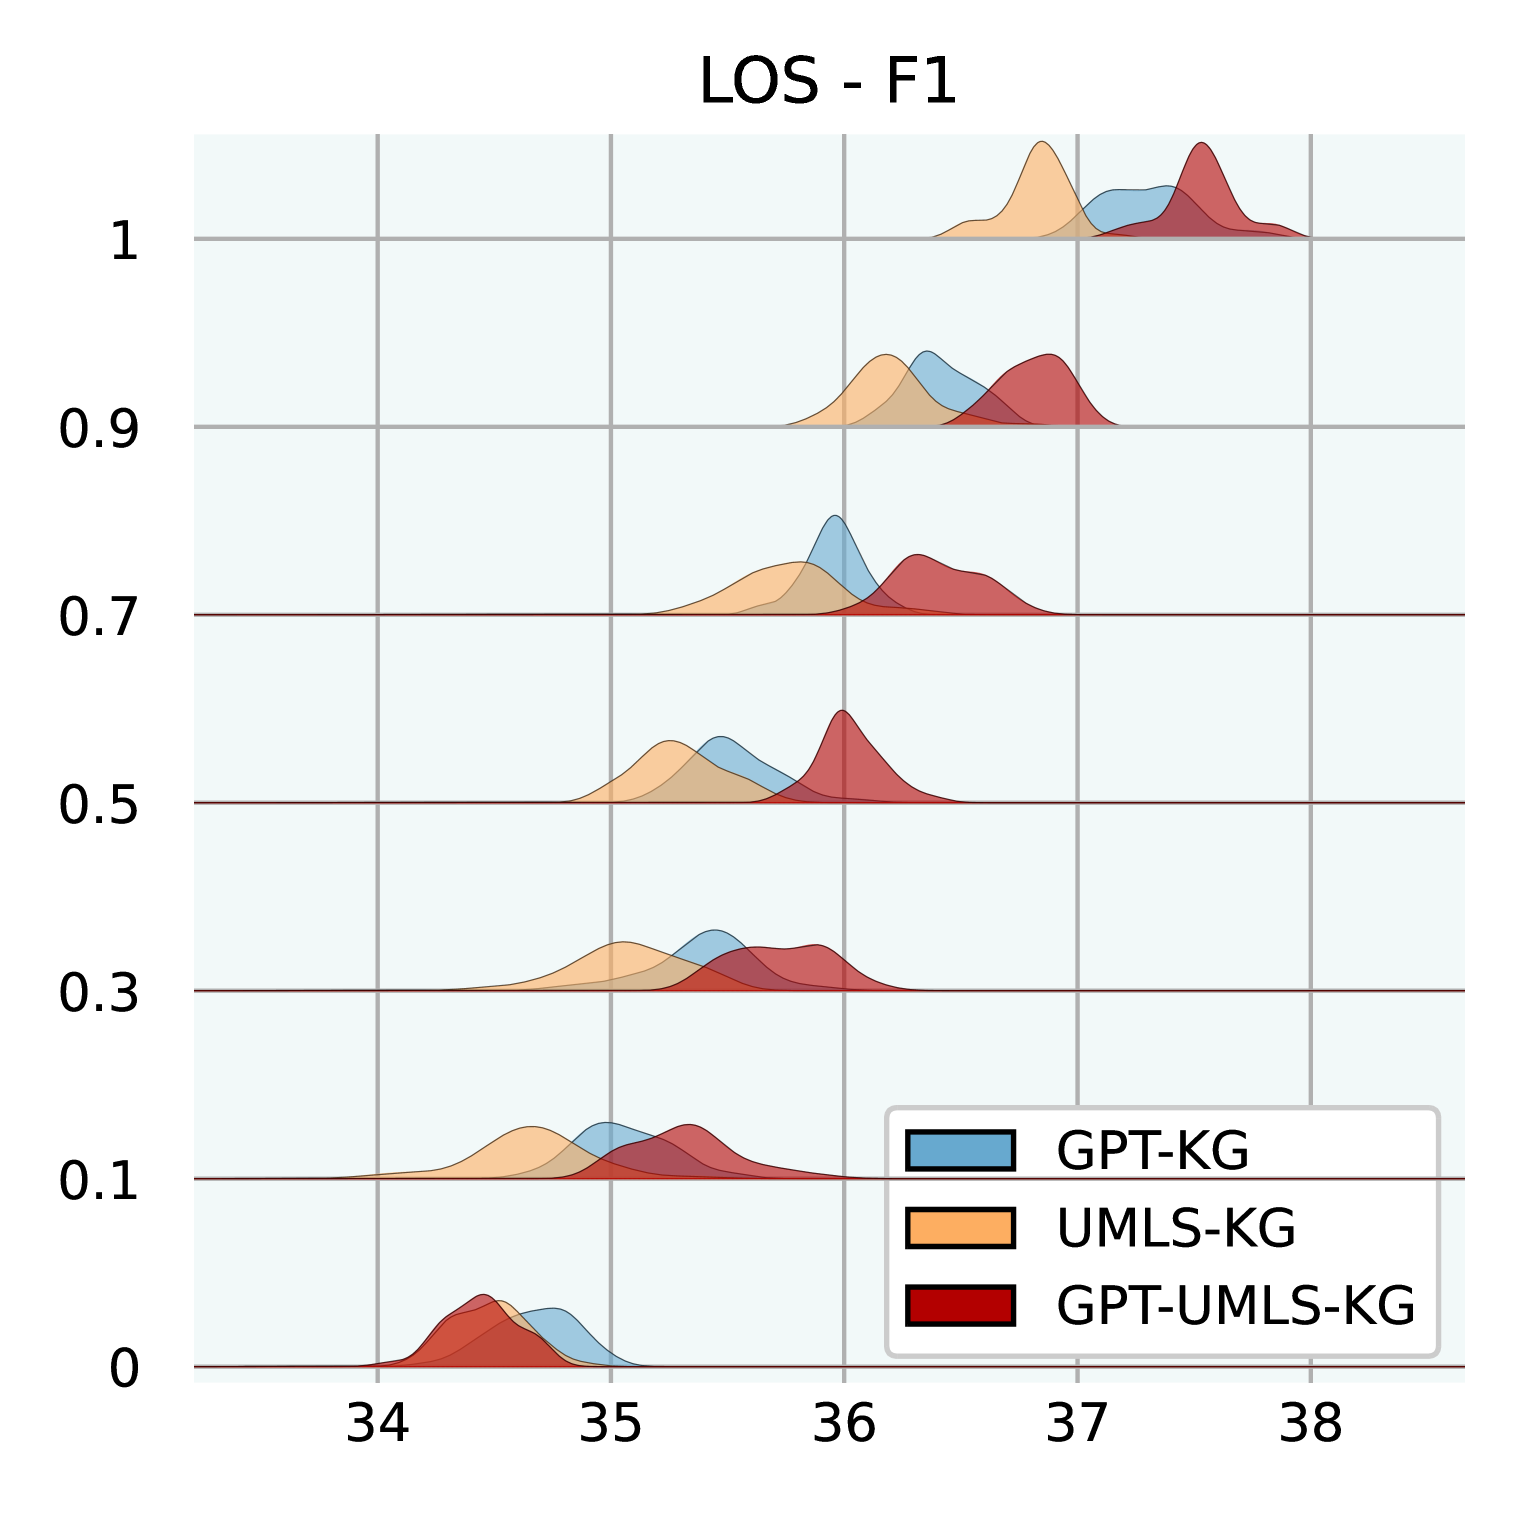
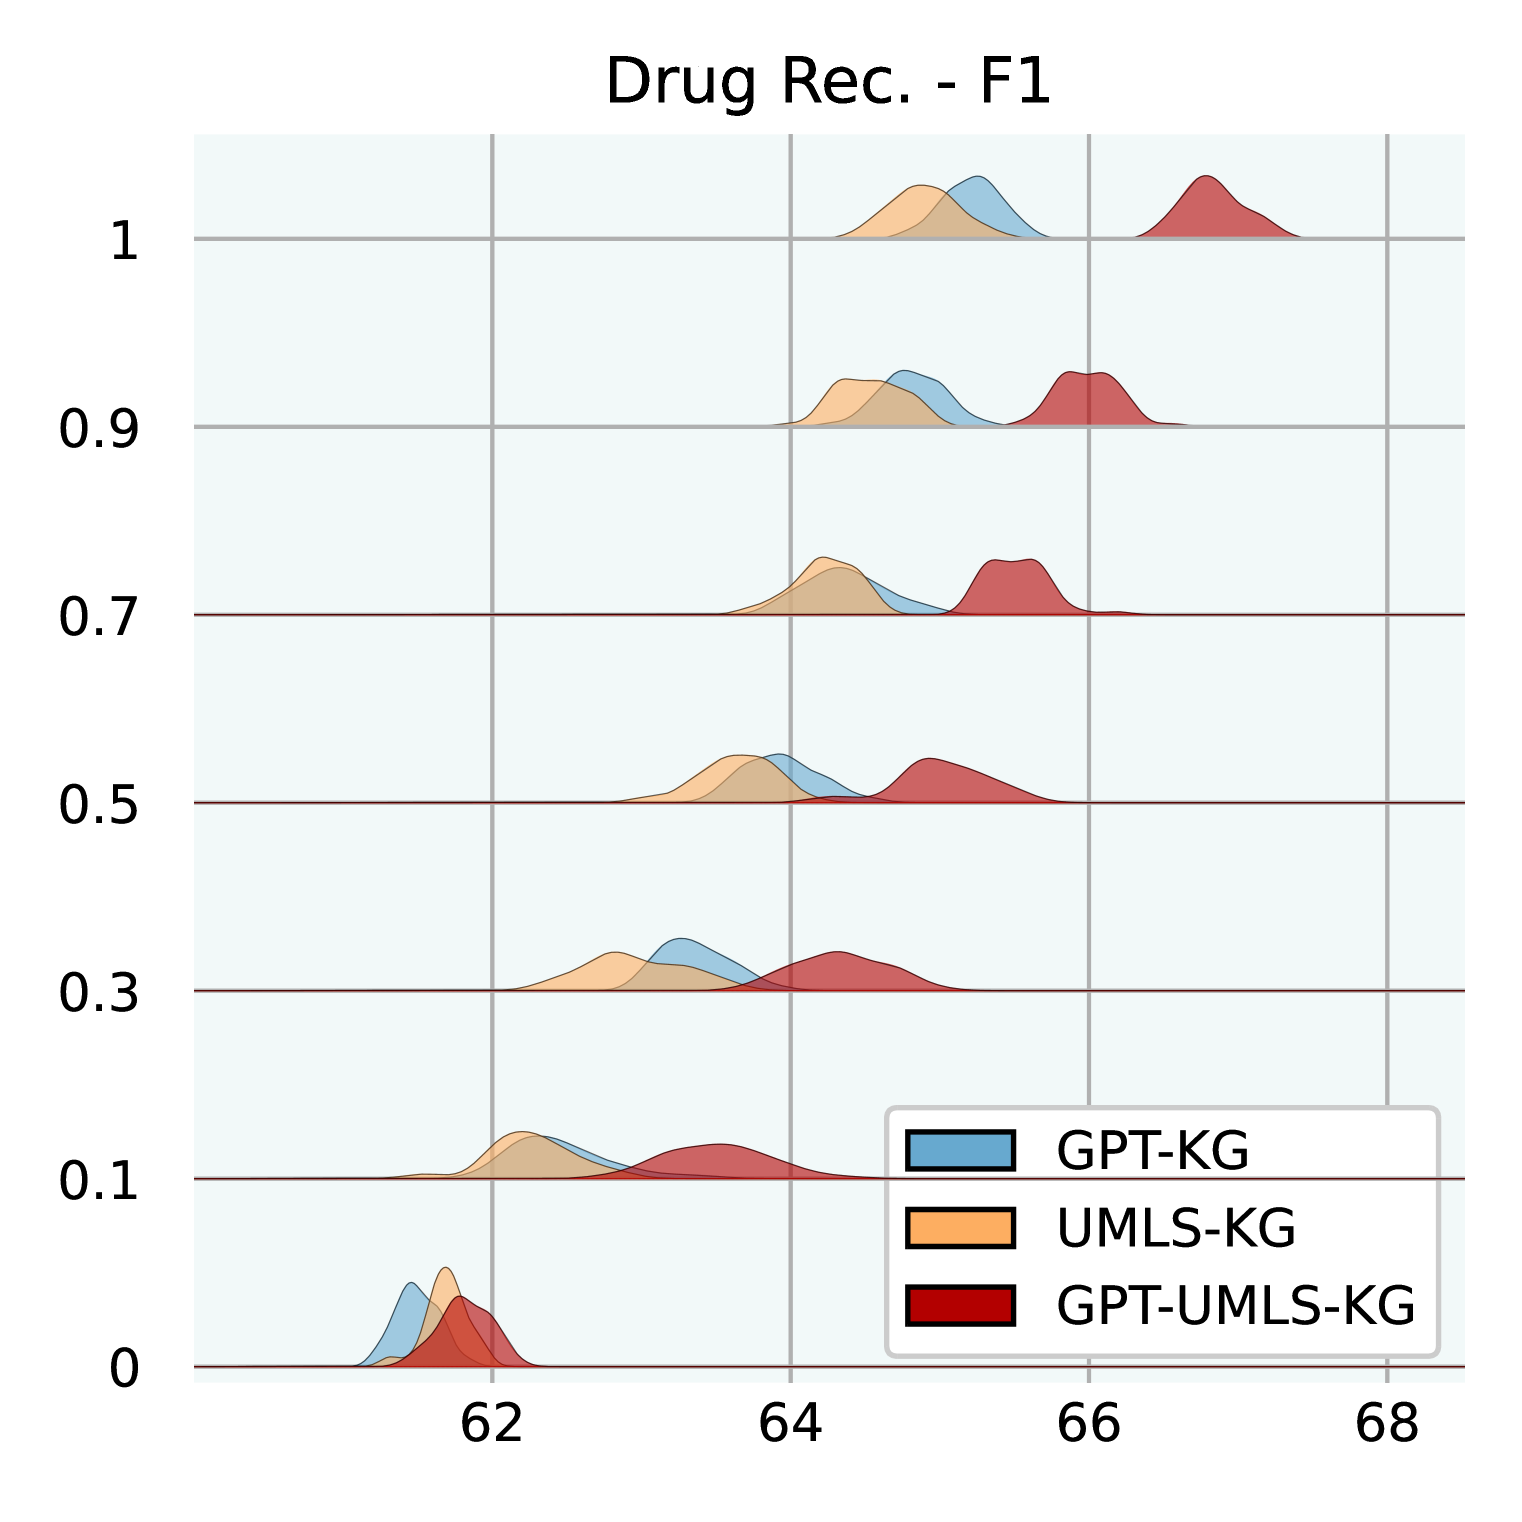
Effect of Knowledge Graph Size. Figure 3 illuminates how varying sizes of KGs influence the efficacy of GraphCare. We test GPT-KG (generated by GPT-4), UMLS-KG (sampled from UMLS), and GPT-UMLS-KG (a combination). Key observations include: (1) Across all KGs, as the size ratio of the KG increases, there is a corresponding uptick in GraphCare’s performance. (2) The amalgamated GPT-UMLS-KG consistently outperforms the other two KGs. This underscores the premise that richer knowledge bases enable more precise clinical predictions. Moreover, it demonstrates GPT-KG and UMLS-KG could enrich each other with unseen knowledge. (3) The degree of KG contribution varies depending on the task at hand. Specifically, GPT-KG demonstrates a stronger influence over mortality and LOS predictions compared to UMLS-KG. Conversely, UMLS-KG edges out in readmission prediction, while both KGs showcase comparable capabilities in drug recommendations. (4) Notably, lower KG ratios (from 0.1 to 0.5) are associated with larger standard deviations, which is attributed to the reduced likelihood of vital knowledge being encompassed within the sparsely sampled sub-KGs.
4.2.2 Effect of Bi-Attention Augmented Graph Neural Network
Table 3 provides an in-depth ablation study on the proposed GNN BAT, highlighting the profound influence of distinct components on the model’s effectiveness.
The data reveals that excluding node-level attention () results in a general drop in performance across tasks for both datasets. This downturn is particularly pronounced for the drug recommendation task. Regarding visit-level attention (), the effects of its absence are more discernible in the MIMIC-IV dataset. This is likely attributed to MIMIC-IV’s larger average number of visits per patient, as outlined in Table 1. Given this disparity, the ability to discern between distinct visits becomes pivotal across all tasks. Moreover, when considering tasks, it’s evident that the RA. task is particularly vulnerable to adjustments in visit-level attention () and edge weight (). This underlines the significance of capturing visit-level nuances and inter-entity relationships within the EHR to ensure precise RA. outcome predictions. Regarding attention initialization (AttnInit), it emerges as a crucial factor in priming the model to be more receptive to relevant clinical insights from the get-go. Omitting this initialization shows a noticeable decrement in performance, particularly for drug recommendations. This suggests that by guiding initial attention towards potentially influential nodes in the personalized KG, the model can more adeptly assimilate significant patterns and make informed predictions.
| MIMIC-III | MIMIC-IV | ||||||||
|---|---|---|---|---|---|---|---|---|---|
| Case | Variants | MT. | RA. | LOS | Drug. | MT. | RA. | LOS | Drug. |
| #0 | w/ all | ||||||||
| #1 | w/o | ||||||||
| #2 | w/o | ||||||||
| #3 | w/o | ||||||||
| #4 | w/o AttnInit | ||||||||
| #5 | w/o #(1,2,3,4) | ||||||||
4.3 Interpretability of GraphCare.
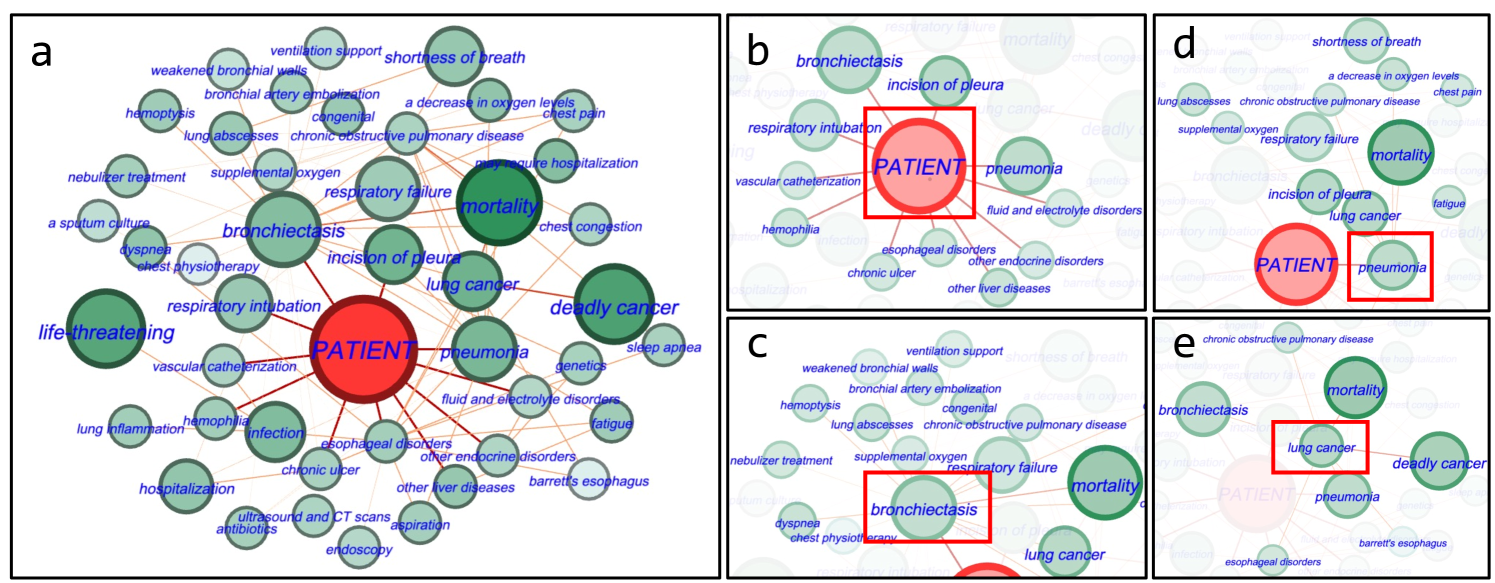
Figure 4 showcases an example of a personalized KG for mortality prediction tied to a specific patient (predicted mortality 1), who was accurately predicted only by our GraphCare method, while other baselines incorrectly estimated the outcome. In Figure 4a, important nodes and edges contributing to mortality prediction, such as “deadly cancer”, are emphasized with higher importance scores. This demonstrates the effectiveness of our BAT model in identifying relevant nodes and edges. Additionally, Figure 4b shows the direct EHR nodes connected to the patient node, enhancing interpretability of predictions using patient node embedding. Figure 4c and 4d show KG triples linked to the direct EHR nodes “bronchiectasis” and “pneumonia”. These nodes are connected to important nodes like “mortality”, “respiratory failure”, “lung cancer”, and “shortness of breath”, indicating their higher weights. In Figure 4e, the “lung cancer” node serves as a common connector for “bronchiectasis” and “pneumonia”. It is linked to both “mortality” and “deadly cancer”, highlighting its significance. Removing this node had a noticeable impact on the model’s performance, indicating its pivotal role in accurate predictions. This emphasizes the value of comprehensive health data and considering all potential health factors, no matter how indirectly connected they may seem.
5 Conclusion
We presented GraphCare, a framework that builds personalized knowledge graphs for enhanced healthcare predictions. Empirical studies show its dominance over baselines in various tasks on two datasets. With its robustness to limited data and scalability with KG size, GraphCare promises significant potential in healthcare. We discuss ethics, limitations, and risks in Appendix A.
References
- AlKhamissi et al. (2022) Badr AlKhamissi, Millicent Li, Asli Celikyilmaz, Mona Diab, and Marjan Ghazvininejad. A review on language models as knowledge bases, 2022.
- Ashfaq et al. (2019) Awais Ashfaq, Anita Sant’Anna, Markus Lingman, and Sławomir Nowaczyk. Readmission prediction using deep learning on electronic health records. Journal of biomedical informatics, 97:103256, 2019.
- Bahdanau et al. (2014) Dzmitry Bahdanau, Kyunghyun Cho, and Yoshua Bengio. Neural machine translation by jointly learning to align and translate. arXiv preprint arXiv:1409.0473, 2014.
- Bastian et al. (2009) Mathieu Bastian, Sebastien Heymann, and Mathieu Jacomy. Gephi: an open source software for exploring and manipulating networks. In Proceedings of the international AAAI conference on web and social media, volume 3, pp. 361–362, 2009.
- Belleau et al. (2008) François Belleau, Marc-Alexandre Nolin, Nicole Tourigny, Philippe Rigault, and Jean Morissette. Bio2rdf: towards a mashup to build bioinformatics knowledge systems. Journal of biomedical informatics, 41(5):706–716, 2008.
- Bhoi et al. (2021) Suman Bhoi, Mong Li Lee, Wynne Hsu, Hao Sen Andrew Fang, and Ngiap Chuan Tan. Personalizing medication recommendation with a graph-based approach. ACM Transactions on Information Systems (TOIS), 40(3):1–23, 2021.
- Blom et al. (2019) Mathias Carl Blom, Awais Ashfaq, Anita Sant’Anna, Philip D Anderson, and Markus Lingman. Training machine learning models to predict 30-day mortality in patients discharged from the emergency department: a retrospective, population-based registry study. BMJ open, 9(8):e028015, 2019.
- Bodenreider (2004) Olivier Bodenreider. The unified medical language system (umls): integrating biomedical terminology. Nucleic acids research, 32(suppl_1):D267–D270, 2004.
- Brown et al. (2020) Tom Brown, Benjamin Mann, Nick Ryder, Melanie Subbiah, Jared D Kaplan, Prafulla Dhariwal, Arvind Neelakantan, Pranav Shyam, Girish Sastry, Amanda Askell, et al. Language models are few-shot learners. Advances in neural information processing systems, 33:1877–1901, 2020.
- Cai et al. (2015) Xiongcai Cai, Oscar Perez-Concha, Enrico Coiera, Fernando Martin-Sanchez, Richard Day, David Roffe, and Blanca Gallego. Real-time prediction of mortality, readmission, and length of stay using electronic health record data. Journal of the American Medical Informatics Association, 23(3):553–561, 09 2015. ISSN 1067-5027. doi: 10.1093/jamia/ocv110. URL https://doi.org/10.1093/jamia/ocv110.
- Chen et al. (2022) Chen Chen, Yufei Wang, Bing Li, and Kwok-Yan Lam. Knowledge is flat: A seq2seq generative framework for various knowledge graph completion. arXiv preprint arXiv:2209.07299, 2022.
- Chen et al. (2023) Chen Chen, Yufei Wang, Aixin Sun, Bing Li, and Kwok-Yan Lam. Dipping plms sauce: Bridging structure and text for effective knowledge graph completion via conditional soft prompting. arXiv preprint arXiv:2307.01709, 2023.
- Chen et al. (2019) Irene Y Chen, Monica Agrawal, Steven Horng, and David Sontag. Robustly extracting medical knowledge from ehrs: a case study of learning a health knowledge graph. In PACIFIC SYMPOSIUM ON BIOCOMPUTING 2020, pp. 19–30. World Scientific, 2019.
- Choi et al. (2016a) Edward Choi, Mohammad Taha Bahadori, Andy Schuetz, Walter F Stewart, and Jimeng Sun. Doctor ai: Predicting clinical events via recurrent neural networks. In Machine learning for healthcare conference, pp. 301–318. PMLR, 2016a.
- Choi et al. (2016b) Edward Choi, Mohammad Taha Bahadori, Elizabeth Searles, Catherine Coffey, Michael Thompson, James Bost, Javier Tejedor-Sojo, and Jimeng Sun. Multi-layer representation learning for medical concepts. In proceedings of the 22nd ACM SIGKDD international conference on knowledge discovery and data mining, pp. 1495–1504, 2016b.
- Choi et al. (2016c) Edward Choi, Mohammad Taha Bahadori, Jimeng Sun, Joshua Kulas, Andy Schuetz, and Walter Stewart. Retain: An interpretable predictive model for healthcare using reverse time attention mechanism. Advances in neural information processing systems, 29, 2016c.
- Choi et al. (2017) Edward Choi, Mohammad Taha Bahadori, Le Song, Walter F Stewart, and Jimeng Sun. Gram: graph-based attention model for healthcare representation learning. In Proceedings of the 23rd ACM SIGKDD international conference on knowledge discovery and data mining, pp. 787–795, 2017.
- Choi et al. (2018) Edward Choi, Cao Xiao, Walter Stewart, and Jimeng Sun. Mime: Multilevel medical embedding of electronic health records for predictive healthcare. Advances in neural information processing systems, 31, 2018.
- Choi et al. (2020) Edward Choi, Zhen Xu, Yujia Li, Michael Dusenberry, Gerardo Flores, Emily Xue, and Andrew Dai. Learning the graphical structure of electronic health records with graph convolutional transformer. In Proceedings of the AAAI conference on artificial intelligence, volume 34, pp. 606–613, 2020.
- Chowdhery et al. (2022) Aakanksha Chowdhery, Sharan Narang, Jacob Devlin, Maarten Bosma, Gaurav Mishra, Adam Roberts, Paul Barham, Hyung Won Chung, Charles Sutton, Sebastian Gehrmann, et al. Palm: Scaling language modeling with pathways. arXiv preprint arXiv:2204.02311, 2022.
- Chung et al. (2014) Junyoung Chung, Caglar Gulcehre, KyungHyun Cho, and Yoshua Bengio. Empirical evaluation of gated recurrent neural networks on sequence modeling. arXiv preprint arXiv:1412.3555, 2014.
- Courtright et al. (2019) Katherine R Courtright, Corey Chivers, Michael Becker, Susan H Regli, Linnea C Pepper, Michael E Draugelis, and Nina R O’Connor. Electronic health record mortality prediction model for targeted palliative care among hospitalized medical patients: a pilot quasi-experimental study. Journal of general internal medicine, 34:1841–1847, 2019.
- Donnelly et al. (2006) Kevin Donnelly et al. Snomed-ct: The advanced terminology and coding system for ehealth. Studies in health technology and informatics, 121:279, 2006.
- Elixhauser A (2016) Palmer L Elixhauser A, Steiner C. Clinical classifications software (ccs). 03 2016. URL www.hcup-us.ahrq.gov/toolssoftware/ccs/ccs.jsp.
- Fey & Lenssen (2019) Matthias Fey and Jan Eric Lenssen. Fast graph representation learning with pytorch geometric. arXiv preprint arXiv:1903.02428, 2019.
- Gao et al. (2020) Junyi Gao, Cao Xiao, Yasha Wang, Wen Tang, Lucas M Glass, and Jimeng Sun. Stagenet: Stage-aware neural networks for health risk prediction. In Proceedings of The Web Conference 2020, pp. 530–540, 2020.
- Gao et al. (2022) Junyi Gao, Chaoqi Yang, Joerg Heintz, Scott Barrows, Elise Albers, Mary Stapel, Sara Warfield, Adam Cross, Jimeng Sun, et al. Medml: Fusing medical knowledge and machine learning models for early pediatric covid-19 hospitalization and severity prediction. Iscience, 25(9):104970, 2022.
- Gehman et al. (2020) Samuel Gehman, Suchin Gururangan, Maarten Sap, Yejin Choi, and Noah A Smith. Realtoxicityprompts: Evaluating neural toxic degeneration in language models. arXiv preprint arXiv:2009.11462, 2020.
- Gyrard et al. (2018) Amelie Gyrard, Manas Gaur, Saeedeh Shekarpour, Krishnaprasad Thirunarayan, and Amit Sheth. Personalized health knowledge graph. In CEUR workshop proceedings, volume 2317. NIH Public Access, 2018.
- Harutyunyan et al. (2019) Hrayr Harutyunyan, Hrant Khachatrian, David C Kale, Greg Ver Steeg, and Aram Galstyan. Multitask learning and benchmarking with clinical time series data. Scientific data, 6(1):96, 2019.
- Hu et al. (2019) Weihua Hu, Bowen Liu, Joseph Gomes, Marinka Zitnik, Percy Liang, Vijay Pande, and Jure Leskovec. Strategies for pre-training graph neural networks. arXiv preprint arXiv:1905.12265, 2019.
- Hussain et al. (2022) Md Shamim Hussain, Mohammed J. Zaki, and Dharmashankar Subramanian. Global self-attention as a replacement for graph convolution. In Proceedings of the 28th ACM SIGKDD Conference on Knowledge Discovery and Data Mining, KDD ’22, pp. 655–665, New York, NY, USA, 2022. Association for Computing Machinery. ISBN 9781450393850. doi: 10.1145/3534678.3539296. URL https://doi.org/10.1145/3534678.3539296.
- Jiang et al. (2023) Pengcheng Jiang, Shivam Agarwal, Bowen Jin, Xuan Wang, Jimeng Sun, and Jiawei Han. Text augmented open knowledge graph completion via pre-trained language models. In Anna Rogers, Jordan Boyd-Graber, and Naoaki Okazaki (eds.), Findings of the Association for Computational Linguistics: ACL 2023, pp. 11161–11180, Toronto, Canada, July 2023. Association for Computational Linguistics. doi: 10.18653/v1/2023.findings-acl.709. URL https://aclanthology.org/2023.findings-acl.709.
- Johnson et al. (2020) Alistair Johnson, Lucas Bulgarelli, Tom Pollard, Steven Horng, Leo Anthony Celi, and Roger Mark. Mimic-iv. PhysioNet. Available online at: https://physionet. org/content/mimiciv/1.0/(accessed August 23, 2021), 2020.
- Johnson et al. (2016) Alistair EW Johnson, Tom J Pollard, Lu Shen, Li-wei H Lehman, Mengling Feng, Mohammad Ghassemi, Benjamin Moody, Peter Szolovits, Leo Anthony Celi, and Roger G Mark. Mimic-iii, a freely accessible critical care database. Scientific data, 3(1):1–9, 2016.
- Kingma & Ba (2014) Diederik P Kingma and Jimmy Ba. Adam: A method for stochastic optimization. arXiv preprint arXiv:1412.6980, 2014.
- Knyazev et al. (2019) Boris Knyazev, Graham W Taylor, and Mohamed Amer. Understanding attention and generalization in graph neural networks. Advances in neural information processing systems, 32, 2019.
- Kreuzer et al. (2021) Devin Kreuzer, Dominique Beaini, Will Hamilton, Vincent Létourneau, and Prudencio Tossou. Rethinking graph transformers with spectral attention. Advances in Neural Information Processing Systems, 34:21618–21629, 2021.
- Lau-Min et al. (2021) Kelsey S Lau-Min, Stephanie Byers Asher, Jessica Chen, Susan M Domchek, Michael Feldman, Steven Joffe, Jeffrey Landgraf, Virginia Speare, Lisa A Varughese, Sony Tuteja, et al. Real-world integration of genomic data into the electronic health record: the pennchart genomics initiative. Genetics in Medicine, 23(4):603–605, 2021.
- Lee et al. (2018) John Boaz Lee, Ryan Rossi, and Xiangnan Kong. Graph classification using structural attention. In Proceedings of the 24th ACM SIGKDD International Conference on Knowledge Discovery & Data Mining, pp. 1666–1674, 2018.
- Levin et al. (2021) Scott Levin, Sean Barnes, Matthew Toerper, Arnaud Debraine, Anthony DeAngelo, Eric Hamrock, Jeremiah Hinson, Erik Hoyer, Trushar Dungarani, and Eric Howell. Machine-learning-based hospital discharge predictions can support multidisciplinary rounds and decrease hospital length-of-stay. BMJ Innovations, 7(2), 2021.
- Li et al. (2022) Michelle M Li, Kexin Huang, and Marinka Zitnik. Graph representation learning in biomedicine and healthcare. Nature Biomedical Engineering, pp. 1–17, 2022.
- Li et al. (2020) Yang Li, Buyue Qian, Xianli Zhang, and Hui Liu. Graph neural network-based diagnosis prediction. Big Data, 8(5):379–390, 2020.
- Liu et al. (2023) Pengfei Liu, Weizhe Yuan, Jinlan Fu, Zhengbao Jiang, Hiroaki Hayashi, and Graham Neubig. Pre-train, prompt, and predict: A systematic survey of prompting methods in natural language processing. ACM Computing Surveys, 55(9):1–35, 2023.
- Lovelace & Rose (2022) Justin Lovelace and Carolyn Rose. A framework for adapting pre-trained language models to knowledge graph completion. In Proceedings of the 2022 Conference on Empirical Methods in Natural Language Processing, pp. 5937–5955, 2022.
- Lu et al. (2021a) Chang Lu, Chandan K Reddy, Prithwish Chakraborty, Samantha Kleinberg, and Yue Ning. Collaborative graph learning with auxiliary text for temporal event prediction in healthcare. arXiv preprint arXiv:2105.07542, 2021a.
- Lu et al. (2021b) Chang Lu, Chandan K Reddy, and Yue Ning. Self-supervised graph learning with hyperbolic embedding for temporal health event prediction. IEEE Transactions on Cybernetics, 2021b.
- Lund & Wang (2023) Brady D Lund and Ting Wang. Chatting about chatgpt: how may ai and gpt impact academia and libraries? Library Hi Tech News, 40(3):26–29, 2023.
- Luo et al. (2022) Renqian Luo, Liai Sun, Yingce Xia, Tao Qin, Sheng Zhang, Hoifung Poon, and Tie-Yan Liu. BioGPT: generative pre-trained transformer for biomedical text generation and mining. Briefings in Bioinformatics, 23(6), sep 2022. doi: 10.1093/bib/bbac409. URL https://doi.org/10.1093%2Fbib%2Fbbac409.
- Lv et al. (2022) Xin Lv, Yankai Lin, Yixin Cao, Lei Hou, Juanzi Li, Zhiyuan Liu, Peng Li, and Jie Zhou. Do pre-trained models benefit knowledge graph completion? a reliable evaluation and a reasonable approach. Association for Computational Linguistics, 2022.
- Ma et al. (2018) Fenglong Ma, Quanzeng You, Houping Xiao, Radha Chitta, Jing Zhou, and Jing Gao. Kame: Knowledge-based attention model for diagnosis prediction in healthcare. In Proceedings of the 27th ACM International Conference on Information and Knowledge Management, pp. 743–752, 2018.
- Ma et al. (2020a) Liantao Ma, Junyi Gao, Yasha Wang, Chaohe Zhang, Jiangtao Wang, Wenjie Ruan, Wen Tang, Xin Gao, and Xinyu Ma. Adacare: Explainable clinical health status representation learning via scale-adaptive feature extraction and recalibration. In Proceedings of the AAAI Conference on Artificial Intelligence, volume 34, pp. 825–832, 2020a.
- Ma et al. (2020b) Liantao Ma, Chaohe Zhang, Yasha Wang, Wenjie Ruan, Jiangtao Wang, Wen Tang, Xinyu Ma, Xin Gao, and Junyi Gao. Concare: Personalized clinical feature embedding via capturing the healthcare context. In Proceedings of the AAAI Conference on Artificial Intelligence, volume 34, pp. 833–840, 2020b.
- Miotto et al. (2016) Riccardo Miotto, Li Li, Brian A Kidd, and Joel T Dudley. Deep patient: an unsupervised representation to predict the future of patients from the electronic health records. Scientific reports, 6(1):1–10, 2016.
- Müllner (2011) Daniel Müllner. Modern hierarchical, agglomerative clustering algorithms. arXiv preprint arXiv:1109.2378, 2011.
- Nguyen et al. (2016) Phuoc Nguyen, Truyen Tran, Nilmini Wickramasinghe, and Svetha Venkatesh. Deepr: a convolutional net for medical records. IEEE journal of biomedical and health informatics, 21(1):22–30, 2016.
- Noy et al. (2009) Natalya F Noy, Nigam H Shah, Patricia L Whetzel, Benjamin Dai, Michael Dorf, Nicholas Griffith, Clement Jonquet, Daniel L Rubin, Margaret-Anne Storey, Christopher G Chute, et al. Bioportal: ontologies and integrated data resources at the click of a mouse. Nucleic acids research, 37(suppl_2):W170–W173, 2009.
- OpenAI (2023) OpenAI. Gpt-4 technical report, 2023.
- Pan & Cimino (2014) Xuequn Pan and James J Cimino. Locating relevant patient information in electronic health record data using representations of clinical concepts and database structures. In AMIA Annual Symposium Proceedings, volume 2014, pp. 969. American Medical Informatics Association, 2014.
- Panigutti et al. (2020) Cecilia Panigutti, Alan Perotti, and Dino Pedreschi. Doctor xai: an ontology-based approach to black-box sequential data classification explanations. In Proceedings of the 2020 conference on fairness, accountability, and transparency, pp. 629–639, 2020.
- Paszke et al. (2019) Adam Paszke, Sam Gross, Francisco Massa, Adam Lerer, James Bradbury, Gregory Chanan, Trevor Killeen, Zeming Lin, Natalia Gimelshein, Luca Antiga, et al. Pytorch: An imperative style, high-performance deep learning library. Advances in neural information processing systems, 32, 2019.
- Pedregosa et al. (2011) Fabian Pedregosa, Gaël Varoquaux, Alexandre Gramfort, Vincent Michel, Bertrand Thirion, Olivier Grisel, Mathieu Blondel, Peter Prettenhofer, Ron Weiss, Vincent Dubourg, et al. Scikit-learn: Machine learning in python. the Journal of machine Learning research, 12:2825–2830, 2011.
- Petroni et al. (2019) Fabio Petroni, Tim Rocktäschel, Patrick Lewis, Anton Bakhtin, Yuxiang Wu, Alexander H Miller, and Sebastian Riedel. Language models as knowledge bases? arXiv preprint arXiv:1909.01066, 2019.
- Ping et al. (2017) Peipei Ping, Karol Watson, Jiawei Han, and Alex Bui. Individualized knowledge graph: a viable informatics path to precision medicine. Circulation research, 120(7):1078–1080, 2017.
- Rampášek et al. (2022) Ladislav Rampášek, Michael Galkin, Vijay Prakash Dwivedi, Anh Tuan Luu, Guy Wolf, and Dominique Beaini. Recipe for a general, powerful, scalable graph transformer. In S. Koyejo, S. Mohamed, A. Agarwal, D. Belgrave, K. Cho, and A. Oh (eds.), Advances in Neural Information Processing Systems, volume 35, pp. 14501–14515. Curran Associates, Inc., 2022. URL https://proceedings.neurips.cc/paper_files/paper/2022/file/5d4834a159f1547b267a05a4e2b7cf5e-Paper-Conference.pdf.
- Rastogi & Zaki (2020) Nidhi Rastogi and Mohammed J Zaki. Personal health knowledge graphs for patients. arXiv preprint arXiv:2004.00071, 2020.
- Rotmensch et al. (2017) Maya Rotmensch, Yoni Halpern, Abdulhakim Tlimat, Steven Horng, and David Sontag. Learning a health knowledge graph from electronic medical records. Scientific reports, 7(1):1–11, 2017.
- Shang et al. (2019a) Junyuan Shang, Tengfei Ma, Cao Xiao, and Jimeng Sun. Pre-training of graph augmented transformers for medication recommendation. arXiv preprint arXiv:1906.00346, 2019a.
- Shang et al. (2019b) Junyuan Shang, Cao Xiao, Tengfei Ma, Hongyan Li, and Jimeng Sun. Gamenet: Graph augmented memory networks for recommending medication combination. In proceedings of the AAAI Conference on Artificial Intelligence, volume 33, pp. 1126–1133, 2019b.
- Sheng et al. (2020) Emily Sheng, Kai-Wei Chang, Premkumar Natarajan, and Nanyun Peng. Towards controllable biases in language generation. arXiv preprint arXiv:2005.00268, 2020.
- Shickel et al. (2017) Benjamin Shickel, Patrick James Tighe, Azra Bihorac, and Parisa Rashidi. Deep ehr: a survey of recent advances in deep learning techniques for electronic health record (ehr) analysis. IEEE journal of biomedical and health informatics, 22(5):1589–1604, 2017.
- Shirai et al. (2021) Sola Shirai, Oshani Seneviratne, and Deborah L McGuinness. Applying personal knowledge graphs to health. arXiv preprint arXiv:2104.07587, 2021.
- Su et al. (2020) Chenhao Su, Sheng Gao, and Si Li. Gate: graph-attention augmented temporal neural network for medication recommendation. IEEE Access, 8:125447–125458, 2020.
- Vaswani et al. (2017) Ashish Vaswani, Noam Shazeer, Niki Parmar, Jakob Uszkoreit, Llion Jones, Aidan N Gomez, Łukasz Kaiser, and Illia Polosukhin. Attention is all you need. Advances in neural information processing systems, 30, 2017.
- Veličković et al. (2017) Petar Veličković, Guillem Cucurull, Arantxa Casanova, Adriana Romero, Pietro Lio, and Yoshua Bengio. Graph attention networks. arXiv preprint arXiv:1710.10903, 2017.
- Wang et al. (2020a) Chenguang Wang, Xiao Liu, and Dawn Song. Language models are open knowledge graphs. arXiv preprint arXiv:2010.11967, 2020a.
- Wang et al. (2020b) Guangtao Wang, Rex Ying, Jing Huang, and Jure Leskovec. Multi-hop attention graph neural network. arXiv preprint arXiv:2009.14332, 2020b.
- Weidinger et al. (2021) Laura Weidinger, John Mellor, Maribeth Rauh, Conor Griffin, Jonathan Uesato, Po-Sen Huang, Myra Cheng, Mia Glaese, Borja Balle, Atoosa Kasirzadeh, et al. Ethical and social risks of harm from language models. arXiv preprint arXiv:2112.04359, 2021.
- Xiao et al. (2018) Cao Xiao, Tengfei Ma, Adji B Dieng, David M Blei, and Fei Wang. Readmission prediction via deep contextual embedding of clinical concepts. PloS one, 13(4):e0195024, 2018.
- Xie et al. (2019) Xiancheng Xie, Yun Xiong, Philip S Yu, and Yangyong Zhu. Ehr coding with multi-scale feature attention and structured knowledge graph propagation. In Proceedings of the 28th ACM international conference on information and knowledge management, pp. 649–658, 2019.
- Yang et al. (2021a) Chaoqi Yang, Cao Xiao, Lucas Glass, and Jimeng Sun. Change matters: Medication change prediction with recurrent residual networks. arXiv preprint arXiv:2105.01876, 2021a.
- Yang et al. (2021b) Chaoqi Yang, Cao Xiao, Fenglong Ma, Lucas Glass, and Jimeng Sun. Safedrug: Dual molecular graph encoders for recommending effective and safe drug combinations. arXiv preprint arXiv:2105.02711, 2021b.
- Yang et al. (2023a) Chaoqi Yang, Zhenbang Wu, Patrick Jiang, Zhen Lin, Junyi Gao, Benjamin P. Danek, and Jimeng Sun. Pyhealth: A deep learning toolkit for healthcare applications. In Proceedings of the 29th ACM SIGKDD Conference on Knowledge Discovery and Data Mining, KDD ’23, pp. 5788–5789, New York, NY, USA, 2023a. Association for Computing Machinery. ISBN 9798400701030. doi: 10.1145/3580305.3599178. URL https://doi.org/10.1145/3580305.3599178.
- Yang et al. (2023b) Nianzu Yang, Kaipeng Zeng, Qitian Wu, and Junchi Yan. Molerec: Combinatorial drug recommendation with substructure-aware molecular representation learning. In Proceedings of the ACM Web Conference 2023, pp. 4075–4085, 2023b.
- Yao et al. (2019) Liang Yao, Chengsheng Mao, and Yuan Luo. Kg-bert: Bert for knowledge graph completion. arXiv preprint arXiv:1909.03193, 2019.
- Yin et al. (2019) Changchang Yin, Rongjian Zhao, Buyue Qian, Xin Lv, and Ping Zhang. Domain knowledge guided deep learning with electronic health records. In 2019 IEEE International Conference on Data Mining (ICDM), pp. 738–747. IEEE, 2019.
- Zhang et al. (2021a) Bingfeng Zhang, Jimin Xiao, Jianbo Jiao, Yunchao Wei, and Yao Zhao. Affinity attention graph neural network for weakly supervised semantic segmentation. IEEE Transactions on Pattern Analysis and Machine Intelligence, 44(11):8082–8096, 2021a.
- Zhang et al. (2021b) Chaohe Zhang, Xin Gao, Liantao Ma, Yasha Wang, Jiangtao Wang, and Wen Tang. Grasp: generic framework for health status representation learning based on incorporating knowledge from similar patients. In Proceedings of the AAAI conference on artificial intelligence, volume 35, pp. 715–723, 2021b.
- Zhang et al. (2018) Jiani Zhang, Xingjian Shi, Junyuan Xie, Hao Ma, Irwin King, and Dit-Yan Yeung. Gaan: Gated attention networks for learning on large and spatiotemporal graphs. arXiv preprint arXiv:1803.07294, 2018.
- Zhang et al. (2020) Tianran Zhang, Muhao Chen, and Alex AT Bui. Diagnostic prediction with sequence-of-sets representation learning for clinical events. In Artificial Intelligence in Medicine: 18th International Conference on Artificial Intelligence in Medicine, AIME 2020, Minneapolis, MN, USA, August 25–28, 2020, Proceedings 18, pp. 348–358. Springer, 2020.
- Zhu & Razavian (2021) Weicheng Zhu and Narges Razavian. Variationally regularized graph-based representation learning for electronic health records. In Proceedings of the Conference on Health, Inference, and Learning, pp. 1–13, 2021.
1Contents of Appendix
Appendix A Ethics, Limitations, and Risks
In this study, we introduce a novel framework, GraphCare, which generates knowledge graphs (KGs) by leveraging relational knowledge from large language models (LLMs) and extracting information from existing KGs. This methodology is designed to provide an advanced tool for healthcare prediction tasks, enhancing their accuracy and interpretability. However, the ethical considerations associated with our approach warrant careful attention. Previous research has shown that LLMs may encode biases related to race, gender, and other demographic attributes (Sheng et al., 2020; Weidinger et al., 2021). Furthermore, they may potentially generate toxic outputs (Gehman et al., 2020). Such biases and toxicity could inadvertently influence the content of the knowledge graphs generated by our proposed GraphCare, which relies on these LLMs for information extraction. Furthermore, the issue of privacy has emerged as a paramount concern associated with LLM usage (Lund & Wang, 2023).
We explain the limitations of GraphCare and describe the measures we have implemented to counteract or mitigate these ethical concerns as follows.
A.1 Preventing Toxic Behaviors and Ensuring Patient Privacy
Primarily, the LLM within GraphCare is exclusively utilized to extract knowledge associated with medical concepts. This focused usage drastically reduces the chances of inheriting wider social biases or manifesting toxic behaviors intrinsic to the parent LLMs. Furthermore, we ensure that no patient data is introduced into any open-source software. This measure fortifies patient confidentiality and negates the possibility of injecting individual biases into the knowledge graphs. This commitment is further elucidated in Figure 5.
A.2 Counteracting the Adverse Effects of LLM Hallucinations
The predictive efficacy of GraphCare is intrinsically tied to the veracity of knowledge graph triples sourced from LLMs. Hence, hallucinations within LLMs can detrimentally skew the performance of the model. To counterbalance this, we collaborate with a medical professional (MD) to scrutinize the accuracy of LLM-derived triples and expunged content that might be detrimental (further details are provided in Appendix D.1). Leveraging domain expert knowledge on triple evaluation and selection greatly minimizes the negative impacts of LLM hallucinations, ensuring a high-quality knowledge probing from LLM.
A.3 Application
It’s important to emphasize that GraphCare is primarily intended for research purposes. This means that while it offers insights and can provide valuable information, it has not been certified or endorsed for clinical or diagnostic use. Any implementation or interpretation of GraphCare should be undertaken with the clear understanding of its experimental nature.
While GraphCare serves as an advanced tool for healthcare prediction tasks, it should not replace or undermine the expertise of medical professionals. We strongly advise against relying solely on its predictions for healthcare decisions. Medical doctors possess extensive training and clinical experience, and their judgment should always be prioritized over automated systems. Patients and healthcare providers should use the information from GraphCare as supplementary and should always consult with healthcare professionals before making any medical decisions.
Appendix B EHR Dataset Processing
In this paper, we use MIMIC-III and MIMIC-IV datasets. Both datasets are under PhysioNet Credentialed Health Data License 1.5.0222https://physionet.org/content/mimiciii/view-license/1.4/ We employ PyHealth (Yang et al., 2023a) to process these two datasets. PyHealth has an EHR dataset pre-processing pipeline that standardizes the datasets, organizing each patient’s data into several visits, where each visit contains unique and specified feature lists. For our experiments, we create feature lists composed of conditions and procedures for Length of Stay (LOS) prediction and drug recommendations. For the prediction tasks of mortality and readmission, we include the medication (drug) list in addition to the condition and procedure lists.
Subsequent to the parsing of the datasets, PyHealth also enables the mapping of medical concepts across various coding systems using the provided code maps. The involved coding systems in this process are ICD-9333https://www.cdc.gov/nchs/icd/icd9cm.htm, ICD-10444https://www.cms.gov/medicare/icd-10/2023-icd-10-cm,555https://www.cms.gov/medicare/icd-10/2023-icd-10-pcs, CCS666https://www.hcup-us.ahrq.gov/toolssoftware/ccs/ccs.jsp, NDC777https://www.accessdata.fda.gov/scripts/cder/ndc/index.cfm and ATC888https://www.who.int/tools/atc-ddd-toolkit/atc-classification. In our experiment, we convert 11,736 ICD-9-CM codes and 72,446 ICD-10-CM codes into 285 CCS-CM codes to capture condition concepts. Similarly, we map 4,670 ICD-9-PROC codes (a part of ICD-9-CM for procedure coding) and 79,758 ICD-10-PCS codes to 231 CCS-PROC codes for procedure concepts. For drug concepts, we convert 1,143,020 NDC codes into 269 level-3 ATC codes. This mapping process enhances the training speed and predictive performance of the model by reducing the granularity of medical concepts.
Appendix C Implementation Details
In this section, we present the implementation details of GraphCare, aligning it closely with the methodology described in Section 3, which improves reproducibility and clarity.
C.1 Implementation Details of Step 1 (§3.1): Concept-Specific KG Generation
Medical concepts , , and . After the EHR data preprocessing illustrated in Appendix B, we have 285 conditions (), 231 procedures (), and 269 drugs ().
LLM-based KG extraction. We detail this process in Appendix D.1.
Subgraph sampling from existing KGs. We detail this process in Appendix D.2.
The hyperparameter studies regarding (1) LLM prompting times , and (2) hops from the source entity are showcased in Table 6, 7, and 8.
Node and Edge Clustering. To analyze the global graph , we obtain the word embeddings for each node and edge. These embeddings have 1536 dimensions and are sourced from the second-generation GPT-3 model, specifically the text-embedding-ada-002999https://openai.com/blog/new-and-improved-embedding-model). The model will output a single vector embedding of the input text regardless of the number of tokens it contains. We use Scikit-learn 1.2.1 (Pedregosa et al., 2011) to implement agglomerative clustering. We detail the hyperparameter study (for distance threshold ) of clustering in Appendix G.1. was chosen based on the study.
C.2 Implementation Details of Step 2 (§3.2): Personalized KG Composition
Visit Processing: Iterate through each visit in the patient’s EHR. For each visit , we have the medical concepts .
Inter-Visit Relationships: Identify and establish connections between nodes across different visits if they share a relationship in the global graph . These connections are represented by the set , highlighting the continuity and progression in the patient’s medical history.
Final Personalized KG Assembly: Combine all the integrated concept-specific KGs, the patient node , and the inter-visit relationships to form the final personalized KG for the patient, . This KG encapsulates the entire medical history of the patient, structured in a cohesive and interconnected manner.
C.3 Implementation Details of Step 3 (§3.3): BAT GNN
Attention Initialization. Keywords we experimented for attention initialization are in Table 4
| Task | Conditions | Procedures | Drugs |
|---|---|---|---|
| MT. |
terminal condition,
|
critical interventions,
|
palliative medication,
|
| RA. |
chronic ailment,
|
follow-up procedure,
|
maintenance medication,
|
| LOS |
acute condition,
|
major surgery,
|
- |
| Drug. |
chronic disease,
|
diagnostic procedure,
|
- |
Pateint Representations Study. We detail this in Appendix E.1. Based on the results, we use joint representation in experiments.
Hyperparameter Study. We detail this in Appendix G.2.
C.4 Experiment Environments
Hardware. All experiments are conducted on a machine equipped with two AMD EPYC 7513 32-Core Processors, 528GB RAM, eight NVIDIA RTX A6000 GPUs, and CUDA 11.7.
Software. We implement GraphCare using Python 3.8.13, PyTorch 1.12.0 (Paszke et al., 2019), and PyTorch Geometric 2.3.0 (Fey & Lenssen, 2019). We employ PyHealth (Yang et al., 2023a) to pre-process the EHR data (illustrated in Appendix B). We utilize medical code mappings from ICD-(9/10) to CCS for conditions and procedures, from NDC to ATC (level-3) for drugs. The mapping files are provided by AHRQ (Elixhauser A, 2016) and BioPortal (Noy et al., 2009). We use Gephi (Bastian et al., 2009) for knowledge graph visualization.
C.5 Training Details
General Setting. We split the dataset by 8:1:1 for training/validation/testing data, and we use Adam (Kingma & Ba, 2014) as the optimizer. Based on our hyperparameter study in Appendix G.2, we set learning rate 1e-5, weight decay 1e-5, batch size 4, and hidden dimension 128. All models are trained via 50 epochs over all patient samples, and the early stopping strategy monitored by AUROC with 10 epochs is applied.
Features for Different Tasks. We take conditions and procedures as the features for the length-of-stay prediction and drug recommendation and additionally take drugs as features for mortality prediction and readmission prediction.
Baseline Models. We use PyHealth (Yang et al., 2023a) pipeline to load the implemented models with their best reported settings. For GraphCare w/ GPS (Rampášek et al. (2022)), we apply LapPE (Kreuzer et al. (2021)) as the Laplacian positional encoding, GINE (Hu et al. (2019)) as the local message-passing mechanism, and Transformer (Vaswani et al. (2017)) for the global attention.
Appendix D Knowledge Graph Construction
In this section, we illustrate our solution to construct a biomedical knowledge graph (KG) for each medical concept by prompting from a large language model (LLM) and sampling a subgraph from a well-established KG.
D.1 Prompting KG from Large Language Model

GPT-KG. Figure 6 showcases a carefully designed prompt for the retrieval of a biomedical KG from a generative LLM. The main goal of this approach is to leverage the extensive knowledge embedded in the LLM to extract meaningful triples consisting of two entities and a relationship.
In our strategy, we begin with a prompt related to a medical condition, a procedure, or a drug. The LLM is then tasked with generating a list of updates that extrapolate as many relationships as possible from this prompt. Each update is a triple following the format [ENTITY 1, RELATIONSHIP, ENTITY 2] where ENTITY 1 and ENTITY 2 should be nouns. Our goal is to generate these triples in both breadth (a wide variety of entities and relationships related to the initial term) and depth (following chains of relationships to discover new entities and relationships). The process continues until we obtain a list with 100 KG triples. This prompting-based approach provides a structured, interconnected knowledge graph from the unstructured knowledge embedded in the LLM, which proves especially beneficial for personalized KG generation.
In the experiment, we iterate through the vocabulary of conditions, procedures, and drugs contained in CCS and ATC (level-3) with their code-name mappings101010https://www.hcup-us.ahrq.gov/toolssoftware/ccs,111111https://bioportal.bioontology.org/ontologies/ATC: where is the corresponding name for the medical code . For each term , we input it with its category (either ”condition”, ”procedure” or ”drug”) to the function ehr_kg_prompting() shown in Figure 6 times and compose the graphs of all runs into one, i.e., , to obtain more comprehensive graphs.
| Concept type | Conditions | Procedures | Drugs |
|---|---|---|---|
| Vocabulary | CCSCM | CCSPROC | ATC-3 |
| Breadth | |||
| Depth | |||
| Faithfulness |
| Concept type | Conditions | Procedures | Drugs |
|---|---|---|---|
| Vocabulary | CCSCM | CCSPROC | ATC-3 |
| Breadth | |||
| Depth | |||
| Faithfulness |
We engaged a medical professional collaborating with us to evaluate the KG triples produced by LLM. The outcomes of this evaluation are presented in Table 5. As evidenced by the results, the triples generated by GPT-4 exhibit high quality in terms of their breadth, depth, and faithfulness.
Furthermore, after clustering of nodes / edges with , we futher eliminated 27 out of the 4,626 nodes (clusters) due to their inclusion of inaccurate or potential misleading content, with the help from medical professionals. This measure resulted in the removal of 3,393 KG triples, addressing potential ethical concerns. We also asked medical professionals for their help to remove triples that contain inaccurate, biased, or misleading information, which resulted in the removal of 539 triples. This triple filtering process addresses the potential echical concerns.
As a result, we obtained 65,993 non-redundant KG triples with 48,914 unique entities and 8,067 unique relations when we set , as shown in Table 6. For future work, we will explore to use this prompting-based method to construct more task-specific KGs, aiming at providing more relevant triples especially beneficial to a certain prediction.
D.2 Sampling Subgraph from Existing KG
UMLS-KG. To extract subgraphs for medical concepts from existing well-established biomedical KG like UMLS (Bodenreider, 2004), we take the following steps:
-
1.
We use text-embedding-ada-002 to retrieve the word embedding of all entities in the UMLS KG and all concepts contained in the target medical coding system (CCS-CM, CCS-PROC in our case) for conditions and procedures. For drugs (ATC-3), we use the existing ATC-to-UMLS_CUI mapping provided by BioPortal121212https://bioportal.bioontology.org/ontologies.
-
2.
For each medical concept, we search the entity in UMLS that with the most similar word embeeding, and create a mapping from CCS/ATC concept names to those entities.
-
3.
For each UMLS entity in this mapping, we apply subgraph sampling described in the following Algorithm 1.
In Algorithm 1. We have four arguments - medical concept (in CCS/ATC), source KG (UMLS), hop limit and window size . In brief, we search all the triples containing for the first hop and search triples containing the other entity for each previous-hop triple. When setting and , we obtain 265,587 non-redundant KG triples with 137,845 unique entities and 94 unique relations, as shown in Table 6.
| KG | Hyperparameter | Condition | Procedure | Drug | Total |
|---|---|---|---|---|---|
| GPT-KG | =3 | (17780, 3633, 22421) | (9636, 1991, 10429) | (26922, 4362, 33380) | (48914, 8067, 65993) |
| UMLS-KG | =1 | (11895, 40, 17747) | (3614, 41, 4158) | (6509, 50, 7547) | (20466, 66, 29334) |
| UMLS-KG | =2, =5 | (86143, 70, 151294) | (68129, 71, 98817) | (63274, 79, 87267) | (137845, 94, 265587) |
GPT-UMLS-KG. By integrating concept-specific KGs produced by GPT-4 with those from UMLS, we constructed the GPT-UMLS-KG. The expert assessment of this amalgamated KG is presented in Table 5. Notably, compared to GPT-KG, there is an enhancement in quality across all dimensions, consistent with our observations in Figure 3.
D.3 Knowledge Graphs after Clustering
| KG | Hyperparameter | # Nodes | # Edges | # Triples |
|---|---|---|---|---|
| GPT-KG | =3 | 4599 | 752 | 31325 |
| UMLS-KG | =1 | 3053 | 40 | 12421 |
| UMLS-KG | =2, =5 | 10805 | 54 | 81073 |
| GPT-UMLS-KG | =3, =1 | 6355 | 774 | 40496 |
| GPT-UMLS-KG | =3, =2, =5 | 12284 | 785 | 104460 |
In Table 7, we present the KGs following the node/edge clustering process detailed in §3.1, with a set value of (as optimized in Appendix G.1). We note a notably low triple union between GPT-KG and UMLS-KG. This suggests that the knowledge from one can significantly complement the other. Consequently, GPT-UMLS-KG is poised to outperform either of the two individual KGs. This inference is empirically supported by our results displayed in Figure 3.
D.4 Analysis on GPT-UMLS-KG
| MIMIC-III | MIMIC-IV | |||||||
| KG | MT. | RA. | LOS | Drug. | MT. | RA. | LOS | Drug. |
| GPT-UMLS-KG (=3, =1) | 70.3 | 69.7 | 37.5 | 66.8 | 73.1 | 68.5 | 34.2 | 63.9 |
| GPT-UMLS-KG (=3, =2, =5) | ||||||||
Table 8 illustrates the impact of the two GPT-UMLS-KG variants on enhancing the performance of EHR predictions. It is evident that the performance significantly improves when , while the performance with sometimes even fails to surpass the baseline performance without any external knowledge (e.g. outperformed by RETAIN on MIMIC-III drug recommendation task), as we compare the performance to Table 2. Possible explanations for this outcome:
-
•
The constrained window size () increases the randomness of the triples sampled after the initial 1-hop, resulting in a proliferation of isolated nodes and the formation of isolated clusters. This situation poses a considerable challenge for the GraphCare model to effectively learn from the knowledge graph.
-
•
The increased randomness is very likely to exclude critical triples originating from a source node, leading to the propagation of irrelevant knowledge triples (noise) that ultimately detrimentally affect the model’s performance.
Therefore, developing a more effective method to sample more useful triples from existing KGs becomes one of our future works.
Appendix E “Patient As a Graph” and “Patient As a Node”
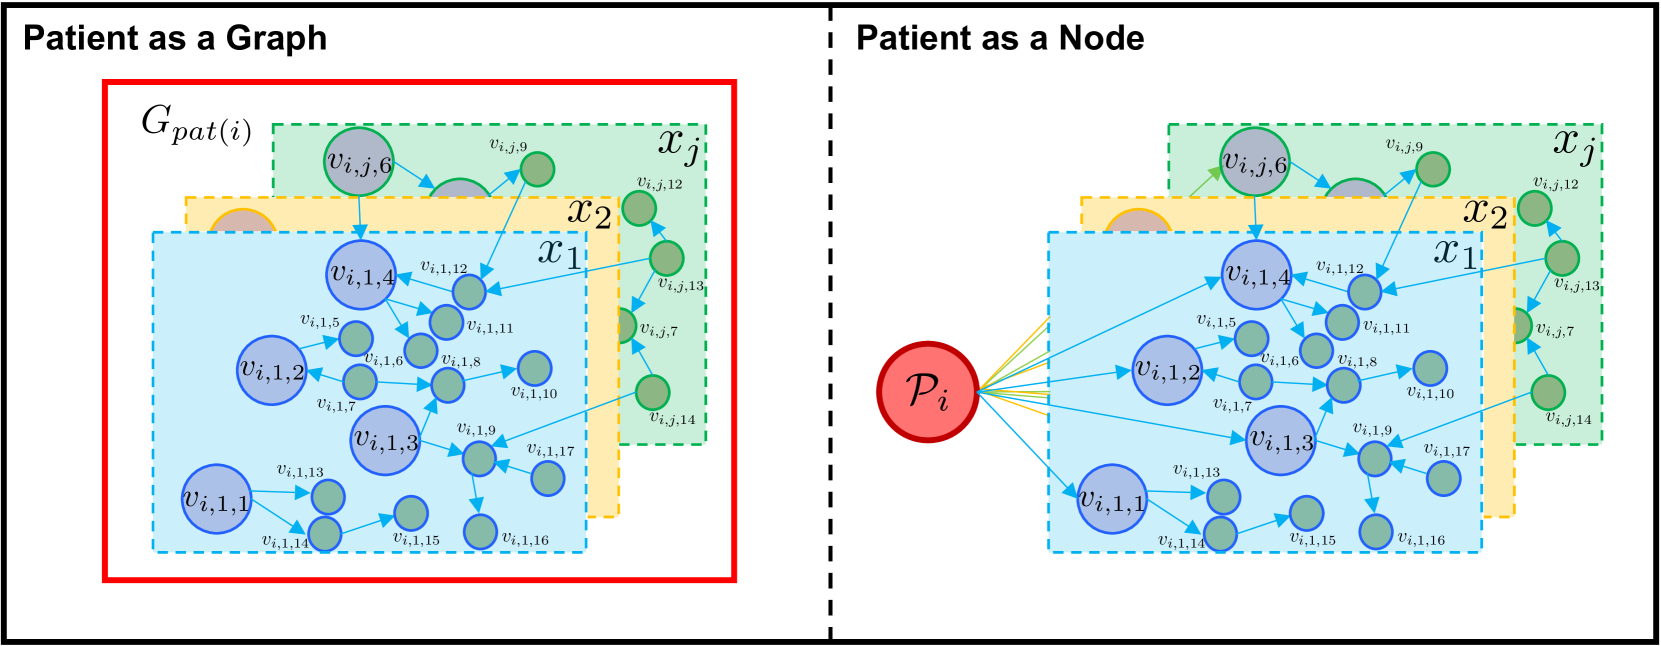
Figure 7 presents two different patient representations. When viewed as a graph, the patient representation aims to encapsulate a comprehensive summary of all nodes, thus providing a broad overview of information. However, this approach may also include more noise due to its extensive scope. In contrast, when a patient is represented as a node, the information is aggregated solely from directly corresponding EHR nodes. This approach ensures a precise match with the patient’s EHR data, offering a more accurate, albeit narrower, representation. Although this method provides a more focused insight, it also inevitably discards information from other nodes, thus potentially losing broader contextual data. Therefore, the choice between these two representations hinges on the balance between precision and the extent of information required. In our experiment, we introduce a joint embedding composed by concatenating those two embeddings, as a balanced solution.

E.1 Patient Representation Learning.
We further discuss the performance of different patient representations in GraphCare, as depicted in Figure 8. We calculate the average over 20 independent runs for each type of patient representation and for each task. Our observations reveal that the patient node embedding presents more stability as it is computed by averaging the direct EHR nodes. These nodes are rich in precise information, thereby reducing noise, but they offer limited global information across the graph. On the other hand, patient graph embedding consistently exhibits the most significant variance, with the largest distance observed between the maximum and minimum outliers. Despite capturing a broader scope of information, the graph embedding performs less effectively due to the increased noise. This is attributed to its derivation method that averages all node embeddings within a patient’s personalized KG, inherently incorporating a more diverse and complex set of information. The joint embedding operates as a balanced compromise between the node and graph embeddings. It allows GraphCare to learn from both local and global information. Despite the increased noise, the joint embedding provides an enriched context that improves the model’s understanding and prediction capabilities.
Appendix F Importance Score
To provide insights into the GraphCare’s decision-making process, we propose an interpretation method that computes the importance scores for the entities and relationships in the personalized knowledge graph. We first compute the entity importance scores as the sum of the product of node-level attention weights and visit-level attention weights (obtained by Eq (3.3)) over all visits, and relationship importance scores as the edge weights summed over all GNN layers:
| (6) |
where is the importance score of entity and is the importance score of the relationship between entities and . To identify the most crucial entities and relationships, we can also compute the top entities and relationships with the highest importance scores, denoted as in descending order of their importance:
| (7) |
where and are the -th highest importance scores for entities and relationships, respectively, and represent the top entities and relationships for patient , respectively. By analyzing the top entities and relationships, we can gain a better understanding of the model’s decision-making process and identify the most influential factors in its predictions.
Appendix G Hyper-parameter Tuning
Given that our GraphCare utilizes personalized knowledge graphs (KGs) as inputs for healthcare predictions, the representativeness of the constructed graphs becomes critical in the prediction process. The quality and structure of these KGs can significantly influence the performance of our predictive model, underlining the importance of thoroughly investigating the hyperparameters involved in their construction and subsequent analysis via the BAT GNN model. Therefore, we meticulously examine both the hyperparameters for KG node/edge clustering and those for our proposed BAT Graph Neural Network (GNN) model. We use GPT-KG as the external knowledge and use validation set of EHR data for a more efficient parameter searching.
G.1 Hyper-parameters for Clustering
| Threshold | # Cluster | Mortality | Readmission | ||
|---|---|---|---|---|---|
| AUPRC | AUROC | AUPRC | AUROC | ||
| 0.05 | 29681 | 12.2 | 61.3 | 65.5 | 63.5 |
| 0.1 | 14662 | 13.3 | 65.2 | 70.0 | 67.4 |
| 0.15 | 4599 | 15.7 | 69.6 | 72.6 | 68.9 |
| 0.2 | 883 | 13.9 | 67.8 | 67.8 | 66.7 |
| Threshold | # Cluster | LOS | Drug Rec. | ||
|---|---|---|---|---|---|
| F1-score | AUROC | F1-score | AUROC | ||
| 0.05 | 15094 | 32.8 | 77.4 | 62.1 | 94.2 |
| 0.1 | 7941 | 34.7 | 79.7 | 64.8 | 94.5 |
| 0.15 | 2755 | 36.6 | 80.2 | 65.2 | 95.1 |
| 0.2 | 589 | 34.1 | 77.9 | 63.8 | 94.3 |
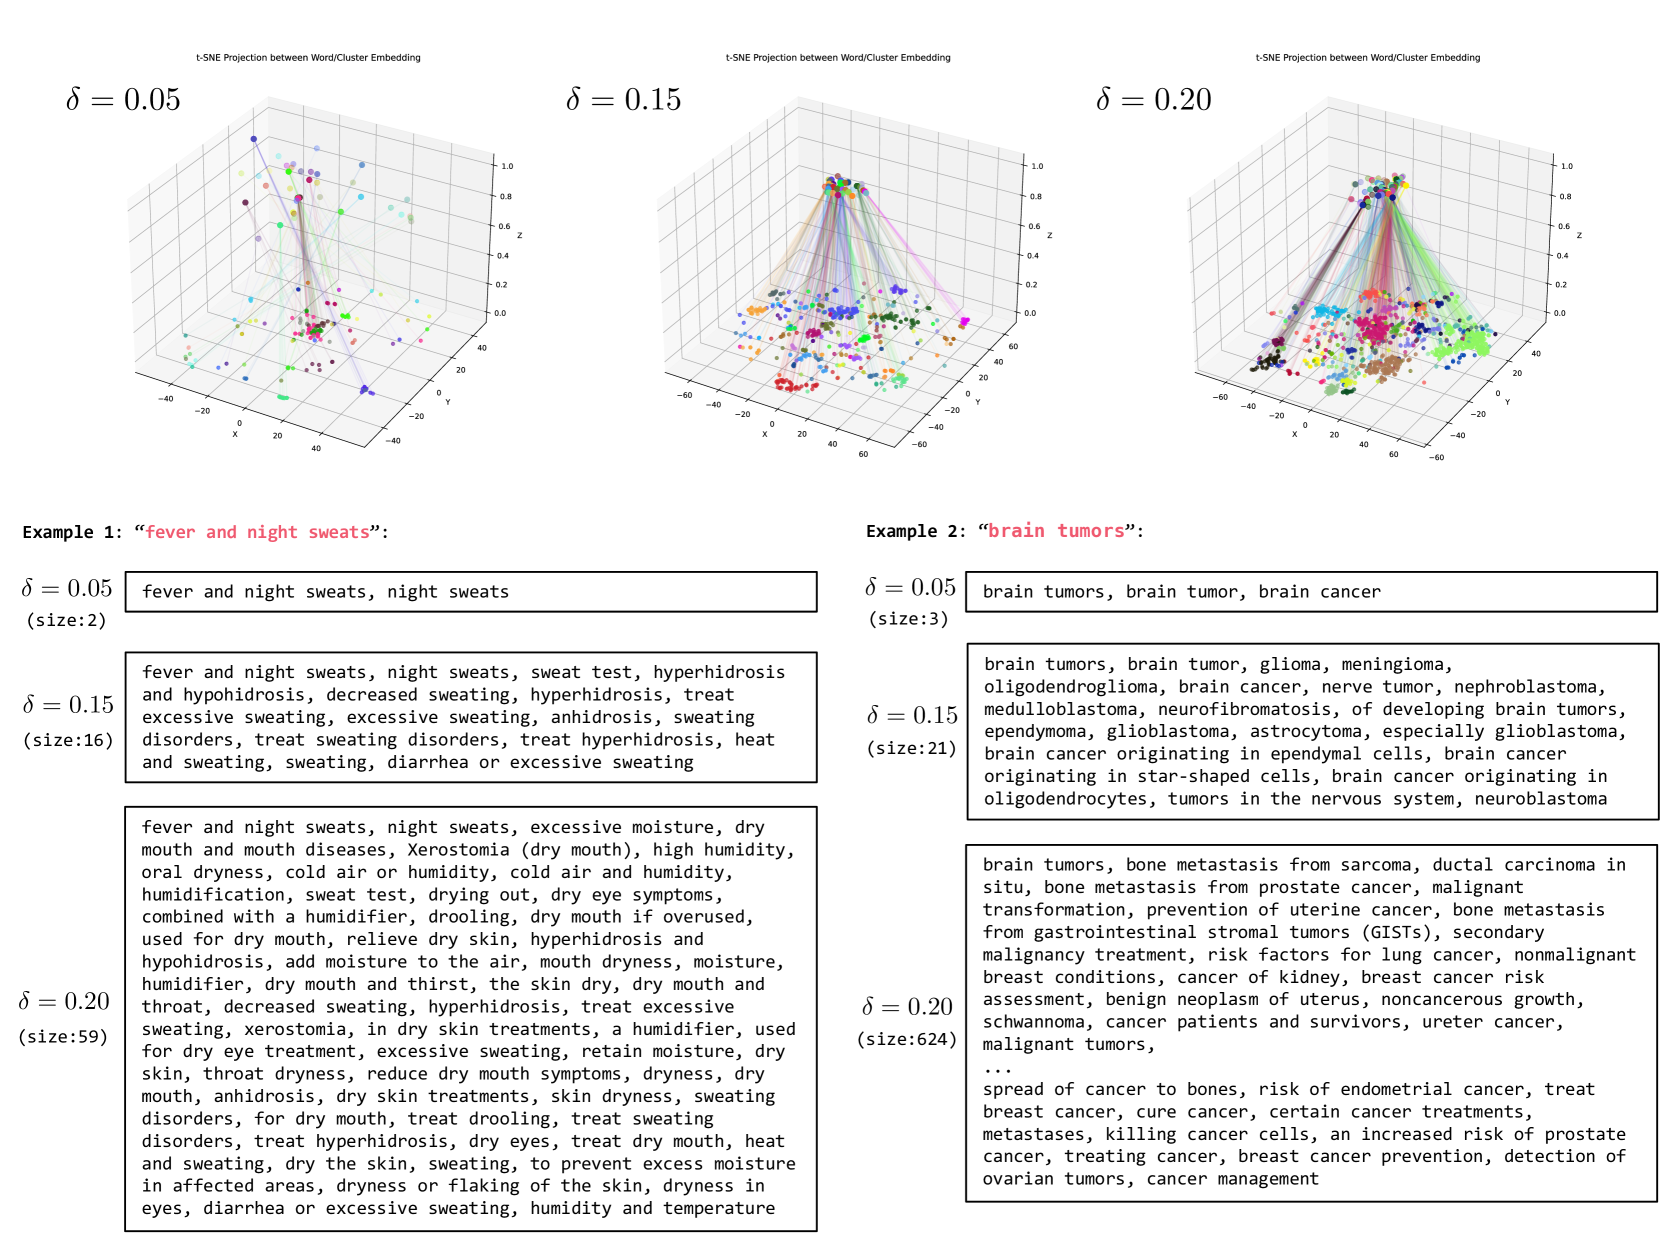
Table 9 presents the performance of GraphCare across four tasks on the MIMIC-III dataset, with varying agglomerative clustering distance thresholds . We evaluate the performance with the GPT-KG. The results reveal that the model achieves optimal performance when . This outcome can be attributed to the following reasons: when is small, nodes of high similarity may be incorrectly classified as distinct, complicating the learning process for the model. Conversely, if is large, dissimilar nodes could be inaccurately clustered together, which further challenges the training process. Examples in Figure 9 further demonstrate our findings.
The examples presented in Figure 9 illustrate the significant influence of the distance threshold on the semantic coherence of the clusters. When , the clusters tend to incorporate words that aren’t strongly semantically related to the given word. For instance, “humidity” is inappropriately grouped with “fever and night sweats”, and “breast cancer” is incorrectly associated with “brain tumors”. Conversely, when , the restrictive threshold fails to capture several words closely related to the given word, such as the absence of “heat and sweating” in the cluster for “fever and night sweats”, and “glioma” for “brain tumors”.
Striking an optimal balance, when , the resulting clusters exhibit a desirable semantic coherence. Most words within these clusters are meaningfully related to the given word. This observation underlines the importance of selecting an appropriate value to ensure the extraction of semantically consistent and comprehensive clusters. This is a pivotal step, as the quality of these clusters has a direct impact on subsequent healthcare prediction tasks, which rely on the KG constructed through this process.
G.2 Hyper-parameters for the Bi-attention GNN
| Task | Batch Size | Hidden Dimension | Learning Rate | Weight Decay | Decay Rate | Layers |
|---|---|---|---|---|---|---|
| Mortality | 4 | 128 | 1e-5 | 1e-5 | 0.01 | 1 |
| Readmission | 4 | 128 | 1e-5 | 1e-5 | 0.01 | 2 |
| Length-Of-Stay (LOS) | 4 | 128 | 1e-5 | 1e-5 | 0.03 | 2 |
| Drug Recommendation | 4 | 128 | 1e-5 | 1e-5 | 0.03 | 3 |
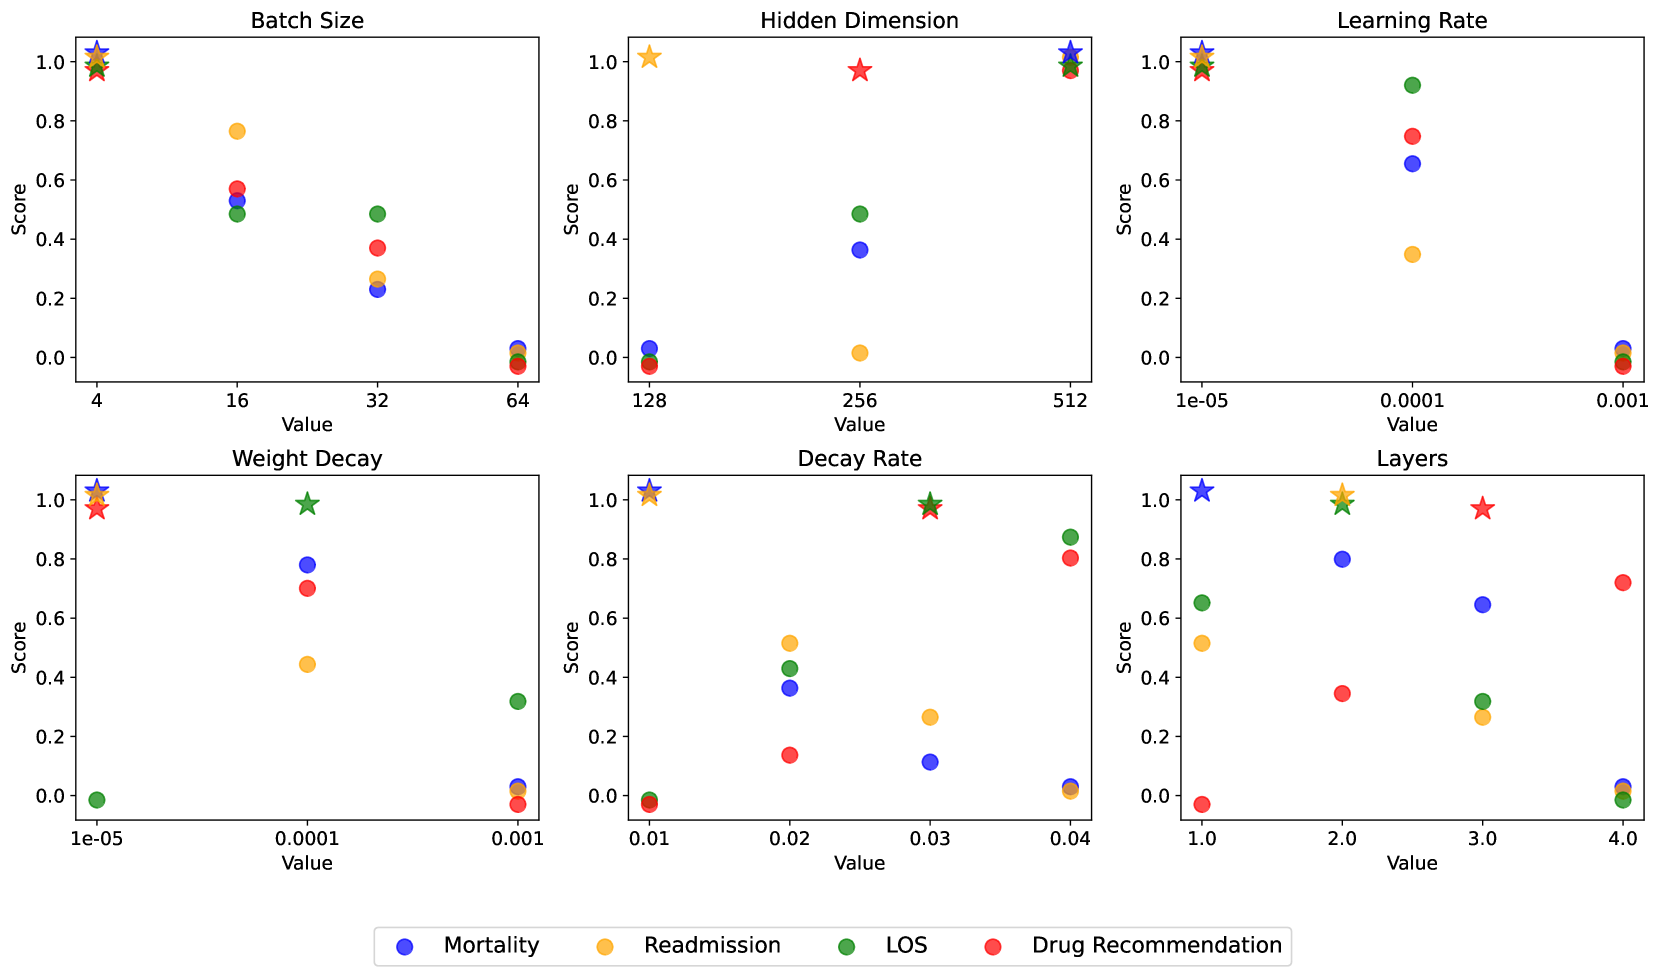
For our proposed BAT GNN we tune the following hyper-parameters: batch size in {4, 16, 32, 64}, hidden dimension in {128, 256, 512}, learning rate in {1e-3, 1e-4, 1e-5}, weight decay in {1e-3, 1e-4, 1e-5}, decay rate in {0.01, 0.02, 0.03, 0.04} and number of layers in {1, 2, 3, 4}. We show the tuning detail in Figure 10. The hyper-parameters employed throughout the experiments presented in this paper are consolidated and presented in Table 10. For the sake of maintaining a more fair and balanced comparison, we align the batch size, hidden dimension, learning rate, and weight decay with those of the baseline models.
Appendix H Notation Table
For clarity, we have attached a notation table here, describing all symbols used in the main paper.
| Notation | Description |
|---|---|
| Notations in Step 1 (§3.1) | |
| A medical concept in {conditions, procedures, drugs} | |
| Sizes of sets of medical concepts | |
| KG, nodes, and edges for each medical concept | |
| KG for each medical concept, obtained through prompting LLM times | |
| Nodes and edges in the KG obtained through prompting LLM times (Appendix D.1) | |
| -hop subgraph for a concept, obtained thourgh subgraph sampling (Appendix D.2) | |
| Nodes and edges in the -hop subgraph obtained thourgh subgraph sampling | |
| Clustering mappings for nodes and edges | |
| Distance threshold of cosine similarity | |
| Global graph composed by all concept-specific KGs, and its nodes and edges | |
| New global graph, nodes and edges after clustering | |
| Dimension of the word embedding | |
| (Initial) node and edge embeddings | |
| Notations in Step 2 (§3.2) | |
| Patient node | |
| Personalized KG for a patient | |
| Edge connecting patient node and the node of medical concepts in patient’s EHR | |
| Visit-subgraph for the -th visit of the patient | |
| The -th node in the -th visit of the patient | |
| The edge between the node and | |
| Interconnected edges across visit-subgraphs | |
| Notations in Step 3 (§3.3) | |
| Updated node representation of node at -th layer of GNN | |
| Activation function | |
| Learnable weight matrix at -th layer | |
| Function to aggregate node representations | |
| Bias vector at -th layer | |
| Neighbors of node | |
| Hidden embedding of -th node in -th visit-subgraph of patient | |
| Hidden embedding of edge between nodes and | |
| Learnable matrices in | |
| Learnable vectors in | |
| Input embeddings of the node and edge | |
| Size of the hidden embedding | |
| Node-level and visit-level attention weights | |
| Multi-hot vector and matrix for visit-subgraph and patient’s graph | |
| Learnable parameters for node-level attention and visit-level attention | |
| Bias vectors for node-level attention and visit-level attention | |
| Decay coefficient vector | |
| Decay rate | |
| Word embedding of a keyword for task-feature pair | |
| Computed weight for -th node in global graph | |
| Node embeddings of final layer for predictions | |
| Patient graph embedding | |
| Patient node embedding | |
| Binary label indicating direct medical concept | |
| , , | Logits from different embeddings after MLP |