Image-Pointcloud Fusion based Anomaly Detection using PD-REAL Dataset
Abstract
We present PD-REAL, a novel large-scale dataset for unsupervised anomaly detection (AD) in the 3D domain. It is motivated by the fact that 2D-only representations in the AD task may fail to capture the geometric structures of anomalies due to uncertainty in lighting conditions or shooting angles. PD-REAL consists entirely of Play-Doh models for 15 object categories and focuses on the analysis of potential benefits from 3D information in a controlled environment. Specifically, objects are first created with six types of anomalies, such as dent, crack, or perforation, and then photographed under different lighting conditions to mimic real-world inspection scenarios. To demonstrate the usefulness of 3D information, we use a commercially available RealSense camera to capture RGB and depth images. Compared to the existing 3D dataset for AD tasks, the data acquisition of PD-REAL is significantly cheaper, easily scalable and easier to control variables. Extensive evaluations with state-of-the-art AD algorithms on our dataset demonstrate the benefits as well as challenges of using 3D information. Our dataset can be downloaded from https://github.com/Andy-cs008/PD-REAL
keywords:
Anomaly Detection, Surface Inspection, Depth Image[label1]organization=University of Fukui,city=Fukui city, state=Fukui, country=Japan
[label2]organization=Niigata University,city=Nishi City, state=Niigata, country=Japan
1 Introduction
Anomaly detection (AD), which plays a vital role in various research fields, such as industrial inspection [1, 2, 3, 4, 5] and medical image processing [6, 7, 8], has received increasing attention recently. It aims to accurately detect and segment the anomalies in samples for visual surface inspection. So far, because of the clear visibility and localization of anomaly patterns in real-world applications, the development of AD techniques has progressed mainly for 2D representations of data images.
One of the key challenges of AD for images arises from the fact that 2D representations can easily encounter bottlenecks in capturing complete geometric structures. Fig. 1 illustrates an example of this problem. It is usually the case that the acquired image (Fig. 1(a)) does not provide a clear visual indication of the anomaly locations. Due to the intrinsic color and reflected light of the object, the appearance of the target may vary significantly from different shooting angles. This problem can be exacerbated by the varying scene lighting conditions and the potential over/under exposure during acquisition.
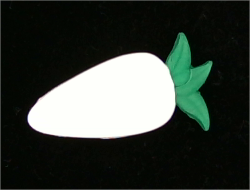
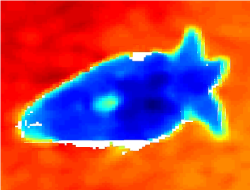
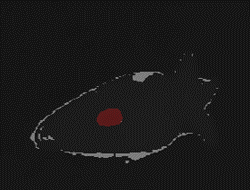
Compared to 2D image, 3D data generally provides a more powerful and comprehensive presentation for the real world [9, 10, 11, 12, 13, 14]. Therefore, a straightforward solution to the above challenge would be to use 3D data representations in combination with 2D images. For example, the subtle anomaly in Fig. 1(a) can be clearly observed using a 3D point cloud (Fig. 1(b)). In view of this, we argue that explicitly exploiting 3D information for AD tasks is more reasonable. However, due to the lack of suitable datasets, AD for the 3D domain has been sparsely explored to date. To the best of our knowledge, MVTEC 3D [15] and Eyecandies [16] constitute the only two exceptions which enable 3D AD. For MVTEC 3D, it involves the usage of highly expensive industrial sensors for data acquisition. It should be noted that in real-world AD applications, more samples may be frequently and extensively required to meet the increasing industrial demands, and such a costly manner of data acquisition and storage may hinder dataset expansion. As for Eyecandies, all the data is collected in a virtual environment to simulate large defect variations. However, virtual anomalies still show inherent difference to the real-world ones, which can cause the issue of domain bias and reflect poorly the real geometric features.
Motivated by the above analysis, we present a novel dataset PD-REAL for unsupervised AD in the 3D domain. All of the samples in PD-REAL are handmade with Play-Doh. In particular, we first make 15 object categories by referring to the guide, such as Play-Doh molds. Then, to mimic the inspection scenarios in practice, we manually create six types of anomalies. The Intel RealSense Depth Camera D405 (RealSense 405) is used for data acquisition. It is elevated and placed statically above the object to record RGB and depth images per object from the same angle. We then produce the whole 3D information (i.e., point cloud) for each object using the corresponding image pair with the camera intrinsics. For each category, we provide training, validation, and testing set, respectively. In total, PD-REAL contains more than 3,500 RGB and depth image pairs. Moreover, because of the editable nature of Play-Doh, it is far less burdensome to expand and adjust the shape of the objects to include more different types of anomalies as needed. To fully assess PD-REAL, we train state-of-the-art AD techniques on it and experimentally discuss the influence of exploiting the 3D information on AD.
In summary, this paper consists of the following main contributions:
-
1.
We propose a novel large-scale 3D AD dataset PD-REAL with Play-Doh made samples. It covers 15 object categories and 6 anomaly types recorded under multiple scene illumination.
-
2.
We propose an efficient sample collection pipeline with the use of Real-sense for data recording, which is significantly more low-cost and easy-extendable compared with those of other 3D AD dataset.
-
3.
We compare and analyze the performance of state-of-the-art AD techniques on our dataset and demonstrate the challenge and significance of using 3D information for AD.
2 Related Work
In this section, we review previous literature on AD datasets and approaches. We first review 2D, and then review 3D AD datasets. Next, we review 2D, and finally give a detailed introduction to 3D AD approaches.
2.1 2D anomaly detection datasets
The majority of existing AD datasets are created for 2D images. MVTEC AD [17] is a well-known example that is the first AD dataset with pixel-level ground-truth annotations. It contains 5,354 high-resolution color images, including five texture and ten object categories, with over 70 different types involved. Other datasets are also introduced for different AD tasks. The Shanghai Tech Campus dataset [18] is created for anomalous event detection based on the videos clips collected by surveillance cameras for non-industrial AD applications. The dataset proposed by Huang et al. [19] aims at detecting surface defects specifically for magnetic tiles. The NanoTWICE dataset [20] includes high-resolution images for Nanofibrous materials. However, the sample number in it is too limited to support deep learning algorithms. DAGM [21] is a dataset for textured surface defect detection. The dataset includes images of various surfaces with artificially generated defects. [22] proposed a public fabric dataset for defect detection. The dataset contains 245 images, including seven types of fabric. More recently, [23] has proposed a novel dataset-Visual Anomaly (VisA) for both 1- and 2-class AD tasks, which contains 10821 high-resolution color images covering the objects ranging from printed circuit boards to macaronis to meet various industrial needs.
2.2 3D anomaly detetion datasets
It is worth mentioning that 3D AD approaches [24, 25, 26] have not been actively studied to date, mainly because of the lack of appropriate datasets. To the best of our knowledge, MVTEC 3D-AD [15] and Eyecandies [16] are the only two existing datasets for 3D AD and localization with color information. MVTEC 3D-AD [15] contains 4,147 high-precision 3D point clouds distributed across ten classes of samples collected from real-world objects. Also, it covers 41 defect types with 2,656 normal samples for training as well as 249 and 948 normal and anomalous samples in the test set, respectively. All of the data is collected using an expensive industrial camera, the Zivid One Medium. [16] proposed a synthetic 3D dataset, called Eyecandies, for unsupervised multimodal AD and localization. The dataset contains 90000 photo-realistic shots of synthetic objects fabricated in virtual space, including 10 categories of candies, cookies, and sweets. For each sample, the dataset also contains six renderings with different lighting settings, as well as ground-truth depth and normal maps, aiming to encourage the exploration of approaches for 3D AD. However, there is still a domain gap between real and virtual defect appearance, which limits the generality of it in handling real-world AD tasks. By contrast, data in PD-REAL is collected from real objects. In addition, it is worth mentioning that PD-REAL is collected using Real-Sense and Play-Doh, which significantly reduces the cost of data collection and allows us to easily update and expand PD-REAL due to the malleability of Play-Doh.
2.3 Anomaly detection for 2D
Benefiting from the rich resouces of 2D AD dataset, mainstream AD approaches has primarily focused on the 2D domain [3, 27, 28, 29, 30, 31, 32]. PatchCore [3] is a pioneering 2D AD method, which leverages a memory bank to store patch-level normal sample features to facilitate distinguishing anomalous features. [31] adopted a knowledge distillation scheme by exploring the discrepancy of intermediate teacher-student behaviors for AD. Different from the unsupervised settings of [3, 31], [32] proposed an end-to-end semi-supervised framework that uses a multi-scale feature fusion model to fuse the memory information with the features of input images for better anomaly localization. All these methods are designed for 2D AD tasks. Due to the lack of depth information, 2D representations cannot accurately express the features of objects. Since these methods are designed for 2D images, directly applying them to 3D scenarios would fail to capture the unordered and nosier 3D representations.
2.4 Anomaly detection for 3D
To the best of our knowledge, AD for 3D data has been explored sparsely to date. 3D AD can be divided to two categories: (a) AD for surface defect; (b) AD for general object. For (a), [26] first introduced a teacher-student-based framework, in which the teacher network is pretrained by reconstructing local receptive fields to conduct 3D AD. The anomaly score of this framework is obtained by computing the regression error. [33] proposed an asymmetric student-teacher network to avoid unnecessary generalization during knowledge distillation. In addition, a bijectiv normalizing flow is used to improve teacher-student network. In [34], the features of 3D point cloud are extracted using Fast Point Feature Histograms (FPFH). The features of RGB images are extracted by using WideResNet50 [35] pretrained on the ImageNet dataset. Then, these features are fed together into PathCore. [36] proposed a multimodal framework with hybrid feature fusion, which achieves interaction between multimodal features by using patch-wise contrastive loss. [37] introduced the attention mechanism into multimodal 3D industrial AD to integrate the image features well. The other types of 3D AD method (i.e., (b)) aims to identify whether the input 3D representation follows the user specified normal/anomalous object category. [38] adopted a composite layer as convolutional operator to deal with the spatial information of points for (b). [25] proposed a Variational Auto-encoder-based AD approach to handle the general objects AD by examining the reconstruction error. However, the reconstruction-based method often requires a large number of training samples for decent reconstruction accuracy and incurs high computational overhead. To overcome this limitation, [24] proposed a teacher-student network that allows only few normal samples for (b). The transfer of knowledge from the teacher network to the student network is achieved by using a multi-scale loss to facilitate the student network to learn more accurate sample features for detection.
3 PD-REAL
3.1 Data description
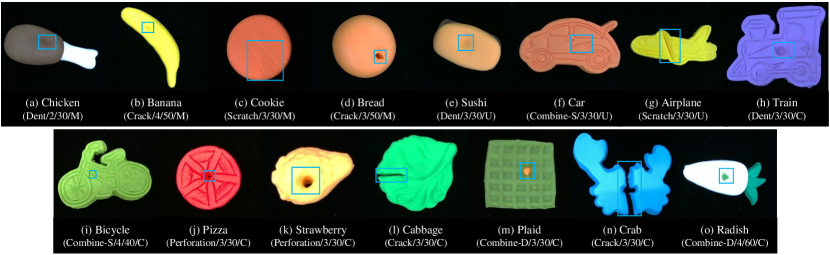
PD-REAL consists of over 3,500 high-resolution () RGB images and the corresponding depth images and point clouds. Fig. 2 illustrates some example RGB image samples per category of PD-REAL. The details of the PD-REAL samples are described below:
Categories. PD-REAL contains 15 object categories, which can be grouped as: Food (chicken, cookie, bread, sushi, pizza), Vegetables (cabbage, radish), Fruits (banana, strawberry), and Toys (car, airplane, train, bicycle, plaid, crab).
Images. For each sample, we record two images: RGB and depth images. The image pair is then utilized to generate the corresponding 3D point cloud.
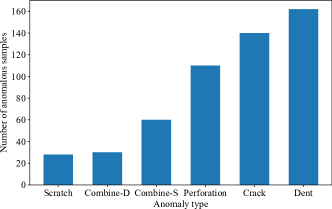
Sample distribution. For each category, we provide a training, validation, and test set, respectively. To fully address the task of unsupervised AD, only normal samples are included in the training and validation sets. The test sets contain both normal and anomalous samples. The anomalous samples are manually created with six types of anomalies: dent, crack, perforation, scratch, combine-S, and combine-D. Specifically, for combine-S and combine-D, we combine a foreign object with the same or different colors to the original sample. Please refer to Fig. 3 for a detailed statistical distribution of the anomalous samples.
Lighting conditions. We set three types of scene lighting conditions during shooting: controlled light (C), uncontrolled light (U), and mixed light (M). Each category follows one of these lighting conditions. Specifically, for C, we shoot the samples under an indoor configuration with a fixed position light source, while for U, we expose the samples outdoors to allow multiple illumination from arbitrary angles. M denotes a mixture of U and C for recording.
3.2 Data collection
Previous 3D datasets [15] for AD depend on industry-level sensors for data collection. Although this allows a higher image resolution, it can cause the extension of the dataset to be highly expensive. To provide a practical solution to 3D collection, we design an efficient recording pipeline that enables easy extension. Specifically, we use the RealSense D405111https://www.intelrealsense.com/depth-camera-d405/ to collect all the data. This is a short-range stereo camera with sub-millimetre accuracy that can capture the RGB and depth images simultaneously. We elevate it so that it can capture the whole object from above. Before shooting, we use a leveller to ensure that the background of the object is parallel to the camera plane to reduce the depth error.
Sample generation. In PD-REAL, all samples are handmade with Play-Doh. Contrary to the conceptual simpleness, it leads to great flexibility in easily constructing diverse types of objects due to the scalable nature of Play-Doh.
Anomaly annotation. For each anomalous sample, we manually annotate the pixel-wise anomalous region for ground truth, using LabelMe 222http://labelme.csail.mit.edu/Release3.0/.
Point cloud generation. Given the acquired RGB and depth image pair, we generate the corresponding point cloud to represent the full 3D information. To bridge the gap between the two coordinate systems of the pixel and the world, we relate any pixel located at in to its 3D coordinate using the following transformation:
| (1) |

where is the z-axis value of the camera coordinates, i.e. the distance from the object to the camera. is the focal length of the camera, and are the length and width of an image element. are coordinates of the origin of the image coordinate system under the pixel coordinate system. are the rotation matrix and the translation matrix of the external reference matrix. Since the camera coordinate system is identical to the world coordinate system, the depth of an object is shared in both systems (i.e., ). Thus, and can be simplified as an identity matrix and a zero matrix, respectively. The world coordinates for the point cloud can then be solved using Eq. 1.
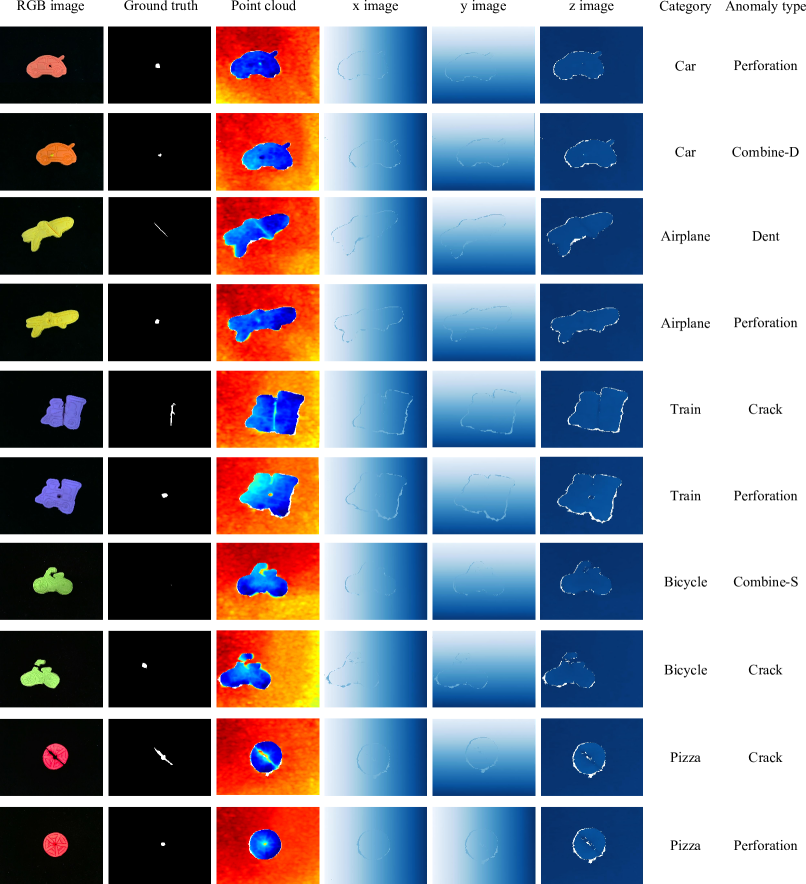
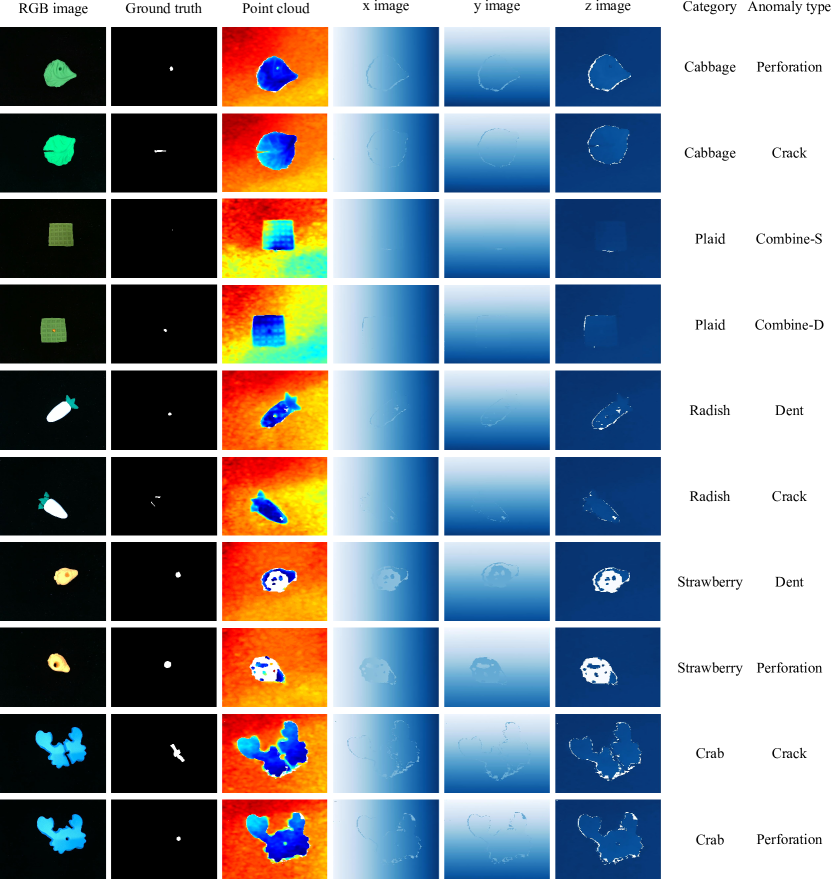
More visualizations of our dataset are depicted in Fig. 4 6. For each category, we show the visual representations of two example anomalous samples. In Fig. 4 6, we present the RGB image, pixel-level ground-truth anomaly mask, and the 3D point cloud in three columns on the left. The other three columns on the right visualize the 3D coordinates encoding of objects along x, y, z-axis.
4 Experiments
4.1 Evaluation methods and metrics
Evaluation methods. We evaluate two state-of-the-art 3D AD techniques: AST [33] and M3DM [36] on our dataset for assessment. AST [33] utilizes an asymmetric teacher-student network with a bijective normalizing flow-based teacher architecture to mitigate the over-generalization in distillation. M3DM [36] performs unsupervised hybrid feature fusion on multimodal data for 3D AD. We train AST and M3DM on our datasets following the provides parameter settings. We also carefully tune the parameters during data preprocessing in background removal such that the object area can be fully retained to facilitate model learning.
Besides the above two 3D AD techniques, we further train a state-of-the-art 2D AD method PatchCore [3] on our dataset and provide analysis. In particular, we follow [34] by adopting three PatchCore variants: RGB iNET, Depth iNET, and RGB+FPFH. For RGB iNET and Depth iNET, we train PatchCore only on RGB and Depth images, respectively. For RGB+FPFH, we first use Fast Point Feature Histograms (FPFH) [39] to extract features from the 3D point cloud. These features are then concatenated with RGB images to feed into PatchCore for further learning. Note that the image features for PatchCore are obtained by using WideResNet50 [35] pre-trained on the ImageNet dataset [40] for all three scenarios. For all of the above PatchCore-based methods, the input point cloud and color images are down-sampled with nearest-neighbor interpolation and bicubic interpolation, respectively, following [34]. The depth map directly utilizes the z channel of point cloud.
Evaluation metrics. Following [15, 17], we adopt the per-region overlap (PRO) metric to report the pixel-level AD (i.e., anomaly localization) performance. Given the anomaly score produced by the algorithms, we binarize it according to a predetermined threshold to obtain the final prediction . The PRO can then be computed by measuring the average component-wise relative overlap with the ground truth:
| (2) |
where is the total number of ground truth components and is the th ground truth. By increasingly varying until an average per pixel false positive rate of 30% is reached for the entire dataset (as suggested in [15]), we plot the PRO curve and integrate the area under such a curve to measure the final PRO value (AUPRO). We also use the area under the receiver operating characteristic curve (AUROC) [41] to measure the accuracy of anomaly detection at the image level. The receiver operation characteristic (ROC) curve reflects the performance of the binary classification model under various thresholds. The AUROC then computes the whole area under ROC curve, and a larger AUROC indicates a higher image-level detection performance.
| Method | Chicken | Banana | Cookie | Bread | Sushi | Car | Airplane | Train |
|---|---|---|---|---|---|---|---|---|
| RGB iNet | 0.927 | 0.943 | 0.743 | 0.981 | 0.980 | 0.886 | 0.945 | 0.954 |
| Depth iNet | 0.687 | 0.791 | 0.805 | 0.882 | 0.886 | 0.507 | 0.568 | 0.554 |
| RGB+FPFH | 0.954 | 0.943 | 0.868 | 0.979 | 0.983 | 0.876 | 0.959 | 0.981 |
| M3DM [36] | 0.951 | 0.959 | 0.912 | 0.973 | 0.982 | 0.972 | 0.967 | 0.863 |
| AST [33] | 0.978 | 0.983 | 0.910 | 0.975 | 0.960 | 0.962 | 0.968 | 0.945 |
| Method | Bicycle | Pizza | Strawberry | Cabbage | Pliad | Crab | Radish | Mean |
| RGB iNet | 0.966 | 0.826 | 0.974 | 0.975 | 0.942 | 0.961 | 0.794 | 0.920 |
| Depth iNet | 0.707 | 0.699 | 0.922 | 0.828 | 0.453 | 0.609 | 0.878 | 0.719 |
| RGB+FPFH | 0.946 | 0.975 | 0.971 | 0.980 | 0.920 | 0.967 | 0.947 | 0.950 |
| M3DM [36] | 0.961 | 0.978 | 0.930 | 0.945 | 0.976 | 0.983 | 0.980 | 0.955 |
| AST [33] | 0.980 | 0.980 | 0.967 | 0.958 | 0.943 | 0.922 | 0.939 | 0.958 |
| Method | Chicken | Banana | Cookie | Bread | Sushi | Car | Airplane | Train |
|---|---|---|---|---|---|---|---|---|
| RGB iNet | 0.653 | 0.884 | 0.615 | 0.997 | 1.000 | 0.942 | 1.000 | 0.995 |
| Depth iNet | 0.433 | 0.458 | 0.717 | 0.241 | 0.585 | 0.605 | 0.845 | 0.863 |
| RGB+FPFH | 0.953 | 0.823 | 0.643 | 0.916 | 1.000 | 0.828 | 0.982 | 0.982 |
| M3DM [36] | 0.992 | 0.646 | 0.871 | 0.543 | 0.947 | 0.892 | 0.585 | 0.390 |
| AST [33] | 1.000 | 0.973 | 0.870 | 0.853 | 0.880 | 0.930 | 1.000 | 0.967 |
| Method | Bicycle | Pizza | Strawberry | Cabbage | Plaid | Crab | Radish | Mean |
| RGB iNet | 1.000 | 0.995 | 1.000 | 1.000 | 0.855 | 1.000 | 0.937 | 0.925 |
| Depth iNet | 0.742 | 0.813 | 0.722 | 0.635 | 0.363 | 0.672 | 0.706 | 0.627 |
| RGB+FPFH | 0.941 | 1.000 | 0.903 | 0.930 | 0.743 | 0.992 | 0.922 | 0.904 |
| M3DM [36] | 0.850 | 0.990 | 0.668 | 0.793 | 0.795 | 0.850 | 0.982 | 0.786 |
| AST [33] | 0.990 | 1.000 | 0.998 | 0.875 | 0.996 | 0.748 | 0.908 | 0.933 |
| Method | Dent | Crack | Perforation | Scratch | Combine-S | Combine-D |
|---|---|---|---|---|---|---|
| RGB iNET | 0.946 | 0.979 | 0.982 | 0.719 | 0.968 | 0.983 |
| Depth iNET | 0.626 | 0.835 | 0.863 | 0.726 | 0.560 | 0.751 |
| RGB+FPFH | 0.976 | 0.981 | 0.984 | 0.853 | 0.932 | 0.983 |
| M3DM [36] | 0.975 | 0.978 | 0.984 | 0.758 | 0.965 | 0.984 |
| AST [33] | 0.955 | 0.965 | 0.974 | 0.904 | 0.853 | 0.981 |
| Method | Dent | Crack | Perforation | Scratch | Combine-S | Combine-D |
|---|---|---|---|---|---|---|
| RGB iNET | 0.958 | 0.991 | 1.000 | 0.471 | 0.848 | 1.000 |
| Depth iNET | 0.543 | 0.721 | 0.800 | 0.457 | 0.483 | 0.570 |
| RGB+FPFH | 0.951 | 0.959 | 0.986 | 0.535 | 0.675 | 0.993 |
| M3DM [36] | 0.749 | 0.837 | 0.952 | 0.662 | 0.702 | 1.000 |
| AST [33] | 0.916 | 0.922 | 0.997 | 0.637 | 0.681 | 1.000 |
4.2 Result
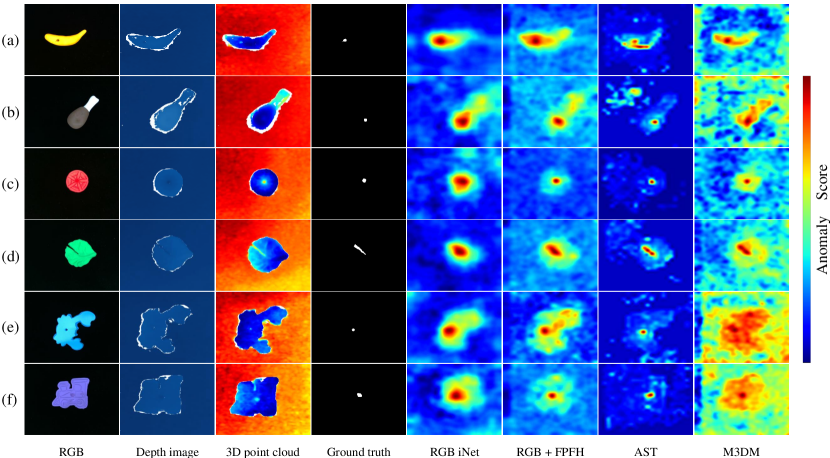
Category-wise AD performance. First, we report the anomaly localization performance per category. It can be seen in Tab. 1 that images alone are not sufficient for AD algorithms to segment the anomalous regions well, and a mixture of information with image and 3D point cloud generally contributes to the best localization. We also show visual inspections in Fig. 7. We can see that despite the comparable detection performance in Fig. 7(a), the false positives increase drastically as long as the 2D image does not clearly indicate the anomalies (Fig. 7(b,c)). In addition, for PatchCore-based methods, although using the RGB information performs better than RGB+FPFH for image-wise AD (Tab. 2, 24, 810). However, we notice that for some categories (e.g., chicken) with a large proportion of visually subtle anomalies, such as a dent, 3D information would still be required to improve the detection performance. From the above analysis, we can validate the importance of using 3D information for AD tasks. For [36] and [33], we can see that both methods perform well on pixel-wise AD (AUPRO). Particularly, [33] not only achieves higher segmentation accuracy, but also significantly reduces the false positive rates (7th column in Fig 7). The reason can be assumed that the asymmetric teacher-student network well mitigates the unexpected generalization in knowledge distillation. However, it can also be observed in Tab. 2 that both methods [36, 33] have space for improvement regarding image-wise AD (AUROC), especially for [36]. Based on our experiments, we argue that it is still challenging for state-of-the-art 3D AD methods to achieve promising results on our proposed dataset.
Anomaly type-wise AD performance. Next, we examine the performance of AD by anomaly type to gain more insight into PD-REAL. We notice that naively including additional 3D information does not necessarily have a positive influence for all anomaly types. For example, for the anomaly type scratch, both detection and localization are significantly improved by using 3D and RGB (5th column in Tab. 3 and 4). This is because the samples with the scratch defect are mostly too flat for RGB alone to detect and localize well. In contrast, for combine-S, since the combined foreign part to the original sample is tiny, the 3D information in such a case is more like noise, thus hindering the overall image-level detection performance (6th column in Tab. 3). We can then confirm that state-of-the-art AD methods still have a lot of room in handling 3D information appropriately for AD, which further evidences the challenge of PD-REAL.
5 Conclusion
In this paper, we have proposed a novel Play-Doh made dataset PD-REAL for unsupervised 3D anomaly detection, which provides over 3,500 high-precision RGB images and corresponding depth information with six types of anomalies and 15 object categories. Compared to previous 3D AD datasets, our data collection pipeline is substantially cheaper, easy to conduct, and easily expandable. Furthermore, we investigate the performance of state-of-the-art AD techniques on PD-REAL, and demonstrate the importance and challenge of using 3D information for AD for different object categories and anomaly types. We hope that our dataset can further stimulate the exploration of better solutions to 3D AD in the future.
6 Acknowledgements
This work is supported by JSPS KAKENHI Grant Number JP20K19568. We also acknowledge China Scholarship Council (CSC) for funding the first author under Grant Number 202108330097.
References
- [1] D. Gudovskiy, S. Ishizaka, K. Kozuka, Cflow-ad: Real-time unsupervised anomaly detection with localization via conditional normalizing flows, in: Proceedings of the IEEE/CVF Winter Conference on Applications of Computer Vision, 2022, pp. 98–107.
- [2] P. Bergmann, M. Fauser, D. Sattlegger, C. Steger, Uninformed students: Student-teacher anomaly detection with discriminative latent embeddings, in: Proceedings of the IEEE/CVF Conference on Computer Vision and Pattern Recognition, 2020, pp. 4183–4192.
- [3] K. Roth, L. Pemula, J. Zepeda, B. Schölkopf, T. Brox, P. Gehler, Towards total recall in industrial anomaly detection, in: Proceedings of the IEEE/CVF Conference on Computer Vision and Pattern Recognition, 2022, pp. 14318–14328.
- [4] G. Wang, S. Han, E. Ding, D. Huang, Student-teacher feature pyramid matching for anomaly detection, in: The British Machine Vision Conference (BMVC), 2021.
- [5] H. Wang, W. Yue, S. Wen, X. Xu, H.-D. Haasis, M. Su, P. Liu, S. Zhang, P. Du, An improved bearing fault detection strategy based on artificial bee colony algorithm, CAAI Transactions on Intelligence Technology 7 (4) (2022) 570–581.
- [6] Y. Cai, H. Chen, X. Yang, Y. Zhou, K.-T. Cheng, Dual-distribution discrepancy with self-supervised refinement for anomaly detection in medical images, Medical Image Analysis 86 (2023) 102794.
- [7] Y. Jia, H. Wang, W. Chen, Y. Wang, B. Yang, An attention-based cascade r-cnn model for sternum fracture detection in x-ray images, CAAI Transactions on Intelligence Technology 7 (4) (2022) 658–670.
- [8] T. Schlegl, P. Seeböck, S. M. Waldstein, G. Langs, U. Schmidt-Erfurth, f-anogan: Fast unsupervised anomaly detection with generative adversarial networks, Medical image analysis 54 (2019) 30–44.
- [9] B. Saleh, A. Farhadi, A. Elgammal, Object-centric anomaly detection by attribute-based reasoning, in: Proceedings of the IEEE conference on computer vision and pattern recognition, 2013, pp. 787–794.
- [10] A. X. Chang, T. Funkhouser, L. Guibas, P. Hanrahan, Q. Huang, Z. Li, S. Savarese, M. Savva, S. Song, H. Su, et al., Shapenet: An information-rich 3d model repository, arXiv preprint arXiv:1512.03012 (2015).
- [11] I. Armeni, O. Sener, A. R. Zamir, H. Jiang, I. Brilakis, M. Fischer, S. Savarese, 3d semantic parsing of large-scale indoor spaces, in: Proceedings of the IEEE conference on computer vision and pattern recognition, 2016, pp. 1534–1543.
- [12] K. Yadav, R. Ramrakhya, S. K. Ramakrishnan, T. Gervet, J. Turner, A. Gokaslan, N. Maestre, A. X. Chang, D. Batra, M. Savva, et al., Habitat-matterport 3d semantics dataset, in: Proceedings of the IEEE/CVF Conference on Computer Vision and Pattern Recognition, 2023, pp. 4927–4936.
- [13] X. Huang, X. Cheng, Q. Geng, B. Cao, D. Zhou, P. Wang, Y. Lin, R. Yang, The apolloscape dataset for autonomous driving, in: Proceedings of the IEEE conference on computer vision and pattern recognition workshops, 2018, pp. 954–960.
- [14] P. Xiao, Z. Shao, S. Hao, Z. Zhang, X. Chai, J. Jiao, Z. Li, J. Wu, K. Sun, K. Jiang, et al., Pandaset: Advanced sensor suite dataset for autonomous driving, in: 2021 IEEE International Intelligent Transportation Systems Conference (ITSC), IEEE, 2021, pp. 3095–3101.
- [15] P. Bergmann, X. Jin, D. Sattlegger, C. Steger, The mvtec 3d-ad dataset for unsupervised 3d anomaly detection and localization, arXiv preprint arXiv:2112.09045 (2021).
- [16] L. Bonfiglioli, M. Toschi, D. Silvestri, N. Fioraio, D. De Gregorio, The eyecandies dataset for unsupervised multimodal anomaly detection and localization, in: Proceedings of the Asian Conference on Computer Vision, 2022, pp. 3586–3602.
- [17] P. Bergmann, M. Fauser, D. Sattlegger, C. Steger, Mvtec ad–a comprehensive real-world dataset for unsupervised anomaly detection, in: Proceedings of the IEEE/CVF conference on computer vision and pattern recognition, 2019, pp. 9592–9600.
- [18] W. Liu, W. Luo, D. Lian, S. Gao, Future frame prediction for anomaly detection–a new baseline, in: Proceedings of the IEEE conference on computer vision and pattern recognition, 2018, pp. 6536–6545.
- [19] Y. Huang, C. Qiu, K. Yuan, Surface defect saliency of magnetic tile, The Visual Computer 36 (1) (2020) 85–96.
- [20] D. Carrera, F. Manganini, G. Boracchi, E. Lanzarone, Defect detection in sem images of nanofibrous materials, IEEE Transactions on Industrial Informatics 13 (2) (2016) 551–561.
- [21] M. Wieler, T. Hahn, Weakly supervised learning for industrial optical inspection, in: DAGM symposium in, Vol. 6, 2007.
- [22] J. Silvestre-Blanes, T. Albero-Albero, I. Miralles, R. Pérez-Llorens, J. Moreno, A public fabric database for defect detection methods and results, Autex Research Journal 19 (4) (2019) 363–374.
- [23] Y. Zou, J. Jeong, L. Pemula, D. Zhang, O. Dabeer, Spot-the-difference self-supervised pre-training for anomaly detection and segmentation, in: European Conference on Computer Vision, Springer, 2022, pp. 392–408.
- [24] J. Qin, C. Gu, J. Yu, C. Zhang, Teacher–student network for 3d point cloud anomaly detection with few normal samples, Expert Systems with Applications 228 (2023) 120371.
- [25] M. Masuda, R. Hachiuma, R. Fujii, H. Saito, Y. Sekikawa, Toward unsupervised 3d point cloud anomaly detection using variational autoencoder, in: 2021 IEEE International Conference on Image Processing (ICIP), IEEE, 2021, pp. 3118–3122.
- [26] P. Bergmann, D. Sattlegger, Anomaly detection in 3d point clouds using deep geometric descriptors, in: Proceedings of the IEEE/CVF Winter Conference on Applications of Computer Vision, 2023, pp. 2613–2623.
- [27] X. Cai, R. Xiao, Z. Zeng, P. Gong, Y. Ni, Itran: A novel transformer-based approach for industrial anomaly detection and localization, Engineering Applications of Artificial Intelligence 125 (2023) 106677.
- [28] T. H. Wan, C. W. Tsang, K. Hui, E. Chung, Anomaly detection of train wheels utilizing short-time fourier transform and unsupervised learning algorithms, Engineering Applications of Artificial Intelligence 122 (2023) 106037.
- [29] N. Cohen, Y. Hoshen, Sub-image anomaly detection with deep pyramid correspondences, arXiv preprint arXiv:2005.02357 (2020).
- [30] T. Defard, A. Setkov, A. Loesch, R. Audigier, Padim: a patch distribution modeling framework for anomaly detection and localization, in: International Conference on Pattern Recognition, Springer, 2021, pp. 475–489.
- [31] M. Salehi, N. Sadjadi, S. Baselizadeh, M. H. Rohban, H. R. Rabiee, Multiresolution knowledge distillation for anomaly detection, in: Proceedings of the IEEE/CVF conference on computer vision and pattern recognition, 2021, pp. 14902–14912.
- [32] M. Yang, P. Wu, H. Feng, Memseg: A semi-supervised method for image surface defect detection using differences and commonalities, Engineering Applications of Artificial Intelligence 119 (2023) 105835.
- [33] M. Rudolph, T. Wehrbein, B. Rosenhahn, B. Wandt, Asymmetric student-teacher networks for industrial anomaly detection, in: Proceedings of the IEEE/CVF Winter Conference on Applications of Computer Vision, 2023, pp. 2592–2602.
- [34] E. Horwitz, Y. Hoshen, An empirical investigation of 3d anomaly detection and segmentation, arXiv preprint arXiv:2203.05550 (2022).
- [35] S. Zagoruyko, N. Komodakis, Wide residual networks, arXiv preprint arXiv:1605.07146 (2016).
- [36] Y. Wang, J. Peng, J. Zhang, R. Yi, Y. Wang, C. Wang, Multimodal industrial anomaly detection via hybrid fusion, in: Proceedings of the IEEE/CVF Conference on Computer Vision and Pattern Recognition, 2023, pp. 8032–8041.
- [37] R. Chen, G. Xie, J. Liu, J. Wang, Z. Luo, J. Wang, F. Zheng, Easynet: An easy network for 3d industrial anomaly detection, arXiv preprint arXiv:2307.13925 (2023).
- [38] A. Floris, L. Frittoli, D. Carrera, G. Boracchi, Composite layers for deep anomaly detection on 3d point clouds, arXiv preprint arXiv:2209.11796 (2022).
- [39] R. B. Rusu, N. Blodow, M. Beetz, Fast point feature histograms (fpfh) for 3d registration, in: 2009 IEEE international conference on robotics and automation, IEEE, 2009, pp. 3212–3217.
- [40] J. Deng, W. Dong, R. Socher, L.-J. Li, K. Li, L. Fei-Fei, Imagenet: A large-scale hierarchical image database, in: 2009 IEEE conference on computer vision and pattern recognition, Ieee, 2009, pp. 248–255.
- [41] A. P. Bradley, The use of the area under the roc curve in the evaluation of machine learning algorithms, Pattern recognition 30 (7) (1997) 1145–1159.