Visualization Generation with Large Language Models: An Evaluation
Abstract
Analysts frequently need to create visualizations in the data analysis process to obtain and communicate insights. To reduce the burden of creating visualizations, previous research has developed various approaches for analysts to create visualizations from natural language queries. Recent studies have demonstrated the capabilities of large language models in natural language understanding and code generation tasks. The abilities imply the potential of using large language models to generate visualization specifications from natural language queries. In this paper, we evaluate the capability of a large language model to generate visualization specifications on the task of natural language to visualization (NL2VIS). More specifically, we have opted for GPT-3.5 and Vega-Lite to represent large language models and visualization specifications respectively. The evaluation is conducted on the nvBench dataset. In the evaluation, we utilize both zero-shot and few-shot prompt strategies. The results demonstrate that GPT-3.5 surpasses previous NL2VIS approaches. Additionally, the performance of few-shot prompts is higher than that of zero-shot prompts. We discuss the limitations of GPT-3.5 on NL2VIS, such as misunderstanding the data attributes and grammar errors in generated specifications. We also summarized several directions, such as correcting the ground truth and reducing the ambiguities in natural language queries, to improve the NL2VIS benchmark.
Index Terms:
Visualization generation, large language model, evaluation, declarative grammar1 Introduction
Data visualization is vital in data analysis to help find patterns and communicate insights [1]. However, creating visualizations requires knowledge of visualization design principles and skills of visualization authoring tools [2, 3]. One significant direction to make analysts concentrate on the data analysis itself is automating the data visualization creation based on users’ natural language queries. Therefore, a surge of visualization-oriented natural language interfaces emerged, allowing data analysts to create visualizations simply by merely using natural language and promoting data analysis efficiency..
The development of the natural language processing (NLP) technique continuously improves the applicability of the natural language to visualization (NL2VIS) approach. Many studies about NL2VIS are based on the libraries of natural language processing, such as Articulate [4] using the Stanford Parser [5], DeepEye [6] using OpenNLP [7], and NL4DV [8] using CoreNLP [9]. They either have constraints on user inputs or cannot understand complex natural language queries [10]. Researchers further train neural networks using deep-learning-based approaches [11, 12] to process complex natural languages. However, a single deep-learning-based approach cannot perform well on various tasks.
Recently, an increasing number of large language models (LLMs, e.g., GPT-3.5 [13]) have been developed [14]. LLMs possess a remarkable capability to comprehend natural languages and generate high-quality responses in user-defined formats or programming codes. They have demonstrated outstanding proficiency in various generative tasks, encompassing code generation [15], reasoning [16], and mathematics [17]. Moreover, many research studies have evaluated the capabilities of LLMs from different aspects with various prompt strategies like Chain of Thoughts [18], Program of Thoughts [19], and Least to Most [20]. Therefore, it is also feasible to leverage LLMs to realize NL2VIS tasks, and several LLM-based systems have been developed, such as Chat2VIS [21] and LIDA [22], which generate Python code to construct data visualizations. Maddigan et al. [23] conduct an evaluation to verify the capability of the Chat2VIS system on the NL2VIS task.
Along with Python, domain-specific languages in JSON formats are now widely used for specifying visualizations in various applications [24]. Furthermore, the existing studies [23] have not evaluated the impact of different prompt construction strategies on the NL2VIS task. Despite the substantial progress made in LLMs and LLM-based NL2VIS approaches, assessing the capacity of LLMs using different prompt strategies in visualization generation is a critical requirement. More specifically, evaluating LLMs for NL2VIS tasks is a fundamental step that informs their practical utility, drives improvements, and ensures responsible and informed deployment in various applications.
In this paper, we conduct an evaluation to validate the capability of LLMs for the NL2VIS task. We select the popular Vega-Lite visualization grammar [25] as the generative target. We first summarize existing prompt strategies and select zero-shot and few-shot strategies, which are suitable for the NL2VIS task to design prompts. The prompts consist of three main components: the role definitions instructing LLMs, the sampled data table demonstrating the schema, and the query describing users’ tasks, including expected chart types and data attributes to be visualized. For the zero-shot prompt, we design several static rules to instruct LLMs to revise errors we find in the preliminary evaluation and generate correct Vega-Lite specifications. For the few-shot prompt, we add several examples to demonstrate the high-quality Vega-Lite specifications for different chart types. Each example consists of a query and its corresponding specification. We select GPT-3.5 as the representative of LLMs to conduct the evaluation. In the evaluation, we use the nvBench dataset [26] as the benchmark and examine the performances of zero-shot and few-shot prompt strategies, respectively. For the evaluation results, we compute the matching accuracy of visualization results between the ground truth in nvBench and the outputs of GPT-3.5. We take the matching accuracy as the metric and verify the potential of LLMs on the NL2VIS task.
The evaluation results demonstrate that the performance of the GPT-3.5 model surpasses existing studies in the Vega-Lite generation task with few-shot prompts. In addition, the performance of few-shot prompts is significantly higher than that of zero-shot prompts. We also categorize and discuss the limitations of GPT-3.5 and the questions in the existing benchmark itself as our findings. First, GPT-3.5 still cannot fully master the Vega-Lite grammar, and some outputs violate the grammar and make mistakes. In addition, GPT-3.5 generates incorrect results compared with ground truths because it cannot fully understand the meaning of attributes in the data table. Second, several cases need to be correct in the existing benchmark. More specifically, the visualization results of some cases do not conform to the task description, and the textual queries of some cases have ambiguities. The limitations in both aspects can negatively impact the performance of LLMs in the NL2VIS task, which we attempt to promote in future work.
In summary, this paper has the following contributions:
-
•
We evaluate the capability of LLMs for the NL2VIS task based on vega-lite specifications using various prompt strategies. The evaluation results on LLMs based on NVBench reveal that GPT-3.5 has a powerful capability for generating Vega-Lite specifications.
-
•
Our evaluation results on LLMs demonstrate the insights and directions for improving the NL2VIS benchmark.
2 Related Work
We review the literature on natural language to visualization and large language model capability evaluation to motivate our research.
2.1 Natural Language to Visualization
This section reviews the existing studies about NL2VIS, classifying them into rule-based and neural network-based categories. Since this work is to evaluate the LLM capability for the NL2VIS task, we differentiate the LLM-based algorithms as the third category.
Rule-based methods. The NL2VIS studies in the early stage always adopt rule-based algorithms to realize natural language comprehension and users’ intent extraction. Cox et al. [27] propose a prototypical framework to use a natural language interface to generate data visualizations automatically. However, the prototype system they developed exerts limitations on the queries and can only generate data tables and bar charts. Articulate [4] and DataTone [28] use the Stanford Parser library [5] to analyze the natural language query and convert it to appropriate visualizations. In particular, DataTone adds a customized widget to tackle the ambiguity that exists in the natural language query compared with Articulate. Eviza [29] adopts an ANTLR parser [30], strengthens the expressiveness of queries and can support users in interacting with data visualizations through natural languages. DeepEye [6] uses OpenNLP [7] to parse an underspecified query consisting of keywords and rank multiple candidate visualizations to be selected. FlowSense [31] utilizes SEMPRE [32] and CoreNLP [9] to realize semantic parsing and allows users to leverage the advantages of dataflow visualization systems for data analysis by natural language interactions. NL4DV [8] also adopts CoreNLP [9] to extract data attributes from the input query and decide the predefined tasks according to the query, and is interface-agnostic compared with previous approaches. Although rule-based algorithms are relatively easy to apply, they have constraints on the natural language inputs or cannot comprehend complex queries. Thus, their performances are surpassed by subsequent neural network-based techniques.
Neural network-based methods. As deep learning techniques develop and are widely applied in NLP, the visualization community starts to explore neural network-based approaches. Liu et al. propose ADVISor [11], a deep-learning-based approach combined with pre-defined rules to generate visualizations for tabular data. After inputting a data table plus a natural language query, users can obtain a visualization chart with annotations highlighting what users care about. Luo et al. [26] propose a synthesizer to utilize large-scale NL2SQL benchmarks available to synthesize new NL2VIS benchmarks, named nvBench, to promote the advancement of this field. This benchmark contains about 25,000 (NL, VIS) pairs and covers over a hundred domains, and its overall high quality is verified through expert and crowdsourcing evaluation. They adopt the nvBench benchmark to train a new seq2seq model ncNet [12], which inputs natural language queries and datasets and outputs a Vega-Lite specification. The ncNet can also accept an optional chart template input to allow users to state the expected chart type explicitly. Song et al. [33] are inspired by the code development process and dialogue systems and propose RGVisNet, which is a fusion of retrieval-based and generation-based methodologies. The experiments show that the performance of RGVisNet surpasses previous NL2VIS approaches. Chen et al. [34] combine the program synthesis and the BERT-based [35] NLP technique to generate visualizations from natural language queries and make a corresponding system Graphy. Their evaluation using the NLVCorpus [36] dataset shows that the performance of their approach is better than previous rule-based and transformer-based approaches.
LLM-based methods. With the recent emergence of LLMs, some studies have attempted to utilize LLMs for NL2VIS. Maddigan et al. [21] leverage LLMs to generate Python code to visualize data. They develop the Chat2VIS system to enable users to input a dataset and their analysis intentions through natural language, then the system converts queries to an appropriate prompt containing data table descriptions and queries in natural language and finally gives a desired chart rendered by generated Python code. Furthermore, they improve their Chat2VIS system with advanced features [23]. Then, the Chat2VIS system can take multilingual natural language as input and allows users to iteratively refine their visualizations based on LLM’s ability to understand long conversations. LIDA [22] defines automated visualization generation as a four-stage task. It combines LLMs and image generation models to resolve datasets and analysis goals and can generate both charts and infographics. The researcher introduces two metrics to evaluate the generated visualization: visualization error rate and self-evaluated visualization quality. Wang et al. [37] propose the Data Formulator, a system allowing users to input natural languages or instances to implement complex data transformation with the help of LLMs. With this paradigm, users can be freed from complex and time-consuming data processing. Wang et al. [38] leverage ChatGPT for the visualization recommendation to reduce the burden of collecting large training data. Their approach can additionally generate human-level explanations for the recommended visualizations, and experiments show the performance is better than or at least similar to previous approaches like Decision Tree. Ko et al. [39] collect a real-world Vega-Lite corpus and propose an LLM-based framework to automatically generate natural language datasets that have rich syntactic diversity and strong semantic relevance with original charts, therefore contributing to the advancement of NL4VIS.
The NL2VIS task based on LLMs has recently attracted attention. Current research predominantly centers on LLM-based methods for Python code generation, leaving a void in exploring visualization generation techniques grounded in declarative grammar. Moreover, there needs to be more investigation into the efficiency of various prompt strategies for visualization generation. Within the context of LLMs, there is a conspicuous absence of a performance baseline. We aim to address these gaps and enhance the comprehension of these aspects.
2.2 Large Language Model Capability Evaluation
LLMs have recently showcased remarkable capabilities across a spectrum of natural language processing tasks. However, the quantitative performance of LLMs in different specific tasks is unclear, which may be unbeneficial for users to take advantage of LLMs. Assessing these models’ actual quality, capabilities, and limitations is necessary to assist users in utilizing LLMs more effectively. Previous studies have systematically evaluated the capabilities of LLMs from different perspectives, such as code generation, reasoning, and mathematics, but there are still gaps to be filled in the visualization task.
Code generation. Converting natural language to code usually includes automatic code generation, translation, code completion. The generated code needs to meet multiple standards, such as functional requirements, grammatical correctness, and coding style, making the evaluation a complex task. Hendrycks et al. [15] introduce APPS, a new code generation benchmark to systematically evaluate the capability of LLMs to generate Python code directly from natural language specifications. Moreover, Cassano et al. [40] build the first multilingual code generation benchmark, MultiPL-E, providing significant experience for understanding and improving multilingual language model models in code generation tasks. Furthermore, Liu et al. [41] propose a framework to expand the evaluation dataset. The framework uses a generator to obtain a considerable test set to cover different code paths and edge cases, thereby rigorously evaluating the accuracy of LLM-generated code. Based on the benchmark, Ding et al. [42] present a static code-completion evaluation framework. It analyzes the errors made by pre-trained LLMs on a real-world Python evaluation set and identifies common static errors and the trends of their occurrence frequency.
Reasoning. The reasoning task is an essential challenge for LLMs. This type of task requires the model to not only understand the meaning of the question but also infer logically and causally to generate responses with a logical structure and correct answers. Liu et al. [16] evaluate the logical reasoning capabilities of two language models developed by OpenAI, ChatGPT and GPT-4, finding that GPT-4 performs better than ChatGPT on most benchmarks, but its performance drops on logical reasoning natural language inference tasks. Fu et al. [43] introduce an open-source evaluation for measuring LLMs’ inference performance. The current results indicate that the model size and inference capability are generally related, showing an approximately log-linear trend. Xu et al. [44] comprehensively evaluate the logical reasoning capability of LLMs by selecting datasets with different reasoning forms, multiple representative LLMs, different sample settings, refined evaluation indicators, and different error types, finally showing a refined overall evaluation framework.
Mathematics. Evaluating the mathematical capabilities of LLMs is an important task that requires specific datasets of mathematical problems, including algebra, geometry, probability, and statistics. The mathematical reasoning capability usually requires models to have a deep understanding of mathematical concepts rather than just pattern matching. Therefore, the evaluation of mathematical reasoning capability is comprehensive and challenging. On the one hand, many studies have built various datasets for evaluating the capabilities of LLMs. Wei et al. [45] build a new Chinese mathematics textual dataset CMATH, for evaluating the arithmetic and reasoning capabilities of LLMs. Yuan et al. [17] propose an arithmetic dataset called MATH 401, which focuses on evaluating the arithmetic capability of LLMs. Frieder et al. [46] construct a new natural language mathematics dataset to test different dimensions of LLMs in mathematical understanding based on a series of fine-grained performance metrics. On the other hand, some studies develop frameworks for evaluation. Wu et al. [47] propose a dialogue framework for chat-based LLMs, which can easily integrate different prompt strategies and tools, allowing the model to solve mathematical problems through dialogue with user agents. Collins et al. [48] have designed a light-weight interactive evaluation platform to evaluate the capability of LLMs in assisting mathematical theorem proving. Dao et al. [49] examine the overall accuracy of ChatGPT in Vietnamese college entrance examination mathematics questions and specifically analyze the performance on different difficulty levels and question types, clearly revealing the strengths and weaknesses of ChatGPT.
Visualization. Evaluating the capabilities of LLMs on the visualization generation task is crucial because the evaluation results assist users in understanding LLMs’ performance and guide further improvements and optimizations. Maddigan et al. [23] quantitatively evaluate the performance of the proposed Chat2VIS system [21] using the nvBench [26] and NLVCorpus [36] datasets, and the results show their system has a comparable performance against previous NL2VIS approaches. However, Chat2VIS outputs Python codes, which is not the mainstream approach for visualization creation. Moreover, they have not fully optimized their prompts with various existing strategies and the performance cannot present the true potential of LLMs in the NL2VIS task. In this paper, we investigate existing prompt strategies and leverage the strategies suitable for our NL2VIS task to construct different high-quality prompts. We select Vega-Lite [25], which is a popular approach for visualization creation in the visualization community, and evaluate the performances of LLMs using few-shot and zero-shot prompts to explore the potential of LLMs in the NL2VIS task fully.
In summary, while extensive studies have been carried out on evaluating LLMs, a notable gap still exists in the comprehensive examination of the visualization construction task. This work aims to evaluate the performance of the NL2VIS task from the declarative grammar aspect and establish a foundation for enhancing the efficiency of LLM-based visualization generation.
3 Prompts Design
In this section, we first summarize the prompt strategies and analyze whether a strategy is suitable for the NL2VIS task. Then, we introduce the evaluated prompts and the iterative process of these prompts.
3.1 Prompt Strategies
A prompt strategy involves crafting effective prompts or instructions to interact with LLMs, aiming to elicit the desired response or information from the model. Reasonable design and selection of prompts can enable task customization, control model output, prevent misunderstandings, and save resources.
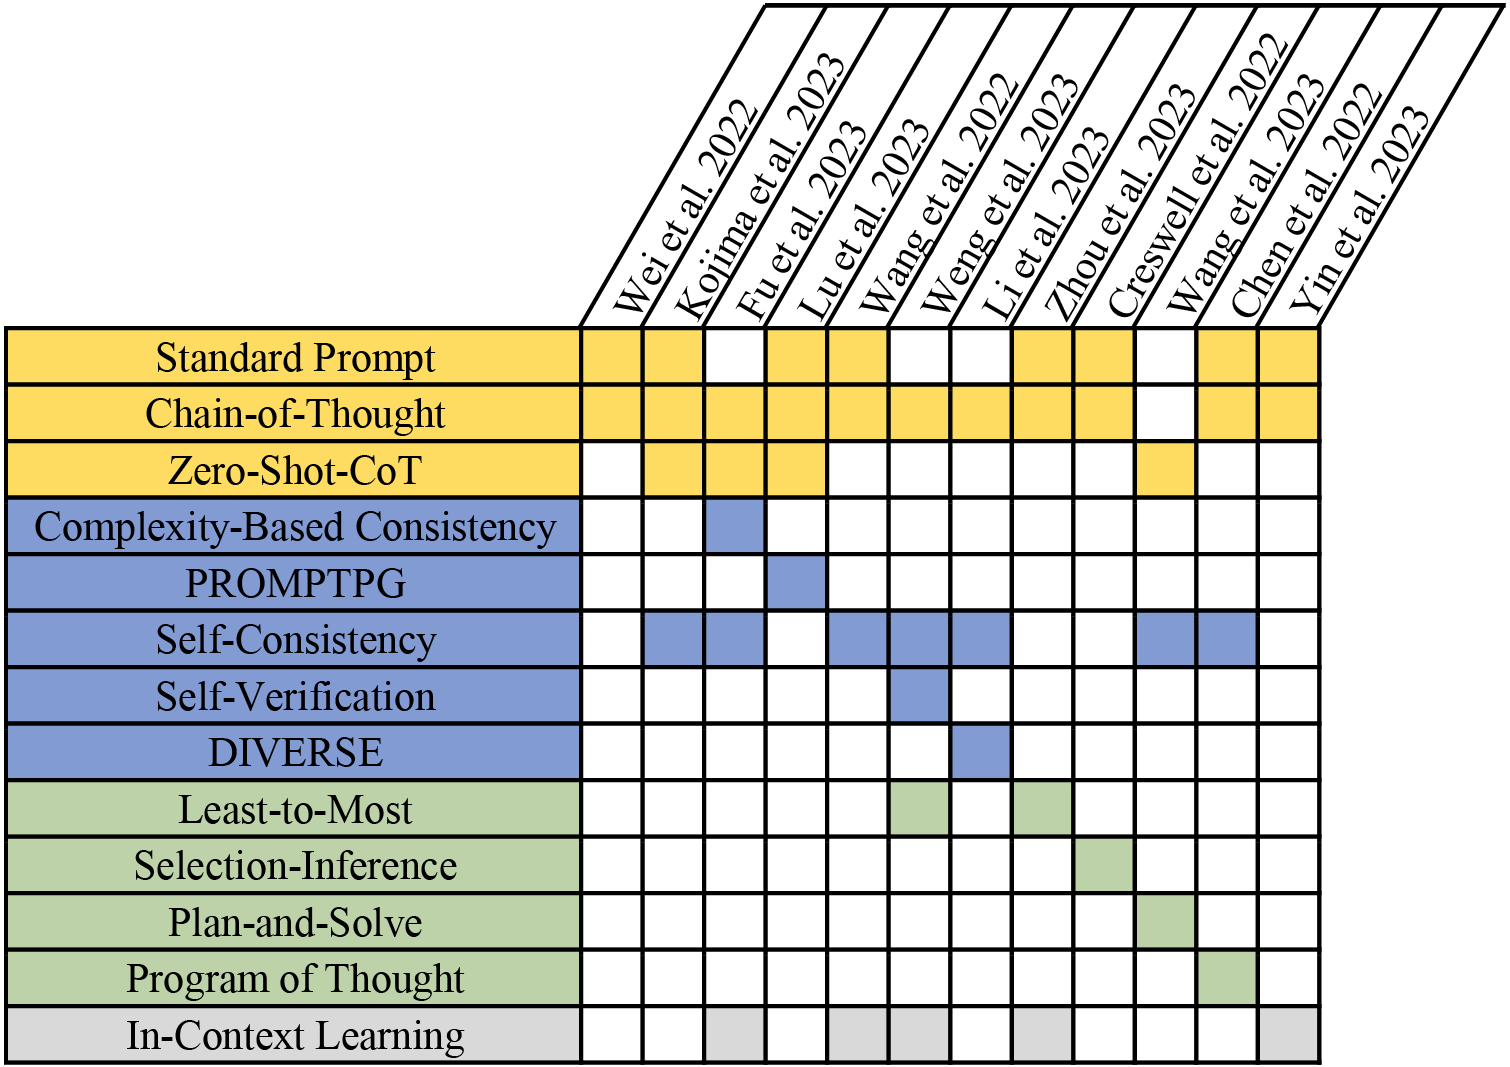
This section divides the commonly used prompt technologies that promote LLMs reasoning for specific tasks or settings into four categories (see Fig. 1) and then analyzes whether each category is suitable for visualization generation tasks. It is worth emphasizing that different prompt strategies can be combined, and multi-stage prompting processes can be integrated, but does not always need to be.
3.1.1 Chain-of-Thought and Its Variant
In standard prompting, LLMs are always asked to solve intricate multi-step problems in a singular step, while the human cognitive methodology involves tackling complex reasoning problems incrementally. Therefore, Wei et al. [18] introduce the Chain-of-Thought (CoT) methodology, which integrates multiple reasoning path steps before generating the ultimate answer. In this way, LLMs can also show the reasoning process when answering, leading to more accurate and explainable results.
Using a few-shot approach, CoT requires a specific manual cost to design prompts. Kojima et al. [50] demonstrate that LLMs can serve as zero-shot reasoners by simply appending the prompt “Let’s think step by step” before each response. We also explore some step-by-step prompting strategies in the preliminary study and find that they have no significant improvements in performance. Therefore, we add several rules about the Vega-Lite grammar to construct zero-shot prompts instead.
3.1.2 Rationale Engineering
The original CoT prompt relies on artificially crafted examples of intermediate reasoning steps and uses greedy decoding to generate a coherent reasoning process. On the contrary, rationale engineering aims to utilize LLM’s reasoning capabilities more effectively in the following three ways.
Rationale refinement refers to providing models with more examples of intermediate steps or optimizing the structure and expression of these examples. Fu et al. [51] propose complexity-based consistency, suggesting that prompts with higher reasoning complexity have higher performance on multi-step reasoning tasks. Lu et al. [52] propose PROMPTPG, employing policy gradient to strategically select in-context examples from a subset of training datasets and then construct corresponding prompts for the selected ones. We specifically select diverse examples in the few-shot prompt, covering all categories of charts in various difficulty levels, to improve the performance of LLMs.
Rationale exploration aims to select the best reasoning chain by discovering more potential reasoning paths. Wang et al. [53] propose self-consistency decoding strategy to perform majority voting among multiple inference paths to obtain the final answer. However, the intermediate results of the NL2VIS task in this work are Vega-Lite specifications, with a single visualization image potentially corresponding to multiple Vega-Lite specifications. Measuring the similarity between Vega-Lite codes is challenging, making the rationale exploration approach not applicable in our work.
Rationale verification can be introduced to verify the validity and rationality of the reasoning steps after generating the reasoning chain. Weng et al. [54] propose a self-verification to enable LLMs with the capability of verifying answers. A similar prompt ensembling strategy includes DIVERSE [55], a reasoning step validator to filter out incorrect answers and independently verify each inference step. We do not adopt the rationale verification strategy because LLMs can only output results in textual form when evaluations and the validity and correctness of a Vega-Lite specification cannot be verified without the corresponding visualization image.
3.1.3 Problem Decomposition
Complex tasks often require systematic analysis and solutions. Decomposing a complex problem into smaller, more solvable sub-problems is a common strategy that helps prevent LLMs from being confused by the sheer size of the problem. Problem decomposition strategies can be divided into two types.
Decomposition in the processing order generally involves two steps: breaking the problem into sub-problems and solving each sub-problem in a specific sequence. According to the defined sequence, the answers to previously solved sub-problems can facilitate the resolution of the next one. Based on this idea, Zhou et al. [20] present Least-to-Most prompting, which deconstructs a complex problem into a sequence of multiple sub-problems, and solutions to previous sub-problems are used as prompts to address the subsequent ones. Creswell et al. [56] introduce a Selection-Inference framework, which splits each reasoning step into selection and inference, thereby alternating between them to generate a series of explainable and arbitrary reasoning steps, ultimately leading to the final answer. Wang et al. [57] propose Plan-and-Solve prompting, wherein an initial plan is formulated to systematically break down the overarching task into more manageable sub-tasks, subsequently executing them by the devised plan. However, it is essential to note that the visualization specification generation task often cannot be decomposed into sequential steps as the queries are typically executed in a single step. Consequently, the sequential decomposition approaches are not suitable for our work.
Decomposition by task type refers to decoupling the entire problem into independent sub-problems, each corresponding to a specific task, the outcomes of which are then aggregated to form the final result. Chen et al. [19] introduce the Program of Thoughts Prompting (PoT), utilizing LLMs pre-trained with codes to script programs, thus decoupling computations from reasoning tasks. The Vega-Lite generated in our evaluation implements the data transformation and visual mappings in a single specification. Therefore, decomposing by the task type is not applicable to our work.
3.1.4 In-Context Learning
In-context Learning (ICL) can improve the predictive performance of LLMs by enhancing contextual information through task-relevant examples or instructions. For the ICL prompting strategies, the LLM receives examples described in natural language templates and its demonstration contexts as prefixes, followed by a query as input, thus generating outputs that imitate the provided examples. ICL can be combined with other prompting techniques like Chain-of-Thought, with the demonstration context encompassing the process of reasoning, not just the answers. This approach can effectively stimulate the reasoning ability of LLMs. Yin et al. [58] employ a prompt including notebook contexts and the current intent into NL2Code tasks, making LLMs directly comprehend the task based on provided instances.
For complex use cases of NL2VIS tasks, the ambiguous intention of input queries is challenging to understand correctly without additional specifications. Inspired by the ICL prompting strategies, our prompt involves a sample of original data tables in the context to help LLMs comprehend the query, significantly improving LLM’s grounded understanding of structured knowledge and increasing the generation accuracy.
3.2 Evaluated Prompts
The LLMs can take text as input and generate codes. Therefore, it is a promising approach to finish the NL2VIS tasks based on LLMs. Because existing NL2VIS techniques are end-to-end, that is, they accept natural language queries and output visualization specifications, we solely consider the one-round interaction condition in this work to simulate the end-to-end paradigm and simplify the evaluation process. Therefore, we define the process of LLM-based NL2VIS as two steps. First, users input a prompt containing task descriptions and related data tables. Second, the LLMs return Vega-Lite specifications as response and we further obtain the corresponding visualization results.
To make LLMs (in this paper, the GPT-3.5) generate correct and effective visualizations, we attempt to optimize our prompts and compare the respective performances on the nvBench dataset. Our prompt’s basic version is simple: it merely tells the LLM what roles it plays in the system message, the task query, and the data table it needs in the user message, as presented in the following.
The variable in the curly brackets table_name, nl_query, and sampled_data are the name of the data table, the task description, and the needed data table extracted from the nvBench dataset, respectively. Because several data tables in the nvBench are extremely large, we choose to transfer a sampled data table to GPT-3.5 to decrease the number of tokens.
We find that the output given by GPT-3.5 is not a pure Vega-Lite specification and always contains redundant explanatory text. To make the output only have Vega-Lite specification to facilitate following automatic processes, we add an instruction at the end of the prompt to make GPT-3.5 only output the Vega-Lite specification.
The generated specifications always use inline data sources in specification outputs, which might cause errors because the prompt only consists of a partial data table sampled from the original data. Therefore, we add another instruction to control the format of the data property in the specification to use the URL “data.csv” as the data source.
We utilize this version of prompt as the basis to construct the following zero-shot and few-shot prompts.
3.2.1 Zero-shot prompts
To evaluate the effectiveness of the initial prompt, we first conduct a preliminary study on a hundred instances in the nvBench dataset and find that the generated specifications have several types of mistakes. To promote the performance of LLMs, we complement some rules to make the LLMs avoid these types of mistakes. Therefore, the zero-shot prompt consists of three parts: task descriptions, a sampled data table, and several rules for instructing the generation of Vega-Lite specifications. The following discusses the mistakes and the corresponding rules in the prompt:
(1) Formalize the version of Vega-Lite. The visualization specifications based on Vega-Lite stipulate its version in the $schema property. The results of the preliminary study show that the versions of generated Vega-Lite by GPT-3.5 are not consistent, including both version 4 and version 5. In addition, the syntax of Vega-Lite has some variances between different versions. To make the version of generated Vega-Lite specifications consistent, we add the following rule (Rule 1) in the prompt to guide the output to use Vega-Lite in version 5, which is utilized by the visualization community popularly.
(2) Formalize the position of the transform attribute. The available variables, by default, only include the attributes in the original data table. Therefore, the generated specifications always need to define a variable for the transformation operations listed in the transform property. However, over a quarter of generated specifications in our preliminary evaluation results put the transform property behind the encoding property. These instances do not use the name defined in transform for the field property of axes in the encoding, leading to incorrect results. Therefore, we complement the following rule (Rule 2) about putting the transform property ahead of the encoding property, to prevent generated specifications from not using the variable names that have been defined. The results demonstrate that when the transform property is ahead of the encoding property, the generated specifications can reference the previously defined variable correctly. This example implies that the order of specified attributes in generated Vega-Lite specifications can influence the final results.
(3) Remind the use of filter transformations in the aggregate property. None of the specifications in the preliminary study can filter the input data according to the query description successfully. We add the following rule (Rule 3) to remind the model to use the filter operation to implement data selection. The evaluation results demonstrate that this instruction indeed reduces the number of instances that forget to implement required data filtering.
(4) Remind the use of groupby transformations in the aggregate property. Furthermore, we also find that nearly half of the preliminary results forget to specify the groupby property when using aggregate operation in the transform property. The groupby property is necessary to clarify the data fields to be grouped by when doing specific transformations. For instance, when you show the average height of students for different majors or grades, the groupby property should be the major or grade attribute, respectively. Therefore, missing of the groupby property will make Vega-Lite use a default value for it and can lead to wrong results. To fix this mistake, we add a corresponding rule (Rule 4) to remind the GPT-3.5 model to specify the groupby property in the specification. The evaluation results demonstrate that with this rule the GPT-3.5 never forgets to specify the groupby property of aggregate anymore.
(5) Correct the use of the sort property. More than ninety percent of generated visualization specifications involving the sort operation are erroneous because the results output by GPT-3.5 always defines the sort property in the transform object, which violates the Vega-Lite grammar. Therefore, we complement the following rule (Rule 5) to correct its usage of the sort operation. Though this rule decreases the number of erroneous instances involving the sort operation, many instances of this type are still erroneous no matter how we revise the statement of this rule. We also discuss this question in Sec. 5.1. It reveals that a single rule cannot always guide the generated specification results and make them correct.
Furthermore, after adding this rule, we detect hallucinations in the LLM’s results. More specifically, when using sort transformation, the generated specifications change its pattern of mapping attributes to axes. The previous specification generally maps nominal attributes to the x-axis and quantitative attributes to the y-axis. With the new rule, the specification maps nominal attributes to the y-axis and quantitative attributes to the x-axis and results in flipped axes. Though the flipped visualization result differs from ground truths in appearance, the data they present are the same and, therefore, do not negatively affect the correctness.
3.2.2 Few-shot prompts
Besides the zero-shot prompt, we also adopt the few-shot prompt strategy. In the zero-shot prompt, we do not provide examples of the Vega-Lite specifications to the GPT-3.5 but just use several rules based on the analysis of its mistakes and errors. In contrast, the few-shot prompt strategy does not add extra rules about the Vega-Lite specification but lists some examples consisting of task queries and corresponding correct Vega-Lite specifications as the training data and label, respectively. The queries are selected from the nvBench dataset and we adopt the correct specifications generated by the GPT-3.5 using zero-shot prompts as the source of training labels.
We add one example for each chart type contained in the Vega-Lite to avoid that the omitting of a specific chart type, which may cause the performance degradation on that type. Furthermore, the example for each chart type we select includes at least one particular task type, such as sorting, filtering, and aggregation, and we anticipate the GPT-3.5 to extract rules about corresponding tasks from each chart type example and generalize them to other chart types. Here we present the beginning and the first example of our few-shot prompt:
In conclusion, our few-shot prompt consists of (query, Vega-Lite) pair examples for each chart type in the nvBench, task descriptions, query descriptions, a sampled data table, and two-generation rules specifying the output format.
4 Evaluation
In this section, we first introduce the dataset and LLM we adopt in the evaluation, and then we present and analyze the evaluation results and the comparison with previous NL2VIS approaches.
4.1 Dataset and Model
We utilize the nvBench [26] dataset as the benchmark in our evaluation. The nvBench is a large-scale NL2VIS dataset, covering over 100 application scenarios like sports and medical, and containing 7,247 visualization instances and more than 25,000 (NL, VIS) pairs. The dataset covers seven chart types: bar, pie, line, scatter, stacked bar, grouping line, and grouping scatter charts. The dataset categorizes the NL2VIS tasks into four levels of difficulties: easy, medium, hard, and extra hard, based on the complexity of the data transformations involved. Each instance in the nvBench contains a task described in a natural language query proposed by Luo et al. [26] and can be seen as a combination of chart type statement and a SQL query, a visualization as the ground truth, and several natural language queries.
We find that partial instances in the nvBench require joining at least two data tables to fulfill the corresponding task. However, Vega-Lite cannot support multiple data sources in a single visualization specification. Therefore, we need to merge multiple data tables, filter the required attributes using SQL queries, and take the data processing result as the input of Vega-Lite specification. Because this study only evaluates the capability of a large language model to generate visualization specifications, we filter these instances related to multiple data tables and use all the remaining instances to implement our evaluation.
As for the LLM, we select the GPT-3.5 as the representative of LLMs because it is commonly used and has a lower cost than the GPT-4. To prevent the prompts containing few-shot examples and sampled data tables from exceeding the token limit, we adopt the GPT-3.5-turbo-16k to implement the evaluation. We set the temperature parameter of the GPT-3.5 to 0 to avoid randomness.
4.2 Metrics
In the evaluation, we leverage the match accuracy between the ground truth and the results generated by the GPT-3.5. Specifically, we convert the generated Vega-Lite into visualization results and then compare the results with the ground truth visualizations to check whether they are equivalent.
To measure the equivalence between two charts that are presented as images, we first use a naive metric, pixel-based match accuracy. The pixel-based match means that the generated result is correct only if each pixel of its image is identical to the corresponding pixel of the ground truth image. However, this naive metric is too strict because only a little difference between the two images, for instance, the title of the axes, can lead to a pixel-based mismatch. It is reasonable that two visualizations are equivalent if the chart type and the data presented are identical. Therefore, we adopt a svg-json-based matching strategy, which leverages both the SVG image and the Vega-Lite specification in a JSON format, to check the equivalence of two visualizations.
First, we extract the chart type of the visualization from the corresponding Vega-Lite specification in the JSON format. If the chart type of the generated result is different from that of the ground truth, we consider the generated result as wrong. Then, we extract the underlying values from the graphical elements in the visualization shown by an SVG and compare these two value sets. If the two value sets are equal and the chart types are also the same, we consider the generated result as right.
4.3 Evaluation Results
The accuracy of the pixel-based matching strategy is 3.02% for the zero-shot strategy and 5.63% for the few-shot strategy. Both of these matching results are low because even though the contents of two visualization charts are equivalent, their pixels are possibly not the same entirely and different in some nuances, such as the title of axes or the unit value of axes.
Table I presents the evaluation result based on the svg-json-based matching strategy. The overall match accuracies of zero-shot and few-shot prompt strategies on the nvBench are 43.23% and 50.12%, respectively and the performance of few-shot prompt is significantly higher than that of zero-shot prompt. For the performance on different chart types, the zero-shot prompt generates the highest accuracy on scatter plots and the second highest accuracy on pie charts, and the following ranking is grouping scatter plots, bar charts and stacked bar charts. As for the few shot prompt, the performance ranking from high to low is grouping scatter plots, pie charts, scatter plots, bar charts, and stacked bar charts, and the accuracy of grouping scatter plots is even greater than 90%.
Both prompt strategies perform relatively well on scatter plots, grouping scatter plots, and pie charts and have a relatively low accuracy on bar charts and stacked bar charts. Especially for stacked bar charts, the generation accuracy can be slightly more than 20%. It is worth noting that though the performance of the few-shot prompt is higher than that of the zero-shot prompt on the overall accuracy and the accuracies of the other four chart types, its performance on the scatter plots is lower than the zero-shot prompt. We analyze the generated Vega-Lite specifications of scatter plots output by two prompts, respectively, and find that the specifications of the few-shot prompt have more errors in data transformation compared with the zero-shot prompt. Specifically, partial specifications of the few-shot prompt fail to implement data filtering as the task query requires, while corresponding specifications given by the zero-shot prompt correctly complete the task. For instance, a query in the nvBench asks to make a scatter plot to show the age and weight of abandoned dogs whose abandoned_yn attribute of the table is equal to 1. However, the result of the few-shot prompt uses all the items in the table, while the zero-shot result correctly selects the items whose abandoned_yn attribute is equal to 1.
We further analyze why the specifications of the few-shot prompt have more errors in data transformation compared with the zero-shot prompt for scatter plots. As explained above, we add rules to realize the filtering operation in the specification based on the zero-shot prompt strategy. For the few-shot prompt strategy, we list some examples in the prompt. We find that the scatter plot example we use in the few-shot prompt does not contain a filtering operation. However, the examples of other chart types used in the few-shot prompt indeed contain the filtering operation. Therefore, the abnormality in the performance that the zero-shot prompt performs better than the few-shot prompt is possibly because the GPT-3.5 fails to generalize the filtering operation to other chart types, especially the scatter plot in a proportion of generated specifications.
The task difficulty, referred to as “hardness” defined in the nvBench, also influences the evaluation results significantly. As shown in Table I, the performance of both prompts decreases with increasing difficulties. The performance of the few-shot prompt on hard tasks is abnormally lower than the zero-shot prompt, which is similar to scatter plots. After analysis, we find that the reason is also identical. More specifically, the hard tasks consist of many data transformations like data filtering. However, the results given by the few-shot prompt forget to do required transformations or make mistakes in transformation operations, making the performance of the few-shot prompt relatively lower.
| Accuracy | Overall | Chart type | Task difficulty | |||||||
| Bar | Pie | Scatter | Stacked bar | Grouping scatter | Easy | Medium | Hard | Extra hard | ||
| Zero-shot | 43.23% | 46.00% | 57.37% | 69.68% | 21.47% | 51.05% | 48.28% | 47.15% | 37.40% | 10.93% |
| Few-shot | 50.12% | 53.32% | 68.80% | 62.67% | 21.79% | 93.19% | 60.72% | 54.28% | 30.39% | 12.92% |
We classify the reasons resulting in wrong generation results into four categories: invalid JSON, invalid Vega-Lite, chart type mismatch, and chart content mismatch. Table II shows the distribution of these four errors. The invalid JSON error means the generated specification is not a valid JSON file, and the invalid Vega-Lite error means the specification is a valid JSON file but cannot conform to the syntax of Vega-Lite. The error about chart type mismatch implies that the chart type of generated results is different from the ground truth. The chart content mismatch means that the chart types between the ground truth and generated results are identical, but the underlying data contents are different.
Table II presents the distributions among four different errors of zero-shot and few-short prompts. We can learn that the major errors in the results of both prompts are invalid Vega-Lite and chart content mismatch. The proportion of invalid Vega-Lite of the zero-shot prompt is significantly higher than the few-shot prompt, while the proportion of the other three error types of both prompts has a slight difference. Although our zero-shot prompt adds rules to instruct the GPT-3.5 to avoid syntax errors and fulfill tasks more correctly, the zero-shot strategy still makes more errors of Vega-Lite grammar than the few-shot strategy. The reason may be that the added rules interfere mutually and thus do not work as expected.
| Invalid JSON | Invalid Vega-Lite | Chart Type Mismatch | Chart Content Mismatch | |
| Zero-shot | 0.11% | 18.71% | 1.38% | 29.79% |
| Few-shot | 0.22% | 14.37% | 0.75% | 28.34% |
4.4 Comparison with Previous Approaches
The performance comparison among previous approaches and our zero-shot and few-shot prompt strategies using the GPT-3.5 is shown in Table III. The performance of previous approaches is evaluated by Song et al. [33] and Maddigan et al. [23].
We can learn the performance of the zero-shot prompt is slightly lower than the state-of-the-art performance of previous approaches and is approximately equal to Chat2VIS [21], which is also an LLM-based approach using a simple prompt that is not explicitly optimized. The performance of the few-shot prompt strategy surpasses the state-of-the-art performance of previous approaches by greater than 50%, demonstrating the powerful potential of GPT-3.5 on the NL2VIS task.
| Approaches | Accuracy |
| Seq2Vis [26] | 2% |
| Transformer [59] | 3% |
| ncNet [12] | 26% |
| Chat2VIS [21] | 43% |
| RGVisNet [33] | 45% |
| Ours (Zero-shot) | 43% |
| Ours (Few-shot) | 50% |
5 Findings
In this section, we first categorize the reasons that restrict the performance of GPT-3.5 on the NL2VIS task, then introduce the limitations we find in the existing NL2VIS benchmark.
5.1 Limitations of LLMs in NL2VIS
The previous section shows the performance of GPT-3.5 on the nvBench dataset is mediocre. We analyze errors and divide them into the following three categories to find the limitations of GPT-3.5 on Vega-Lite generation to facilitate further optimization.
Error Type 1: Invalidity of Vega-Lite specification. This is the most common error in our evaluation results, meaning that the generated Vega-Lite specifications are invalid and have grammar errors, leading to the failure in transforming the Vega-Lite specifications to the visualization results. The reasons leading to invalid Vega-Lite specification are divided into three types.
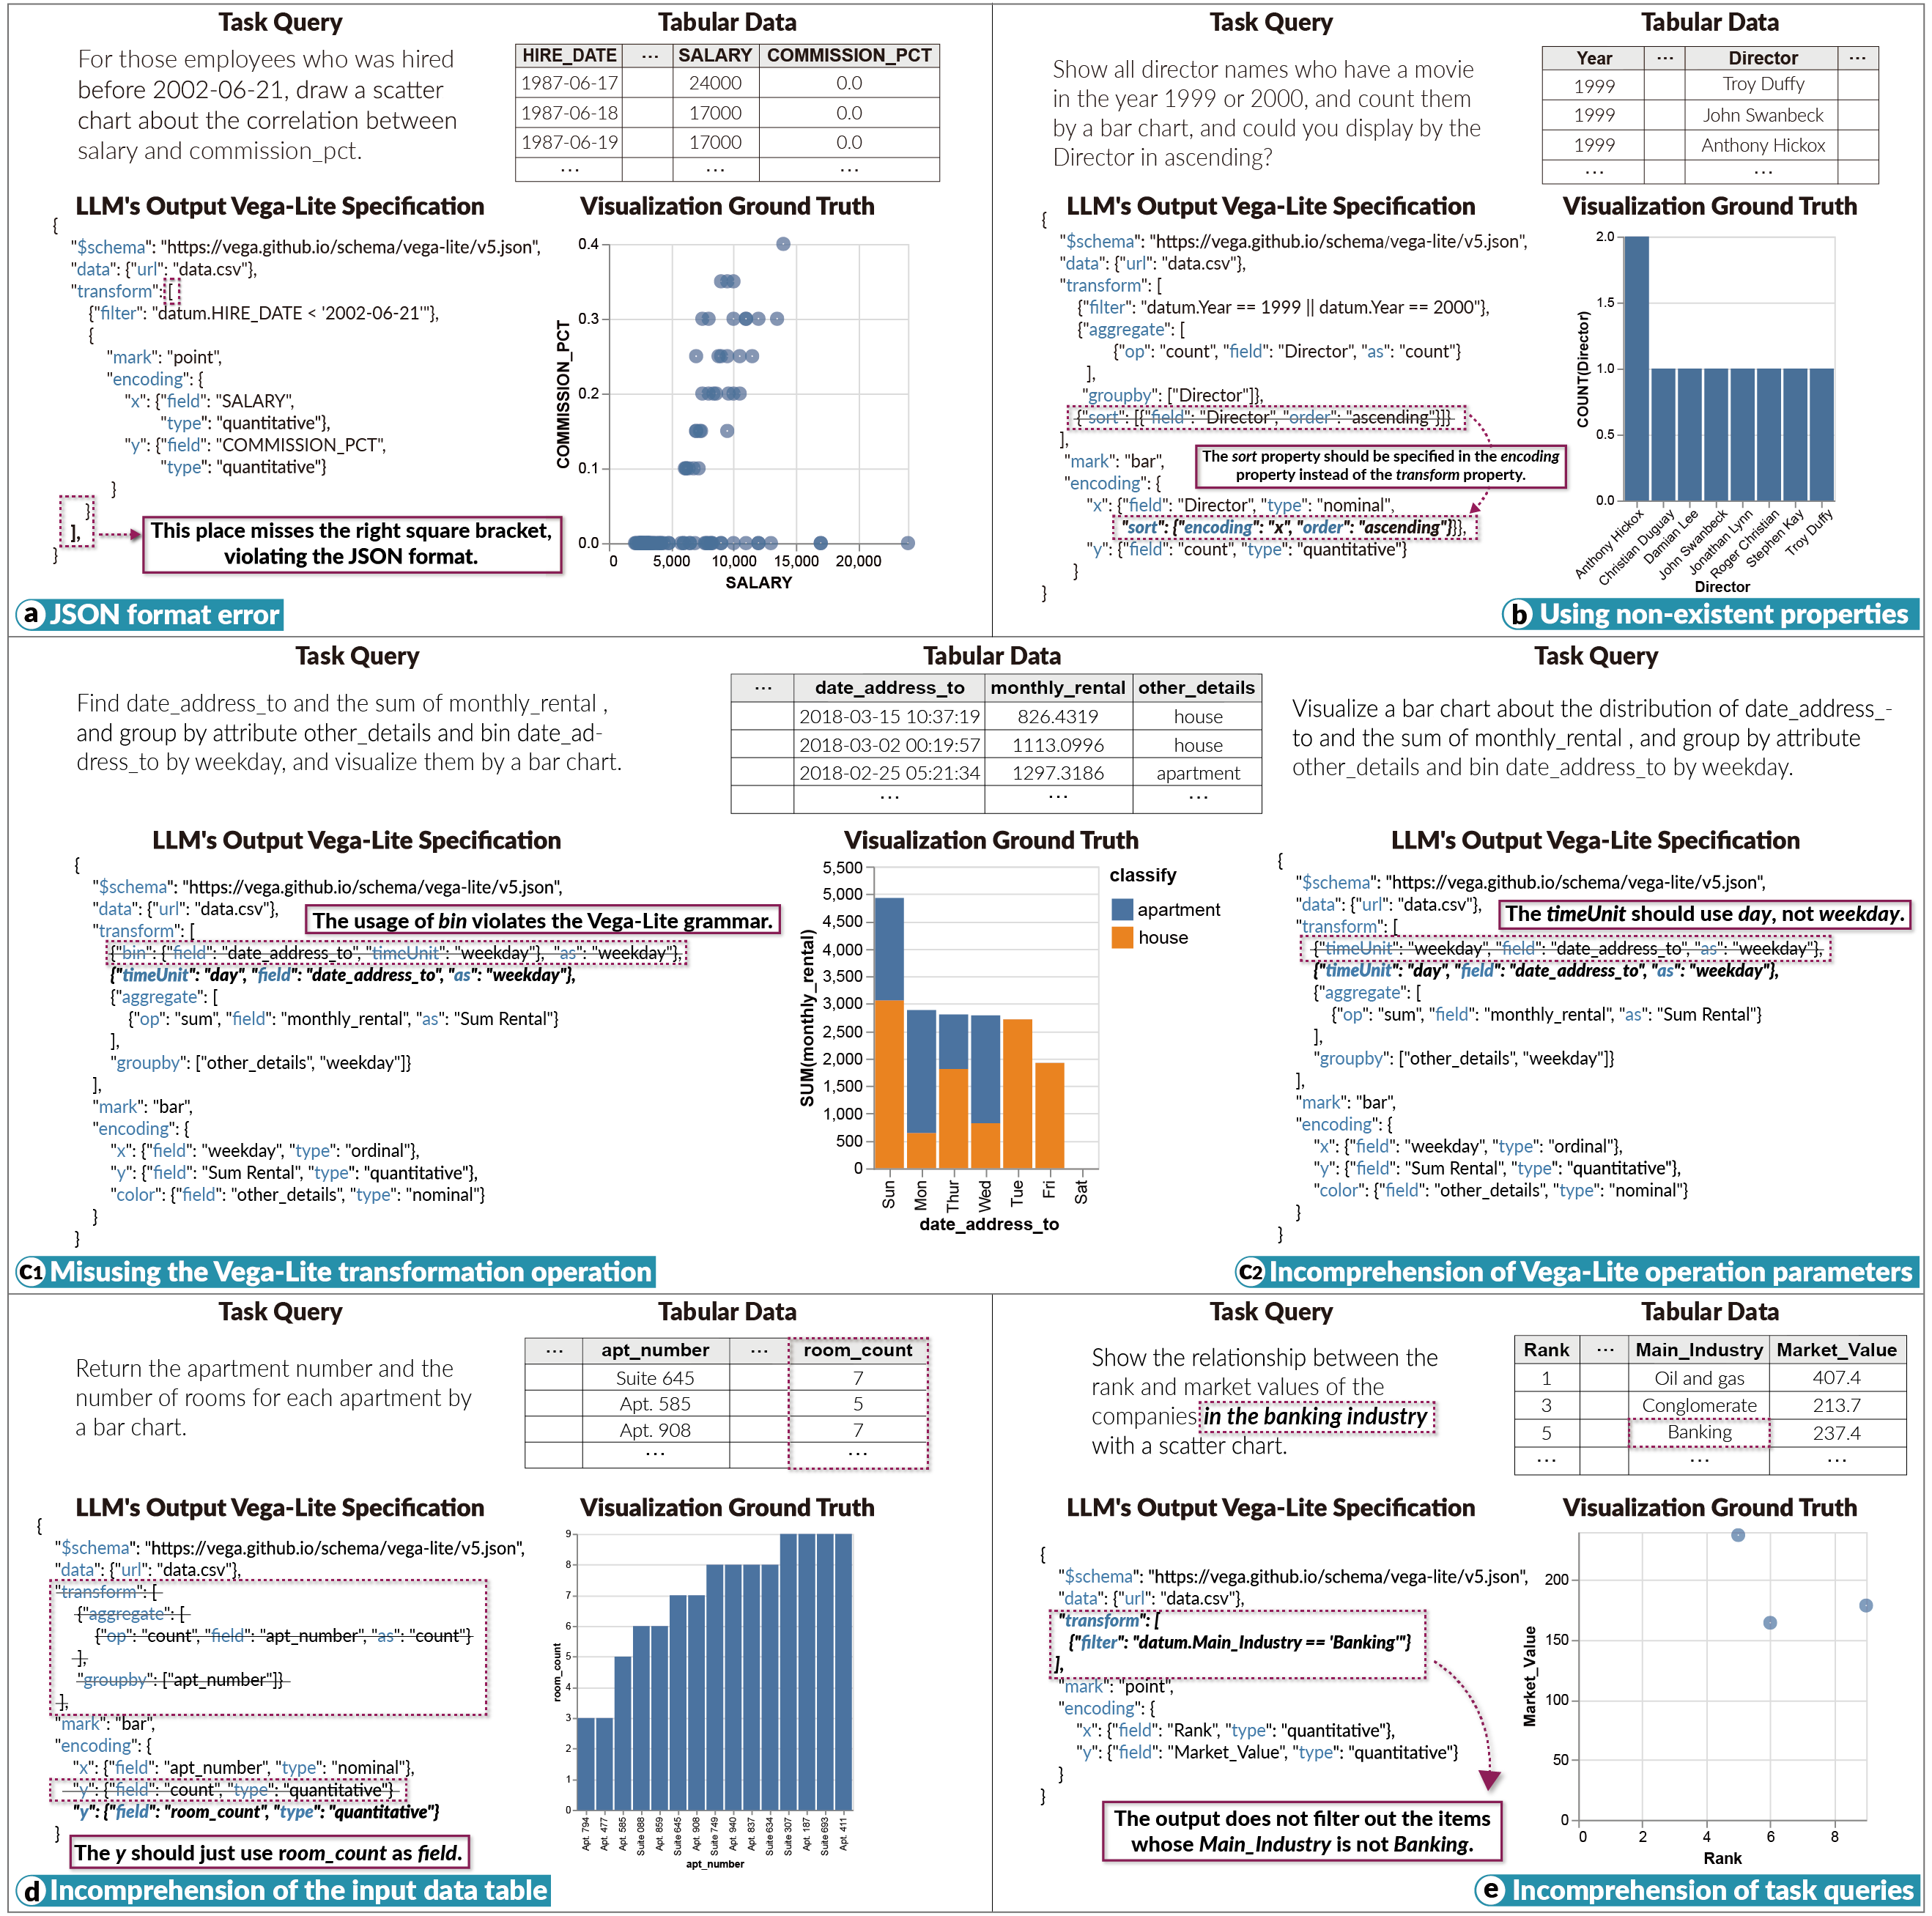
(1) JSON format error. This type of error misuses the properties of Vega-Lite specification and results in an invalid JSON object. Fig. 2(a) shows an example generated by GPT-3.5, which violates the format rules of valid JSON objects. More specifically, GPT-3.5 puts the mark and encoding properties into the transform property and regards the encoding property as the ending of the specification. Such misusage always leads to a missing square bracket at the end of the transform and causes a JSON format violation.
(2) Using non-existent properties in the Vega-Lite specification. This type of error adds non-existent properties within the generated specification. Fig. 2(b) shows an example that conforms to the JSON format requirements but uses a non-existent sort in the transform property. According to the task description, the chart should sort the Director attribute in ascending order, which can be realized by defining the sort in the x property as highlighted using bold text in Fig. 2(b). Although GPT-3.5 can understand the task query to define the sorting operation correctly, the misusage of the sort in the transform property leads to an incorrect specification. Moreover, the error about the sort property occurs frequently in tasks requiring sorting one attribute, leading to a relatively low performance of GPT-3.5 on this type of task.
(3) Misusing the Vega-Lite transformation operation. The type of error misuses the transformation operations in the Vega-Lite specification. For example, Fig. 2(c) has a correct JSON format and does not use non-existent operations, but the usage of the bin in the transform property is incorrect, and the output specification still violates the Vega-Lite grammar. The task query is to bin date_address_to by weekday, and the correct specification can achieve this goal by defining timeUnit in the transform property. The output given by GPT-3.5 confuses the function of bin and timeUnit and leads to an invalid specification.
The incorrectness of Vega-Lite specifications reflects that LLMs have non-negligible hallucination [13] problems on the Vega-Lite output, such as specifying data transformations not contained in queries or making grammar errors. The above examples also inspire us that the Vega-Lite visualization specifications consist of some grammar errors, providing an effective linting strategy on the visualization specifications will improve the performance. The linting techniques for the output of LLMs should focus on the transformations of the Vega-Lite specification.
Error Type 2: Incomprehension of Vega-Lite specifications. The second category indicates that the generated Vega-Lite specifications do not have grammar errors and can be transformed into visualizations successfully. However, the generated visualizations are incorrect compared with the ground truth because GPT-3.5 cannot fully understand the meaning of parameters in Vega-Lite.
Incomprehension of Vega-Lite operation parameters. This type of error means LLMs cannot fully understand the operation parameters of Vega-Lite. The query in this example is similar to the third type of Error 1. However, different from the specification of Error 1, this specification has no grammar error, but the final generated chart is still incorrect compared with the ground truth. The reason is the incomprehension of parameters of timeUnit used in the transform property. Although the query indeed asks to bin date_address_to by weekday, GPT-3.5 achieves this goal by defining the value of timeUnit as weekday instead of the correct parameter day. This example reveals that GPT-3.5 needs to have comprehensive knowledge of the Vega-Lite grammar, and can be easily affected by the query to use incorrect parameter assignments.
This type of error implies that one aspect of improving the performance of LLMs on the NL4VIS task is to develop more strategies to facilitate LLMs to understand and correctly use the parameters of Vega-Lite specifications. For example, the documentation of Vega-Lite [60] should be one important resource for realizing this target.
Error Type 3: Incomprehension of task descriptions and data. For this type of error, the generated Vega-Lite specifications are correct from the grammar aspect, and GPT-3.5 can also correctly use the parameters in the output specification. However, GPT-3.5 may misunderstand the data tables or task queries, leading to an incorrect visualization result.
(1) Incomprehension of the input data table. The type of error indicates that GPT-3.5 cannot fully understand the attributes of the input data and misuses the attributes in the specification. As shown in Fig. 2(d), the query is to show the apartment number and the number of rooms for each apartment using a bar chart, and the needed attributes in the data table are apt_number and room_count. This task can be easily completed by presenting the apt_number attribute on the x-axis and the room_count attribute on the y-axis. However, as the Vega-Lite output in Fig. 2(d), GPT-3.5 does not understand the meaning of the room_count attribute and considers that each row in the data table describes the information of a single room in an apartment. Therefore, it chooses to count the number of rows for each apartment and generates an incorrect result. The correct specification is shown using italic, bold text in Fig. 2(d).
(2) Incomprehension of task queries. The second type of error in this category is misunderstanding task queries. Fig. 2(e) illustrates an example of task query incomprehension. The query asks to present the rank and market values of the companies in the banking industry, and GPT-3.5 should first select the rows whose the Main_Industry attribute value equals to Banking. However, the output shown in Fig. 2(e) does not use the filtering operation and generates an incorrect result, demonstrating that GPT-3.5 does not fully capture the requirements of the task description.
The above error implies that it is essential to understand the input data table and task descriptions comprehensively to generate the Vega-Lite specifications correctly. This finding inspires us to separate the NL4VIS task based on LLMs into different steps and check the correctness of the results for each step. Therefore, we can bring user interactions into the visualization generation process and utilize more prompt strategies, such as Chain-of-Thought, to improve LLMs’ performance.
5.2 Reexamining NL2VIS Benchmark
We analyze the mismatched results in the output of GPT-3.5 and further find that partial instances in the nvBench are not correct, and corresponding failures of GPT-3.5 should be attributed to the nvBench itself. We categorize the failures into five categories and discuss them in detail to inspire the improvement of benchmark design for the NL2VIS task.
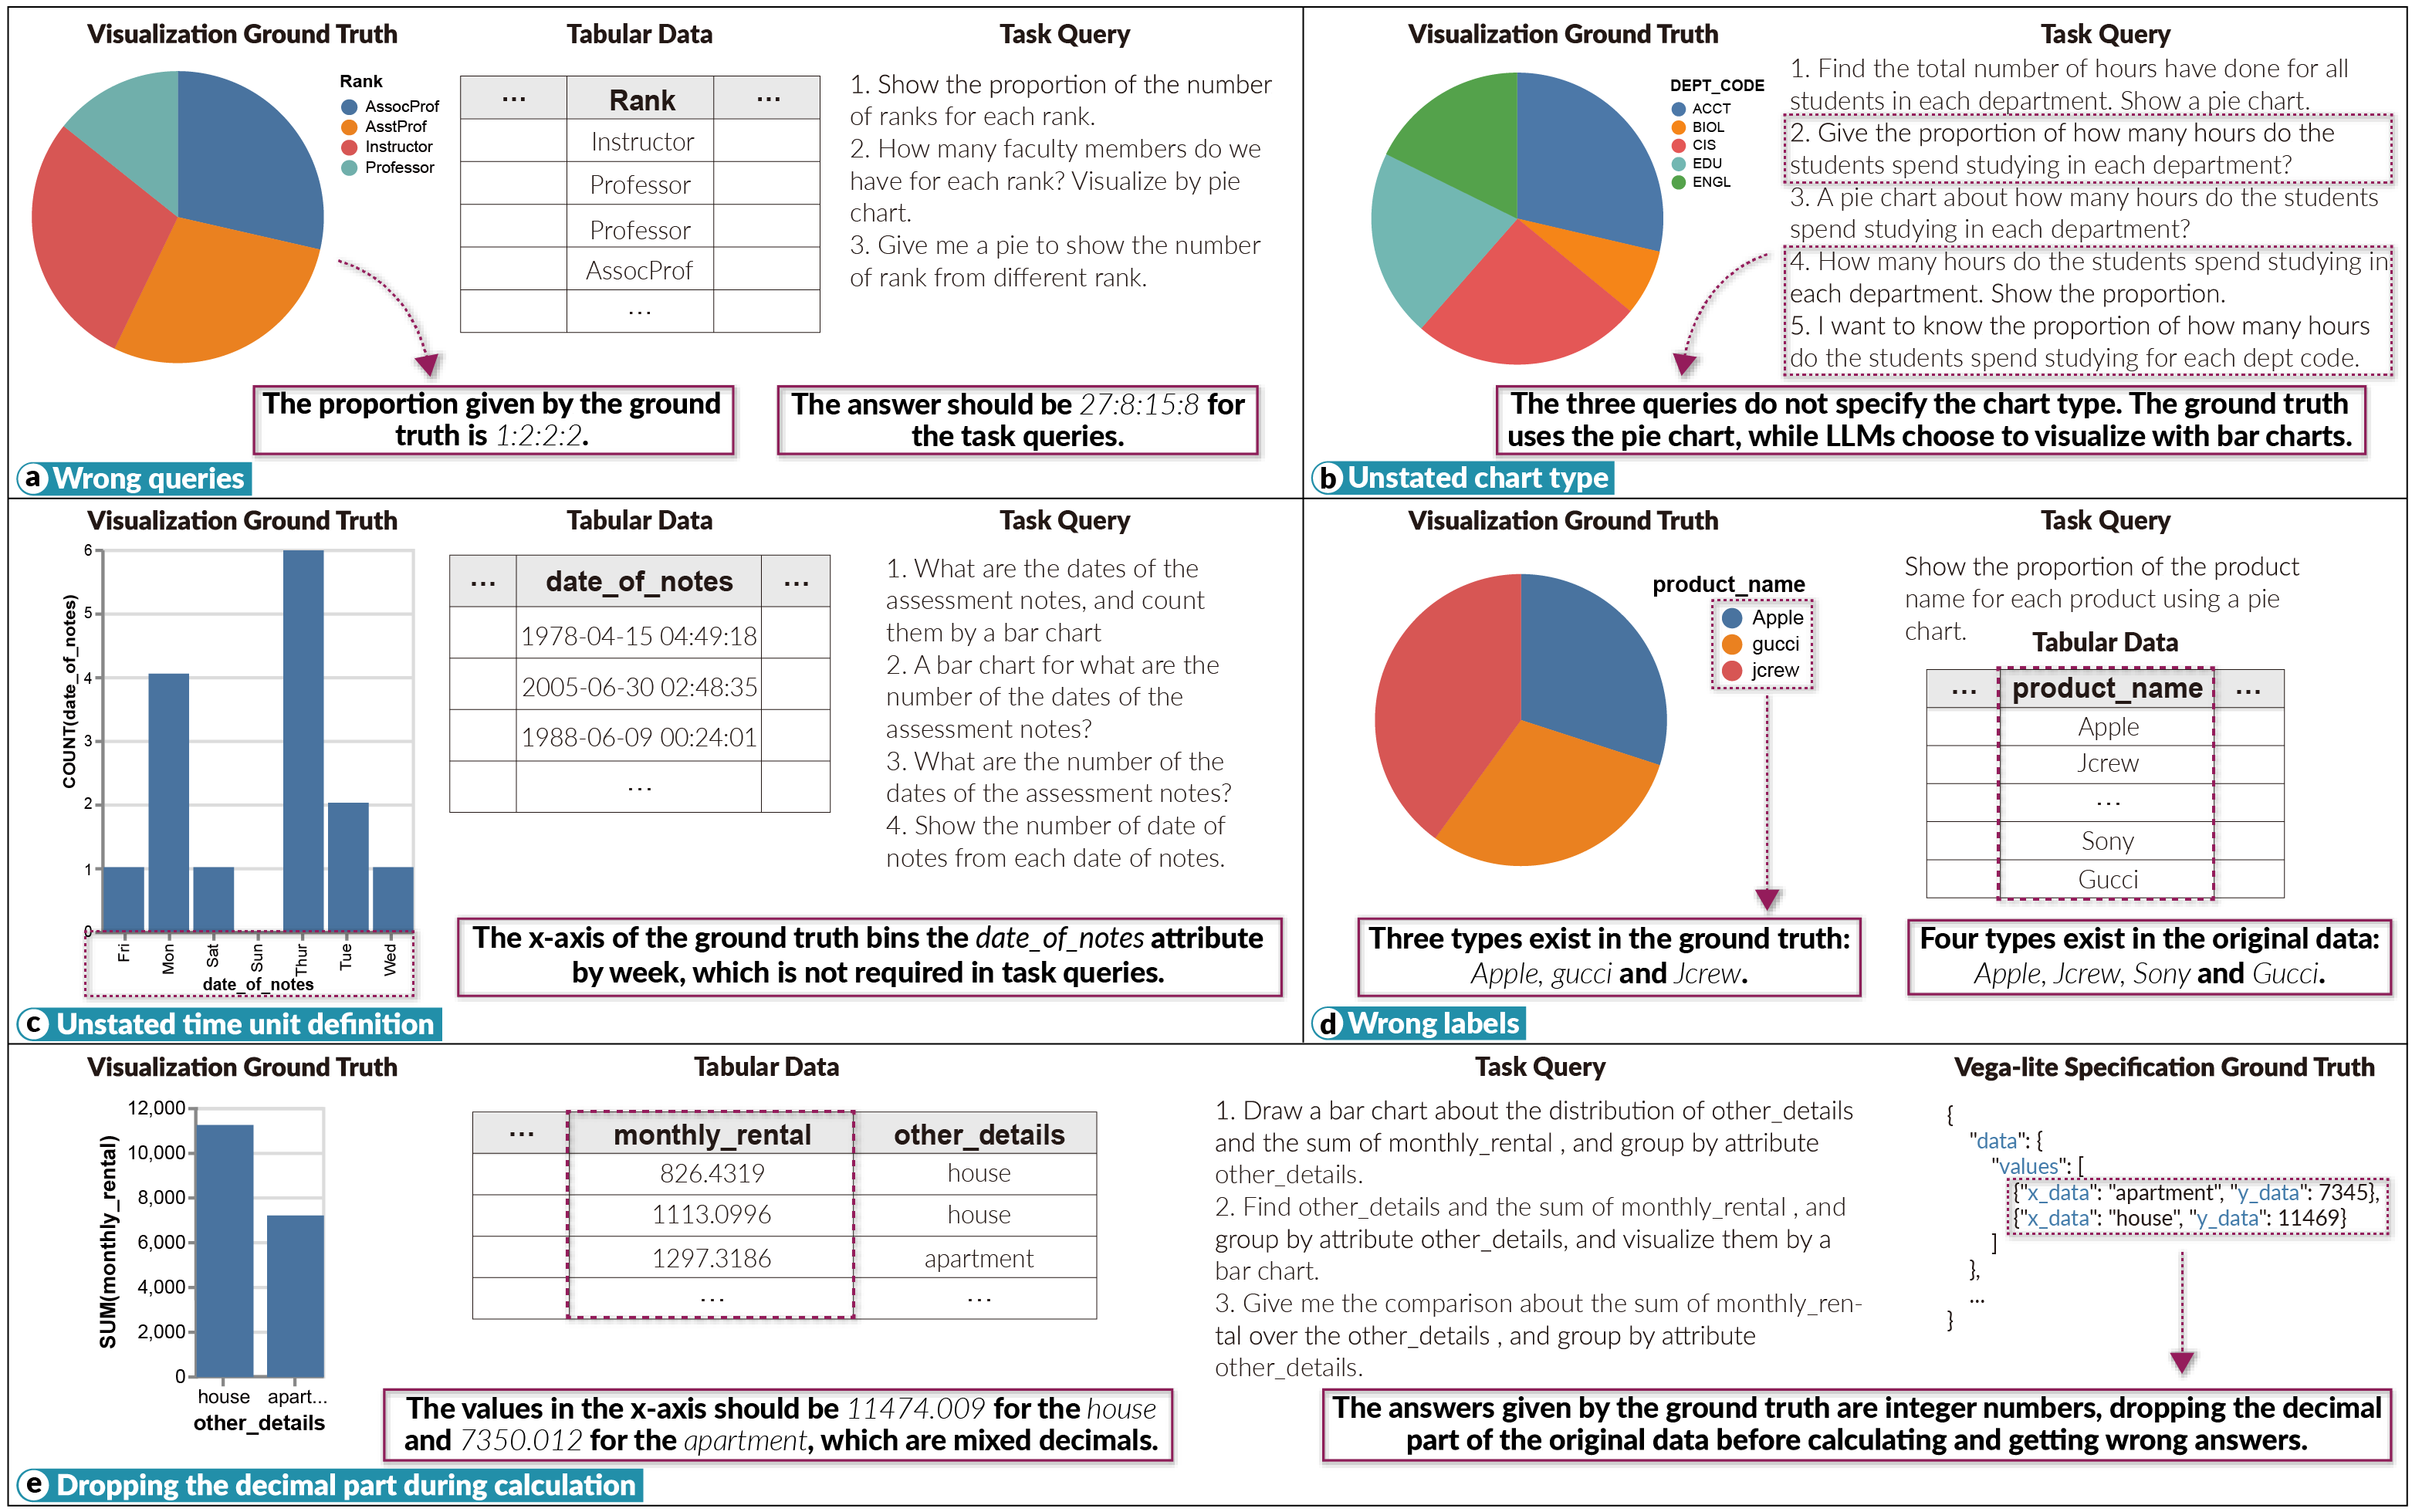
Incorrect query statements. Figure 3(a) shows an example of a question in a queries that is incorrect and confusing combined with the ground truth chart. The queries in Fig. 3(a) ask the number of faculty members for each rank, and the answer is 27 for professors, 8 for associate professors, 15 for assistant professors, and 8 for instructors. The ground truth chart shows an entirely different answer, 1:2:2:2, and GPT-3.5 successfully gives out the correct answer of 27:8:15:8.
A more reasonable explanation is that the ground truth chart reflects the real intention of this instance, and the queries are incorrect. The only statistic satisfying the ratio 1:2:2:2 is the number of genders for each rank; that is, professors’ gender attribute has only one sort, while the other three ranks have two genders. Thus, the correct queries should ask the proportion of the number of genders for each rank.
The incorrect query that mismatches the content of visualizations is a severe problem in an NL2VIS benchmark. It is difficult for human-designed and automatically generated queries to avoid this problem entirely, and thus, careful examinations are indispensable. Considering some foundation models have the multi-modal ability that makes foundation models understand the natural language and images simultaneously, we can use them to examine whether the query matches the visualization content effectively.
Inappropriate data mapping. The data mapping indicates encoding data attributes into appropriate visual channels. Principles of visualization design have been well studied and summarized in the existing research community [1, 61, 62]. Effective visualization results require appropriate data mapping strategies. However, we find part of the Vega-Lite specifications given by the nvBench assign inappropriate types to the data. Though these inappropriate data mappings have no negative impacts within our evaluation process, this problem may affect evaluation approaches based on the contents of visualization images. For example, a scatter plot of ground truths presents the number of different majors on the x-axis and regards the major number as quantitative type. However, the number of different majors is usually discrete integer numbers but not continuous real numbers. Therefore, the major number of this example should be nominal type.
Another ground truth misuses temporal data as the nominal type, which occurs in almost every instance involving temporal data. This situation conveys unreasonable data insights from the view of visualization design principles because it may lead to an incorrect time sequence as the nominal type data is arranged alphabetically. Therefore, the temporal data should be classified as a temporal or ordinal type.
To correct inappropriate data mappings in the visualization, we can adopt linting techniques, which are similar to solving the invalidity of Vega-Lite specifications in 5.1. we can only add rules about data mappings of visualization and use the linting technique to check specifications in the benchmark and correct inappropriate data mappings.
Incorrect data. Many instances in the nvBench involving numerical calculations such as summation and average directly drop the decimal part of data in original tables before calculation, leading to entirely different computation results between the ground truths and output of GPT-3.5.
As shown in Fig. 3(e), the monthly_rental attribute in the original data table is the mixed decimal. However, in the Vega-Lite specification given by the nvBench shown in the rightmost, the final summation results are the integer number. After examination, we find the nvBench drops the decimal part of the monthly_rental attribute before summation, resulting in an absolute error greater than one compared with correct answers.
Another problem subtype that existed in nvBench ground truths is incorrect labels. Fig. 3(d) shows an example. This instance asks for the proportion of products for each product name, but the ground truth chart obviously loses the Sony label according to the original table. In contrast, the output of GPT-3.5 is correct actually. Because the Vega-Lite specification ground truth adopts the inline data source, the incorrect label problem may be caused by carelessness when generating this instance.
To make the data shown in the visualization consistent with the original table, we should ensure the data property’s content is equal to that of the original table or just use the inline data source in Vega-Lite specifications.
Unstated time unit definition. Some instances in the nvBench requiring the presentation of temporal data in charts have queries that do not explicitly state the time unit’s definition. Therefore, the results generated by GPT-3.5 define different time units compared with ground truths, leading to low accuracy in these instances.
Figure 3(c) shows an example of the unstated time unit definition. The ground truth chart bins the date_of_notes attribute, which is measured in seconds, to the time unit of one week. However, this requirement is not explicitly nor implicitly stated in the query statement, thus making GPT-3.5 generate an entirely different chart compared with the ground truth.
This problem is similar to the incorrect query problem. Thus, we can also use the multi-modal foundation model to examine the generated visualization results. If the foundation models find that the visualization defines the time unit not stated in corresponding queries, we can revise the visualization specification and correct this problem.
Unstated chart type. Most queries in the nvBench demand a specific chart type, but some do not state a chart type explicitly, which negatively impact the judgement of GPT-3.5.
The instance shown in Fig. 3(b) has five queries, and only the first and third queries require a pie chart explicitly. GPT-3.5 generates pie charts for these two queries (first and third), and gives out bar charts for the other three queries. For the three queries that do not require pie charts explicitly, they emphasize the proportion and quantity in the statement simultaneously. Thus, bar charts are also appropriate. We define the mismatch between generated results and ground truths as incorrect results. Thus, the problem of unstated chart types also decreases the performance of GPT-3.5 on the nvBench.
The queries in the nvBench are generated automatically by an NL2SQL-to-NL2VIS synthesizer [26], and we suppose the generation procedure for natural language queries can be further optimized to eliminate the ambiguity of chart type statements existing in a part of queries. For instance, we can use LLMs to examine queries and add the most appropriate chart type, which is determined by the LLM depending on the rules of chart type selection we input in the prompt, to the problematic query.
6 Conclusion
In this paper, we select GPT-3.5 and the nvBench dataset to evaluate the performance of LLMs on the NL2VIS task. Specifically, we make GPT-3.5 generate Vega-Lite specifications given a data table and a task query as the input and compare the generated visualizations with ground truths using the matching accuracy based on the chart type and data contents in the visualization as the metric. We design a zero-shot prompt and a few-shot prompt for the Vega-Lite generation and evaluate their performances respectively. We also summarize and categorize several drawbacks of GPT-3.5 on the NL2VIS task and the nvBench itself, which can facilitate the advancement of NL2VIS. We attempt to promote the performance of the NL2VIS task by optimizing prompts and introducing conversational interaction with LLMs in future work. The key findings of this paper are as follows:
-
•
The evaluation results demonstrate that the performance of the few-shot prompt is significantly higher than the zero-shot prompt and surpasses the SOTA performance of previous NL2VIS techniques.
-
•
The LLM has drawbacks in the Vega-Lite grammar and understanding of task descriptions and data. The linting techniques and interaction between users and LLMs can be leveraged to correct the mistakes or improve the quality of LLM’s output. The documentation of Vega-Lite and specification examples can be used to finetune the LLM or be added to prompts to promote the LLM on NL2VIS tasks.
-
•
Existing NL2VIS benchmarks also have several drawbacks, which may affect the evaluation and promotion of the performance of LLMs on NL2VIS tasks. Using LLMs to improve the quality of queries in the benchmark can be considered. We can add several rules about the query, such as explicit chart-type statements and clear time unit definitions for temporal data, and make LLMs examine and correct benchmark queries.
References
- [1] T. Munzner, Visualization analysis and design. CRC press, 2014.
- [2] J. D. Mackinlay, “Automating the design of graphical presentations of relational information,” ACM Transactions on Graphics, vol. 5, no. 2, pp. 110–141, 1986.
- [3] J. Mackinlay, P. Hanrahan, and C. Stolte, “Show me: Automatic presentation for visual analysis,” IEEE Transactions on Visualization and Computer Graphics, vol. 13, no. 6, pp. 1137–1144, 2007.
- [4] Y. Sun, J. Leigh, A. E. Johnson, and S. Lee, “Articulate: A semi-automated model for translating natural language queries into meaningful visualizations,” in Proc. Int. Symp. Smart Graphics (SG), ser. Lecture Notes in Computer Science, vol. 6133, 2010, pp. 184–195.
- [5] “The stanford parser,” http://nlp.stanford.edu/software/lex-parser.shtml.
- [6] Y. Luo, X. Qin, N. Tang, G. Li, and X. Wang, “DeepEye: Creating good data visualizations by keyword search,” in Proc. Int. ACM Conf. Management of Data (SIGMOD), 2018, pp. 1733–1736.
- [7] “Apache opennlp,” 2017, http://opennlp.apache.org.
- [8] A. Narechania, A. Srinivasan, and J. T. Stasko, “NL4DV: A toolkit for generating analytic specifications for data visualization from natural language queries,” IEEE Transactions on Visualization and Computer Graphics, vol. 27, no. 2, pp. 369–379, 2021.
- [9] C. D. Manning, M. Surdeanu, J. Bauer, J. R. Finkel, S. Bethard, and D. McClosky, “The Stanford CoreNLP natural language processing toolkit,” in Proc. Con. Association for Computational Linguistics (ACL), 2014, pp. 55–60.
- [10] L. Shen, E. Shen, Y. Luo, X. Yang, X. Hu, X. Zhang, Z. Tai, and J. Wang, “Towards natural language interfaces for data visualization: A survey,” IEEE Transactions on Visualization and Computer Graphics, vol. 29, no. 6, pp. 3121–3144, 2023.
- [11] C. Liu, Y. Han, R. Jiang, and X. Yuan, “ADVISor: Automatic visualization answer for natural-language question on tabular data,” in Proc. IEEE Pacific Visualization Symposium (PacificVis), 2021, pp. 11–20.
- [12] Y. Luo, N. Tang, G. Li, J. Tang, C. Chai, and X. Qin, “Natural language to visualization by neural machine translation,” IEEE Transactions on Visualization and Computer Graphics, vol. 28, no. 1, pp. 217–226, 2022.
- [13] J. Achiam, S. Adler, S. Agarwal, L. Ahmad, I. Akkaya, F. L. Aleman, D. Almeida, J. Altenschmidt, S. Altman, S. Anadkat et al., “GPT-4 technical report,” preprint arXiv:2303.08774, 2023.
- [14] W. Yang, M. Liu, Z. Wang, and S. Liu, “Foundation models meet visualizations: Challenges and opportunities,” Computational Visual Media, 2024, preprint arXiv:2310.05771.
- [15] D. Hendrycks, S. Basart, S. Kadavath, M. Mazeika, A. Arora, E. Guo, C. Burns, S. Puranik, H. He, D. Song, and J. Steinhardt, “Measuring coding challenge competence with APPS,” preprint arXiv:2105.09938, 2021.
- [16] H. Liu, R. Ning, Z. Teng, J. Liu, Q. Zhou, and Y. Zhang, “Evaluating the logical reasoning ability of chatgpt and GPT-4,” preprint arXiv:2304.03439, 2023.
- [17] Z. Yuan, H. Yuan, C. Tan, W. Wang, and S. Huang, “How well do large language models perform in arithmetic tasks?” preprint arXiv:2304.02015, 2023.
- [18] J. Wei, X. Wang, D. Schuurmans, M. Bosma, F. Xia, E. Chi, Q. V. Le, D. Zhou et al., “Chain-of-thought prompting elicits reasoning in large language models,” Advances in Neural Information Processing Systems, vol. 35, pp. 24 824–24 837, 2022.
- [19] W. Chen, X. Ma, X. Wang, and W. W. Cohen, “Program of thoughts prompting: Disentangling computation from reasoning for numerical reasoning tasks,” preprint arXiv:2211.12588, 2022.
- [20] D. Zhou, N. Schärli, L. Hou, J. Wei, N. Scales, X. Wang, D. Schuurmans, C. Cui, O. Bousquet, Q. V. Le, and E. H. Chi, “Least-to-most prompting enables complex reasoning in large language models,” in Proc. Int. Con. Learning Representations (ICLR), 2023.
- [21] P. Maddigan and T. Susnjak, “Chat2VIS: Generating data visualizations via natural language using chatgpt, codex and GPT-3 large language models,” IEEE Access, vol. 11, pp. 45 181–45 193, 2023.
- [22] V. Dibia, “LIDA: A tool for automatic generation of grammar-agnostic visualizations and infographics using large language models,” in Proc. Con. Association for Computational Linguistics (ALC), 2023, pp. 113–126.
- [23] P. Maddigan and T. Susnjak, “Chat2VIS: Fine-tuning data visualisations using multilingual natural language text and pre-trained large language models,” preprint arXiv:2303.14292, 2023.
- [24] X. Pu, M. Kay, S. M. Drucker, J. Heer, D. Moritz, and A. Satyanarayan, “Special interest group on visualization grammars,” in Extended Abstacts of ACM Conf. Human Factors in Computing Systems, 2021.
- [25] A. Satyanarayan, D. Moritz, K. Wongsuphasawat, and J. Heer, “Vega-lite: A grammar of interactive graphics,” IEEE Transactions on Visualization and Computer Graphics, vol. 23, no. 1, pp. 341–350, 2017.
- [26] Y. Luo, N. Tang, G. Li, C. Chai, W. Li, and X. Qin, “Synthesizing natural language to visualization (NL2VIS) benchmarks from NL2SQL benchmarks,” in Proc. Int. ACM Conf. Management of Data (SIGMOD), 2021, pp. 1235–1247.
- [27] K. C. Cox, R. E. Grinter, S. Hibino, L. J. Jagadeesan, and D. Mantilla, “A multi-modal natural language interface to an information visualization environment,” International Journal of Speech Technology, vol. 4, no. 3, pp. 297–314, 2001.
- [28] T. Gao, M. Dontcheva, E. Adar, Z. Liu, and K. G. Karahalios, “DataTone: Managing ambiguity in natural language interfaces for data visualization,” in Proc. ACM Conf. Symposium on User Interface Software and Technology (UIST), 2015, pp. 489–500.
- [29] V. Setlur, S. E. Battersby, M. Tory, R. Gossweiler, and A. X. Chang, “Eviza: A natural language interface for visual analysis,” in Proc. ACM Conf. Symposium on User Interface Software and Technology (UIST), 2016, pp. 365–377.
- [30] T. J. Parr and R. W. Quong, “ANTLR: A predicated-LL(k) parser generator,” Software: Practice and Experience, vol. 25, no. 7, pp. 789–810, 1995.
- [31] B. Yu and C. T. Silva, “FlowSense: A natural language interface for visual data exploration within a dataflow system,” IEEE Transactions on Visualization and Computer Graphics, vol. 26, no. 1, pp. 1–11, 2020.
- [32] Y. Zhang, P. Pasupat, and P. Liang, “Macro grammars and holistic triggering for efficient semantic parsing,” in Proc. Conf. on Empirical Methods in Natural Language Processing (EMNLP), 2017, pp. 1214–1223.
- [33] Y. Song, X. Zhao, R. C. Wong, and D. Jiang, “Rgvisnet: A hybrid retrieval-generation neural framework towards automatic data visualization generation,” in Proc. Int. ACM Conf. Management of Data (SIGMOD), 2022, pp. 1646–1655.
- [34] Q. Chen, S. Pailoor, C. Barnaby, A. Criswell, C. Wang, G. Durrett, and I. Dillig, “Type-directed synthesis of visualizations from natural language queries,” Proc. ACM Program. Lang., vol. 6, no. OOPSLA2, pp. 532–559, 2022.
- [35] J. Devlin, M. Chang, K. Lee, and K. Toutanova, “BERT: pre-training of deep bidirectional transformers for language understanding,” in Proc. Conf. North American Chapter of the Association for Computational Linguistics: Human Language Technologies(NAACL-HLT), 2019, pp. 4171–4186.
- [36] A. Srinivasan, N. Nyapathy, B. Lee, S. M. Drucker, and J. T. Stasko, “Collecting and characterizing natural language utterances for specifying data visualizations,” in Proc. ACM Conf. Human Factors in Computing Systems (CHI), 2021, pp. 464:1–464:10.
- [37] C. Wang, J. Thompson, and B. Lee, “Data Formulator: Ai-powered concept-driven visualization authoring,” preprint arXiv:2309.10094, 2023.
- [38] L. Wang, S. Zhang, Y. Wang, E. Lim, and Y. Wang, “LLM4Vis: Explainable visualization recommendation using chatgpt,” preprint arXiv:2310.07652, 2023.
- [39] H. Ko, H. Jeon, G. Park, D. H. Kim, N. W. Kim, J. Kim, and J. Seo, “Natural language dataset generation framework for visualizations powered by large language models,” preprint arXiv:2309.10245, 2023.
- [40] F. Cassano, J. Gouwar, D. Nguyen, S. Nguyen, L. Phipps-Costin, D. Pinckney, M.-H. Yee, Y. Zi, C. J. Anderson, M. Q. Feldman et al., “MultiPL-E: A scalable and extensible approach to benchmarking neural code generation,” preprint arXiv:2208.08227, 2022.
- [41] J. Liu, C. S. Xia, Y. Wang, and L. Zhang, “Is your code generated by chatgpt really correct? rigorous evaluation of large language models for code generation,” preprint arXiv:2305.01210, 2023.
- [42] H. Ding, V. Kumar, Y. Tian, Z. Wang, R. Kwiatkowski, X. Li, M. K. Ramanathan, B. Ray, P. Bhatia, and S. Sengupta, “A static evaluation of code completion by large language models,” in Proc. Con. Association for Computational Linguistics (ACL), 2023, pp. 347–360.
- [43] Y. Fu, L. Ou, M. Chen, Y. Wan, H. Peng, and T. Khot, “Chain-of-thought hub: A continuous effort to measure large language models’ reasoning performance,” preprint arXiv:abs/2305.17306, 2023.
- [44] F. Xu, Q. Lin, J. Han, T. Zhao, J. Liu, and E. Cambria, “Are large language models really good logical reasoners? a comprehensive evaluation from deductive, inductive and abductive views,” preprint arXiv:2306.09841, 2023.
- [45] T. Wei, J. Luan, W. Liu, S. Dong, and B. Wang, “CMATH: can your language model pass chinese elementary school math test?” 2023.
- [46] S. Frieder, L. Pinchetti, A. Chevalier, R.-R. Griffiths, T. Salvatori, T. Lukasiewicz, P. C. Petersen, and J. Berner, “Mathematical Capabilities of ChatGPT,” preprint arXiv:2301.13867, 2023.
- [47] Y. Wu, F. Jia, S. Zhang, H. Li, E. Zhu, Y. Wang, Y. T. Lee, R. Peng, Q. Wu, and C. Wang, “An empirical study on challenging math problem solving with GPT-4,” preprint arXiv:2306.01337, 2023.
- [48] K. M. Collins, A. Q. Jiang, S. Frieder, L. Wong, M. Zilka, U. Bhatt, T. Lukasiewicz, Y. Wu, J. B. Tenenbaum, W. Hart, T. Gowers, W. Li, A. Weller, and M. Jamnik, “Evaluating language models for mathematics through interactions,” preprint arXiv:2306.01694, 2023.
- [49] X. Dao and N. Le, “Investigating the effectiveness of chatgpt in mathematical reasoning and problem solving: Evidence from the vietnamese national high school graduation examination,” preprint arXiv:2306.06331, 2023.
- [50] T. Kojima, S. S. Gu, M. Reid, Y. Matsuo, and Y. Iwasawa, “Large language models are zero-shot reasoners,” Advances in neural information processing systems, vol. 35, pp. 22 199–22 213, 2022.
- [51] Y. Fu, H. Peng, A. Sabharwal, P. Clark, and T. Khot, “Complexity-based prompting for multi-step reasoning,” in Proc. Int. Con. Learning Representations (ICLR), 2023.
- [52] P. Lu, L. Qiu, K. Chang, Y. N. Wu, S. Zhu, T. Rajpurohit, P. Clark, and A. Kalyan, “Dynamic prompt learning via policy gradient for semi-structured mathematical reasoning,” in Proc. Int. Con. Learning Representations (ICLR), 2023.
- [53] X. Wang, J. Wei, D. Schuurmans, Q. V. Le, E. H. Chi, S. Narang, A. Chowdhery, and D. Zhou, “Self-consistency improves chain of thought reasoning in language models,” in Proc. Int. Con. Learning Representations (ICLR), 2023.
- [54] Y. Weng, M. Zhu, F. Xia, B. Li, S. He, K. Liu, and J. Zhao, “Large Language Models are Better Reasoners with Self-Verification,” preprint arXiv:2212.09561, 2023.
- [55] Y. Li, Z. Lin, S. Zhang, Q. Fu, B. Chen, J.-G. Lou, and W. Chen, “Making language models better reasoners with step-aware verifier,” in Proc. Con. Association for Computational Linguistics (ACL), 2023, pp. 5315–5333.
- [56] A. Creswell, M. Shanahan, and I. Higgins, “Selection-Inference: Exploiting Large Language Models for Interpretable Logical Reasoning,” arXiv:2205.09712, 2022.
- [57] L. Wang, W. Xu, Y. Lan, Z. Hu, Y. Lan, R. K. Lee, and E. Lim, “Plan-and-solve prompting: Improving zero-shot chain-of-thought reasoning by large language models,” in Proc. Con. Association for Computational Linguistics (ACL), 2023, pp. 2609–2634.
- [58] P. Yin, W. Li, K. Xiao, A. Rao, Y. Wen, K. Shi, J. Howland, P. Bailey, M. Catasta, H. Michalewski, O. Polozov, and C. Sutton, “Natural language to code generation in interactive data science notebooks,” in Proc. Con. Association for Computational Linguistics (ACL), 2023, pp. 126–173.
- [59] A. Vaswani, N. Shazeer, N. Parmar, J. Uszkoreit, L. Jones, A. N. Gomez, L. Kaiser, and I. Polosukhin, “Attention is all you need,” in Proc. Conf. Neural Information Processing Systems (NeurIPS), 2017, pp. 5998–6008.
- [60] “Vega-lite document,” https://vega.github.io/vega-lite/docs/.
- [61] J. Mackinlay, “Automating the design of graphical presentations of relational information,” ACM Transactions on Graphics, vol. 5, no. 2, p. 110–141, 1986.
- [62] Y. Kim and J. Heer, “Assessing effects of task and data distribution on the effectiveness of visual encodings,” Computer Graphics Forum, vol. 37, no. 3, pp. 157–167, 2018.