PointCore: Efficient Unsupervised Point Cloud Anomaly Detector Using Local-Global Features
Abstract
Three-dimensional point cloud anomaly detection that aims to detect anomaly data points from a training set serves as the foundation for a variety of applications, including industrial inspection and autonomous driving. However, existing point cloud anomaly detection methods often incorporate multiple feature memory banks to fully preserve local and global representations, which comes at the high cost of computational complexity and mismatches between features. To address that, we propose an unsupervised point cloud anomaly detection framework based on joint local-global features, termed PointCore. To be specific, PointCore only requires a single memory bank to store local (coordinate) and global (PointMAE) representations and different priorities are assigned to these local-global features, thereby reducing the computational cost and mismatching disturbance in inference. Furthermore, to robust against the outliers, a normalization ranking method is introduced to not only adjust values of different scales to a notionally common scale, but also transform densely-distributed data into a uniform distribution. Extensive experiments on Real3D-AD dataset demonstrate that PointCore achieves competitive inference time and the best performance in both detection and localization as compared to the state-of-the-art Reg3D-AD approach and several competitors.
Index Terms:
3D point cloud, anomaly detection, unsupervised learningI Introduction
Anomaly detection aims to find the abnormal region of products and plays an important role in various fields, such as industrial quality inspection [1, 2], and autonomous driving [3, 4]. Current anomaly detection methods [5, 6, 7] are mostly unsupervised and they target on two-dimensional (2D) images, where models are typically trained on images with well-studied architectures. For 3D point cloud-based anomaly detection task, there remains relatively unexplored within the current literature. Compared with 2D images, 3D point clouds have the advantage of richer structural information, which, however, gets along with but disorder, highly sparse and irregular distribution. To process point clouds distinctly, various handcrafted or deep learning-based feature descriptors at different scales are applied.
Recently, a large-scale, high-resolution 3D anomaly detection dataset, termed Real3D-AD [8], was provided. The objects in Real3D-AD dataset have 0.001mm-0.0015mm resolution, 360 degree coverage and perfect prototype. In [8], the authors applied PatchCore [9] from image anomaly detection to point cloud anomaly detection, and developed a general-purposed registration-based point cloud anomaly detector, dubbed as Reg3D-AD. Reg3D-AD employs a dual-feature representation approach to preserve the local and global features of training prototypes, which achieves remarkable detection accuracy but slow inference. Current point cloud anomaly detectors can be categorized into twofolds: (1) Reconstruction-based methods, which reconstruct the input point cloud data via autoencoder [10, 11, 12] and identify anomalies by comparing the deviation between the original and reconstructed data. However, these approaches are sensitive to the resolution of point clouds, leading to slower inference speed and worse accuracy. (2) Memory bank-based approaches [8, 13], where memory banks are useful for storing representative features to implicitly build a normal distribution and looking for the out-of-distributed defects. Compared with the former, using a pretrained feature extractor directly to construct a memory bank enjoys fast training speed and is not affected by the resolution of point clouds. Besides that, existing point cloud anomaly detectors [8, 14] often incorporate multiple feature memory banks to fully preserve local and global representations, which comes at the high cost of computational complexity and mismatching between features.
To address the above issues, we propose an unsupervised point cloud anomaly detection framework based on joint local-global features, termed PointCore. To be specific, our contributions are summarized as follows:
-
1.
PointCore only requires a memory bank to store local-global representations and different priorities are assigned to these local-global features to reduce the computational cost and mismatching disturbance for inference.
-
2.
We propose a ranking-based normalization method to eliminate the distribution differences among various anomaly scores and apply the point-to-plane Iterative Closest Points(point-plane ICP) algorithm to perform local optimization of point cloud registration results for robust decision-making.
-
3.
Extensive experiments on Real3D-AD dataset demonstrate that PointCore achieves competitive inference time and the best performance in both detection and localization as compared to the state-of-the-art Reg3D-AD approach and several competitors.

II Method
II-A Global and Local Registration
Similar to the Reg3D-AD model [8], we apply the FPFH [15] feature descriptor and the random sample consensus (RANSAC) algorithm to achieve global registration of point clouds. To enhance the stability of point cloud registration, a point-plane ICP [16] is introduced to locally optimize the outputs from glocal registration. Suppose two point clouds (source point cloud) and (target point cloud) need to be registered, the procedure is as follows:
-
1.
Apply rotation matrix and translation vector obtained from the global registration to transform .
-
2.
Search in such that closest to in , where the normal vector of is denoted as .
-
3.
Assume optimal rotation Euler angles , we have . The rotation matrix R can be approximately expressed as:
(1) -
4.
Assume the optimal translation vector is . The loss function is shown as a least squares problem via Moore–Penrose inverse.
(2) -
5.
Apply the computed rotation matrix and translation vector to transform , and repeat steps 2-5 until the loss value is below a predefined threshold. Note that the target point cloud for registration is fixed.
II-B Memory Bank Construction
Coordinate Sampling. We employ a greedy down-sampling algorithm [17] to sample the point clouds. Given the point clouds , and the point set , is the number of points in . We aim to obtain uniform points from . The specific procedure is as follows:
-
1.
Randomly select points from to construct the initial point set .
-
2.
Calculate distances between and to obtain a matrix with dimensions .
-
3.
Calculate the mean for each row of the matrix to obtain .
-
4.
Locate the maximum value in the matrix , and add the corresponding point to . Repeat steps 2-4 until the number of elements in equals .
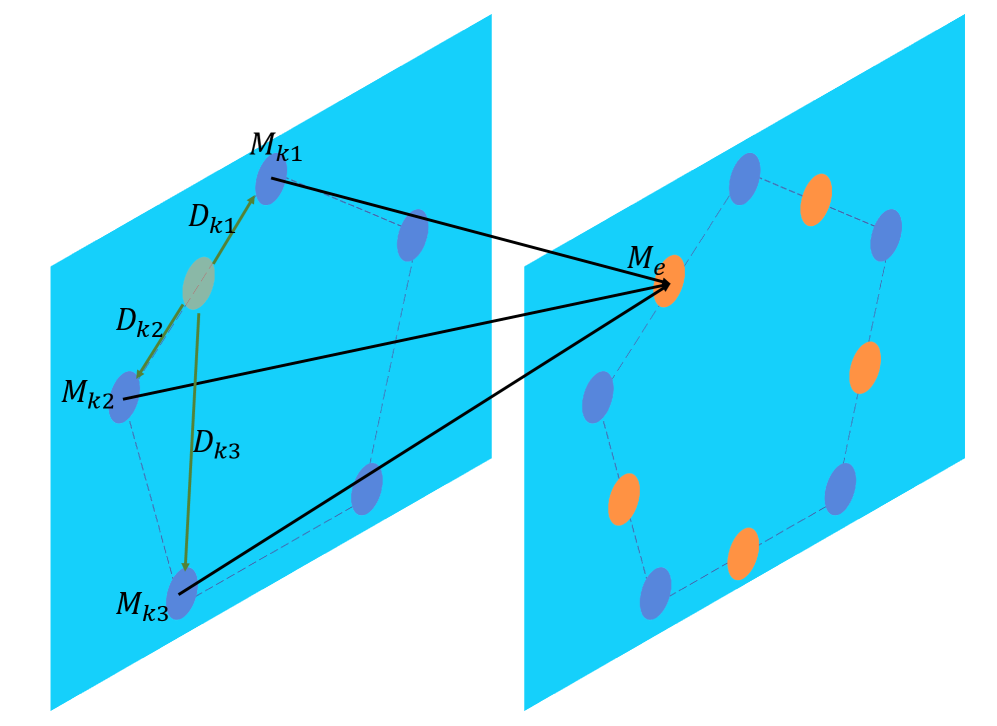
Point Feature Interpolation. A point transformer (PointMAE) [18, 19] pretrained on the ShapeNet [20] dataset is used as our 3D feature extractor. For each point cloud, we use coordinates from the coordinate sampling stage as the center points of groups. Each central point forms a memory element, which is bound with coordinates and PointMAE features. These elements constitute the memory bank in Fig. 2. To reduce the computational complexity of PointMAE features computation in inference, it is necessary to downsample the point cloud coordinates. Therefore, we perform point feature interpolation further to assign a PointMAE feature value to each coordinate in the feature bank. The feature interpolation method is shown in Fig. 3.
Given a point set with all center point coordinates, the corresponding PointMAE feature set is . Taking a non-central point as an example, we use the k-nearest neighbors algorithm to obtain three nearest neighbors in the point set . The corresponding Euclidean distances and PointMAE feature values are and , respectively. By using eq. (3), we obtain the PointMAE feature for . This process is repeated until all non-central points obtain their corresponding PointMAE features. The is computed by
| (3) |
| Category | BTF [14] | M3DM [21] | PatchCore [9] | PointCore | |||||
|---|---|---|---|---|---|---|---|---|---|
| Raw | FPFH | PointMAE | FPFH | FPFH+Raw | PointMAE | PointMAE+Raw | FPFH+Raw | PointMAE+Raw | |
| Airplane | 0.730 | 0.520 | 0.434 | 0.882 | 0.848 | 0.726 | 0.716 | 0.792 | 0.660 |
| Car | 0.647 | 0.560 | 0.541 | 0.590 | 0.777 | 0.498 | 0.697 | 0.871 | 0.866 |
| Candybar | 0.539 | 0.630 | 0.552 | 0.541 | 0.570 | 0.663 | 0.685 | 0.861 | 0.976 |
| Chicken | 0.789 | 0.432 | 0.683 | 0.837 | 0.853 | 0.827 | 0.852 | 0.842 | 0.841 |
| Diamond | 0.707 | 0.545 | 0.602 | 0.574 | 0.784 | 0.783 | 0.900 | 0.847 | 0.963 |
| Duck | 0.691 | 0.784 | 0.433 | 0.546 | 0.628 | 0.489 | 0.584 | 0.642 | 0.684 |
| Fish | 0.602 | 0.549 | 0.540 | 0.675 | 0.837 | 0.630 | 0.915 | 0.915 | 0.993 |
| Gemstone | 0.686 | 0.648 | 0.644 | 0.370 | 0.359 | 0.374 | 0.417 | 0.477 | 0.535 |
| Seahorse | 0.596 | 0.779 | 0.495 | 0.505 | 0.767 | 0.539 | 0.762 | 0.954 | 0.973 |
| Shell | 0.396 | 0.754 | 0.694 | 0.589 | 0.663 | 0.501 | 0.583 | 0.853 | 0.882 |
| Starfish | 0.530 | 0.575 | 0.551 | 0.441 | 0.471 | 0.519 | 0.506 | 0.617 | 0.652 |
| Toffees | 0.703 | 0.462 | 0.450 | 0.565 | 0.626 | 0.585 | 0.827 | 0.728 | 0.929 |
| Average | 0.635 | 0.603 | 0.552 | 0.593 | 0.682 | 0.594 | 0.704 | 0.783 | 0.829 |
II-C Inference Block
Multi-feature Anomaly Score Calculation. The memory bank is composed of the element sets, that is, , where denotes the coordinates of the -th point, and represents the PointMAE feature of the -th point. The test feature bank is defined as , where is the coordinates of the -th point, and is the PointMAE feature of the -th point. For an element in , we use its coordinate information to find three nearest neighbors in , denoted as . Using Euclidean distance, their coordinate distances and feature distances are obtained. The final coordinate anomaly score is and PointMAE anomaly score is .
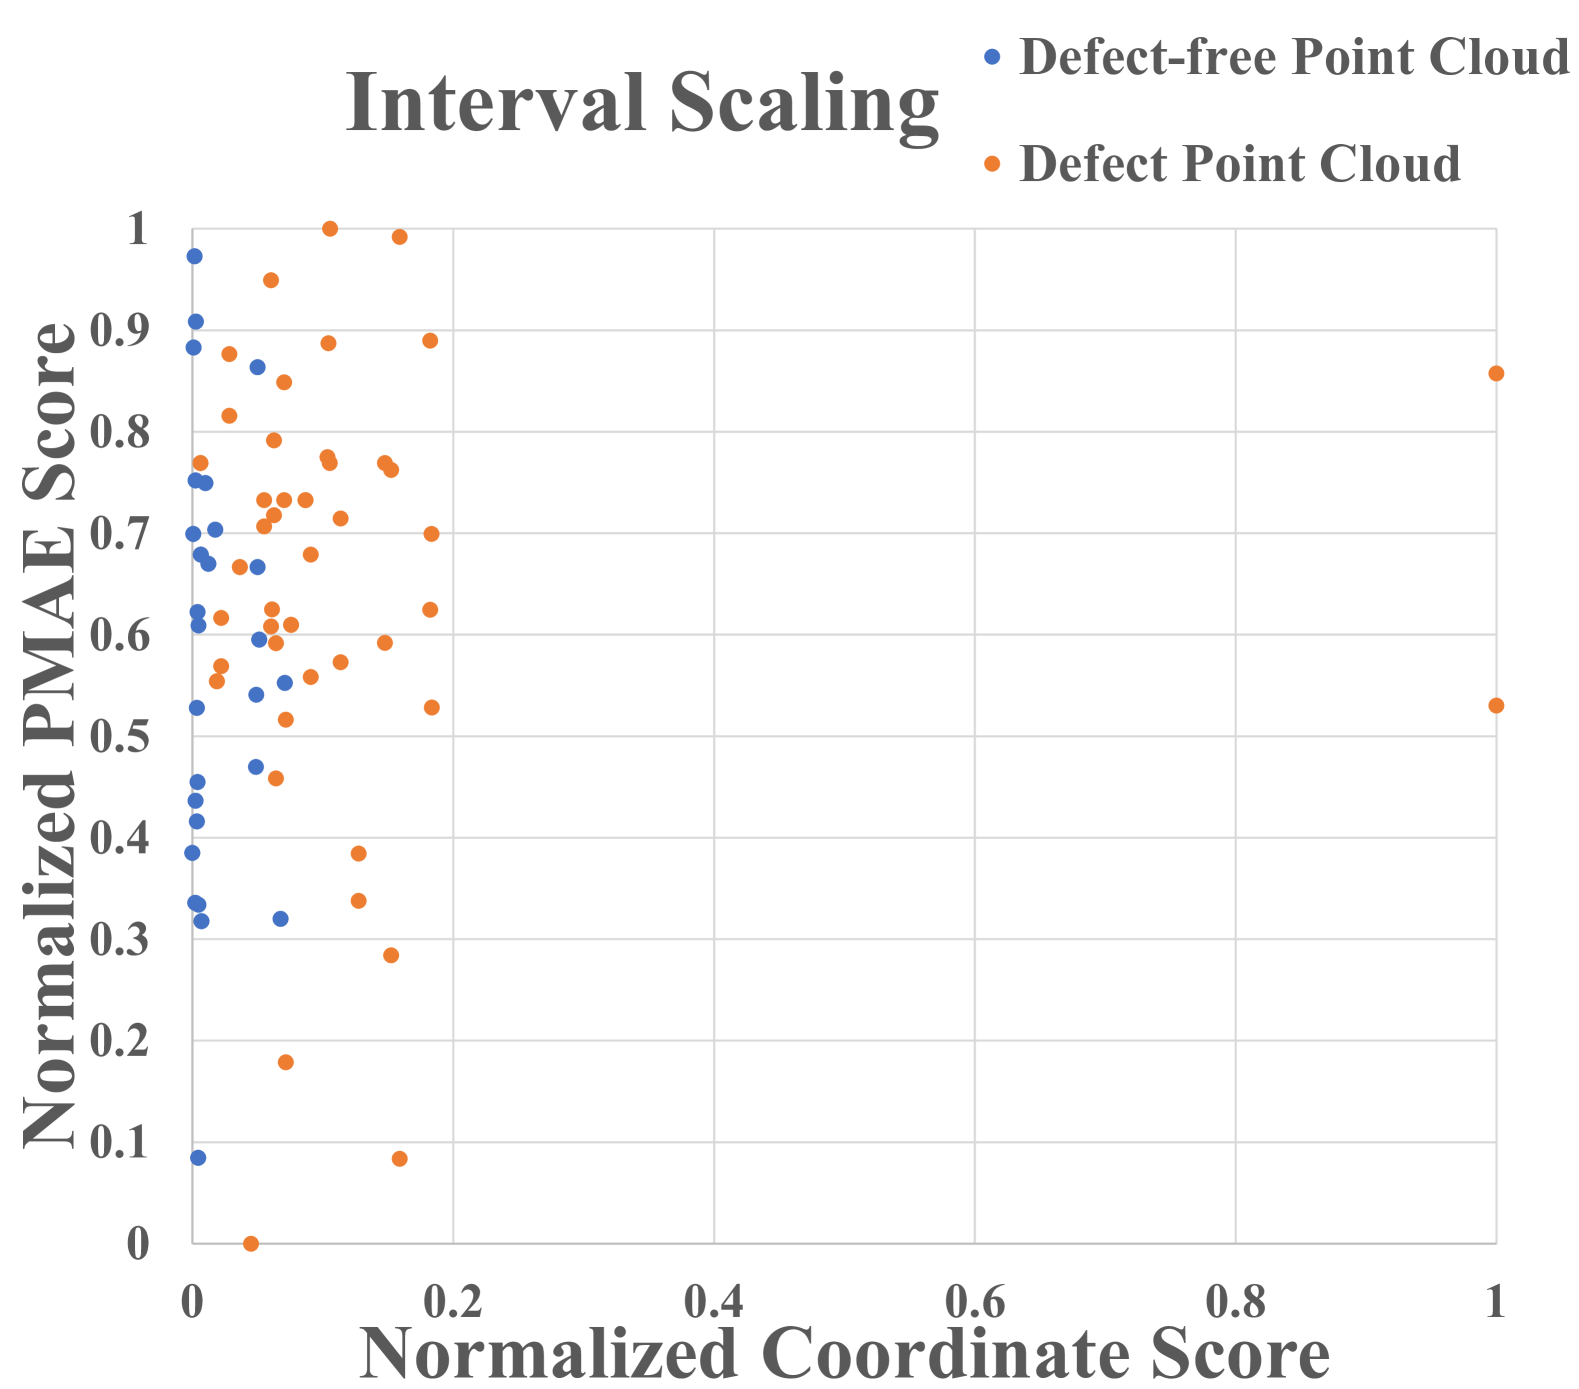
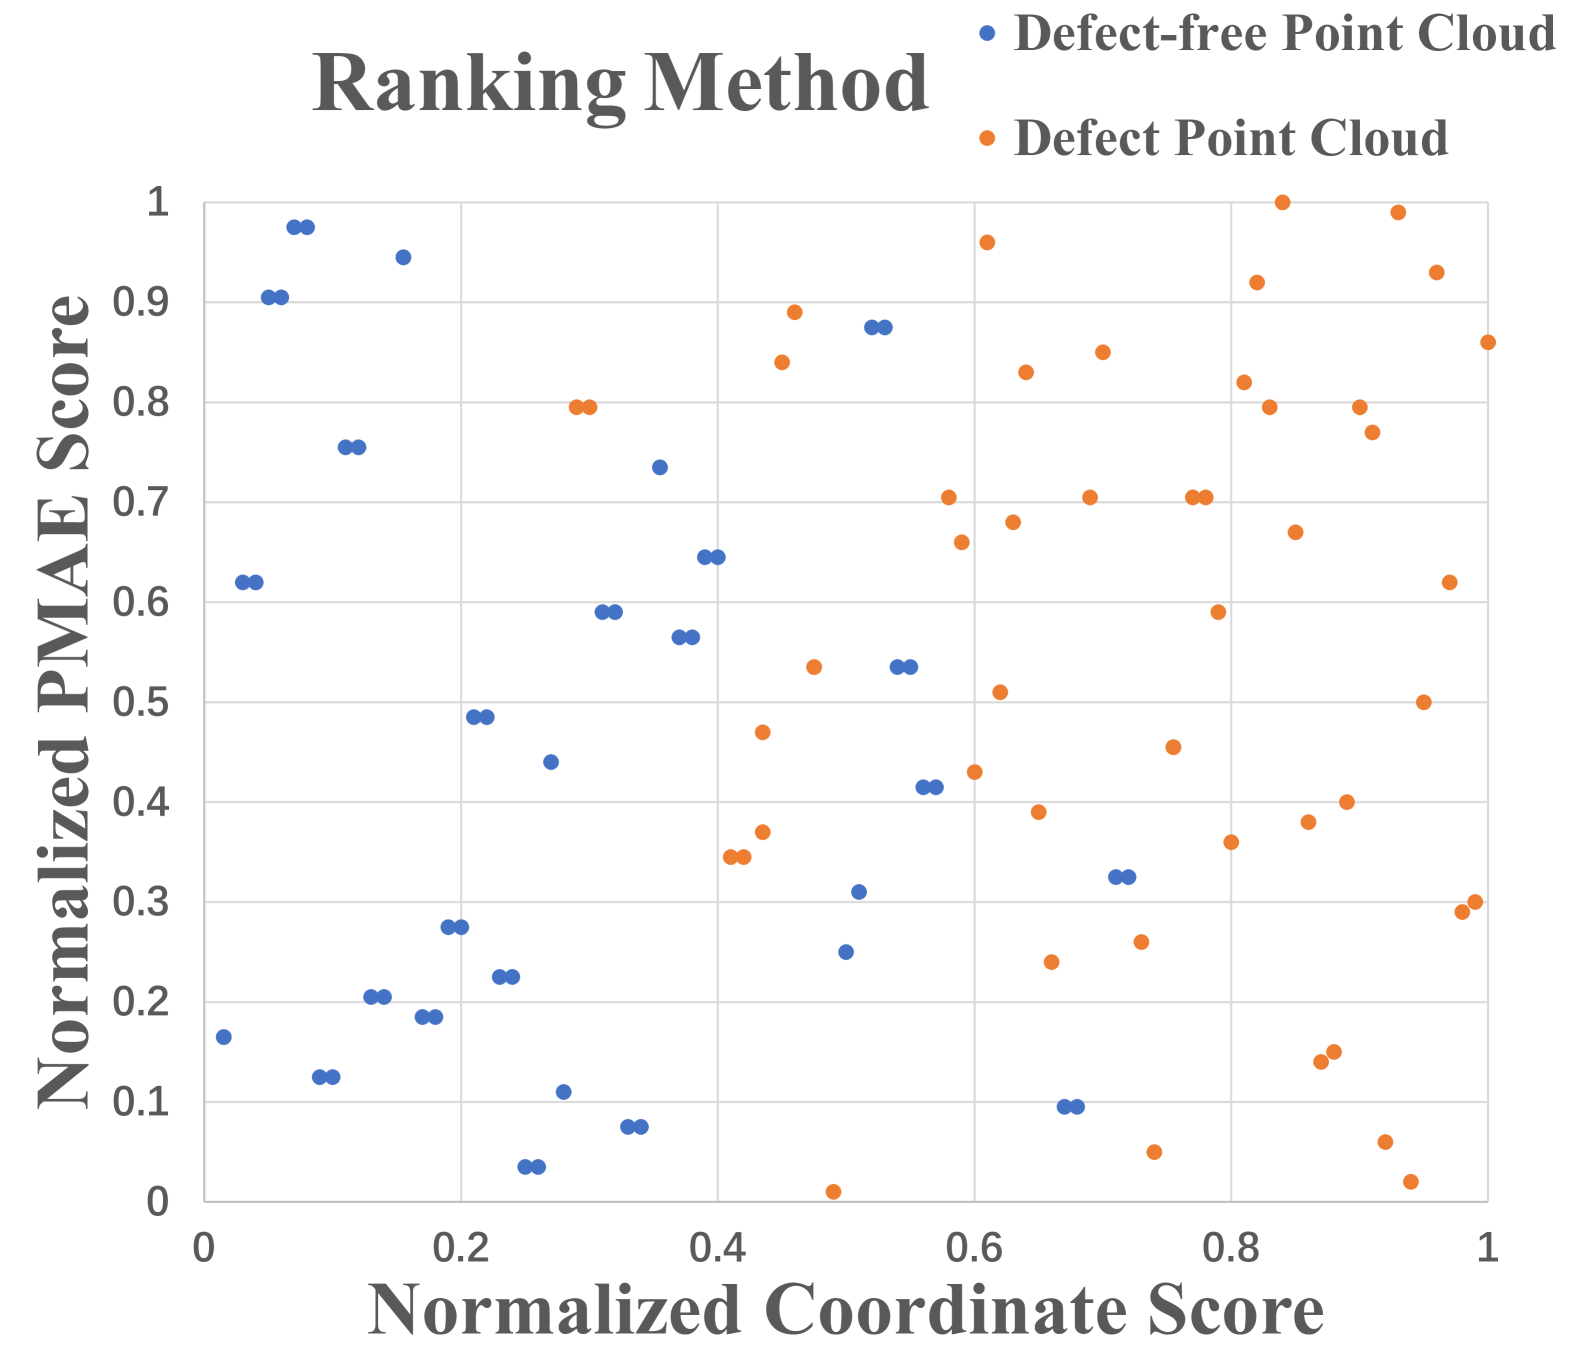
Ranking Block. Due to the differences in scale and distribution between two anomaly scores, both scores are necessary to normalize. Traditional normalization often employs the interval scaling method. For a set of data , the interval scaling process is . As depicted in Fig. 4, the interval scaling method will eliminate differences in scale between two anomaly scores but cannot address differences in distribution. When the coordinate anomaly score has two outliers, the final anomaly score will be much smaller than the PointMAE anomaly score. This has a significant impact on ensemble strategies based on arithmetic operations. To address that, we have designed a ranking-based normalization method, where obtains the ranking of each value in , and is the length of . That is:
| (4) |
III Experiments
III-A Experimental Details
Dataset. Real3D-AD [8] dataset comprises a total of 1,254 samples that are distributed across 12 distinct categories. Each training set for a specific category contains only four samples, similar to the few-shot scenario in 2D anomaly detection. These categories include Airplane, Candybar, Chicken, Diamond, Duck, Fish, Gemstone, Seahorse, Shell, Starfish, and Toffees. All these categories are toys from manufacturing lines. The objects in Real3D-AD dataset have 0.001mm-0.0015mm resolution, 360 degree coverage and perfect prototype.
Baselines. We compare with BTF [14], M3DM [21], PatchCore [9] to evaluate our performance. According to the used point cloud features, they can be grouped into 7 different baselines, namely, BTF (Raw), BTF (FPFH), M3DM (PointMAE), PatchCore (FPFH), PatchCore (FPFH+Raw), PatchCore (PointMAE), PatchCore (PointMAE+RAW), where Raw denotes using coordinate information. PointMAE and FPFH are two different feature descriptors.
Evaluation Metrics. All evaluation metrics are exactly the same as in [8]. We evaluate the object-level anomaly detection performance and the point-level anomaly detection performance via the area under the receiver operator curve (AUROC) and the area under the Precision-Recall curve (AUPR/AP). The higher the AUROC and AUPR, the better anomaly detection performance is. All experiments are conducted on 12th Gen Intel(R) Core(TM) i9-12900K CPU, 64G DDR4 SDRAM and GeForce RTX 3090 platform.
| Category | Reg3D-AD | PointCore | ||||||||
|---|---|---|---|---|---|---|---|---|---|---|
| O-AUROC | P-AUROC | O-AUPR | P-AUPR | Time(s) | O-AUROC | P-AUROC | O-AUPR | P-AUPR | Time(s) | |
| Airplane | 0.716 | 0.631 | 0.703 | 0.017 | 17.759 | 0.66 | 0.608 | 0.667 | 0.016 | 5.737 |
| Car | 0.697 | 0.718 | 0.753 | 0.135 | 12.938 | 0.866 | 0.706 | 0.862 | 0.088 | 4.830 |
| Candybar | 0.827 | 0.724 | 0.824 | 0.109 | 11.241 | 0.976 | 0.760 | 0.973 | 0.322 | 1.743 |
| Chicken | 0.852 | 0.676 | 0.884 | 0.044 | 18.944 | 0.841 | 0.780 | 0.863 | 0.413 | 9.043 |
| Diamond | 0.900 | 0.835 | 0.884 | 0.191 | 12.611 | 0.963 | 0.810 | 0.957 | 0.493 | 7.443 |
| Duck | 0.584 | 0.503 | 0.588 | 0.01 | 18.014 | 0.684 | 0.712 | 0.623 | 0.044 | 8.987 |
| Fish | 0.915 | 0.826 | 0.939 | 0.437 | 10.463 | 0.992 | 0.782 | 0.993 | 0.510 | 1.850 |
| Gemstone | 0.417 | 0.545 | 0.454 | 0.016 | 11.108 | 0.534 | 0.515 | 0.548 | 0.007 | 3.562 |
| Seahorse | 0.762 | 0.817 | 0.787 | 0.182 | 9.655 | 0.973 | 0.841 | 0.972 | 0.637 | 1.362 |
| Shell | 0.583 | 0.811 | 0.646 | 0.065 | 11.091 | 0.881 | 0.781 | 0.774 | 0.086 | 2.186 |
| Starfish | 0.506 | 0.617 | 0.491 | 0.039 | 10.145 | 0.652 | 0.736 | 0.585 | 0.048 | 1.652 |
| Toffees | 0.685 | 0.759 | 0.721 | 0.067 | 12.293 | 0.929 | 0.745 | 0.938 | 0.347 | 2.990 |
| Average | 0.704 | 0.705 | 0.723 | 0.109 | 13.022 | 0.829 | 0.731 | 0.813 | 0.251 | 4.282 |
III-B Anomaly Detection on Real3D-AD
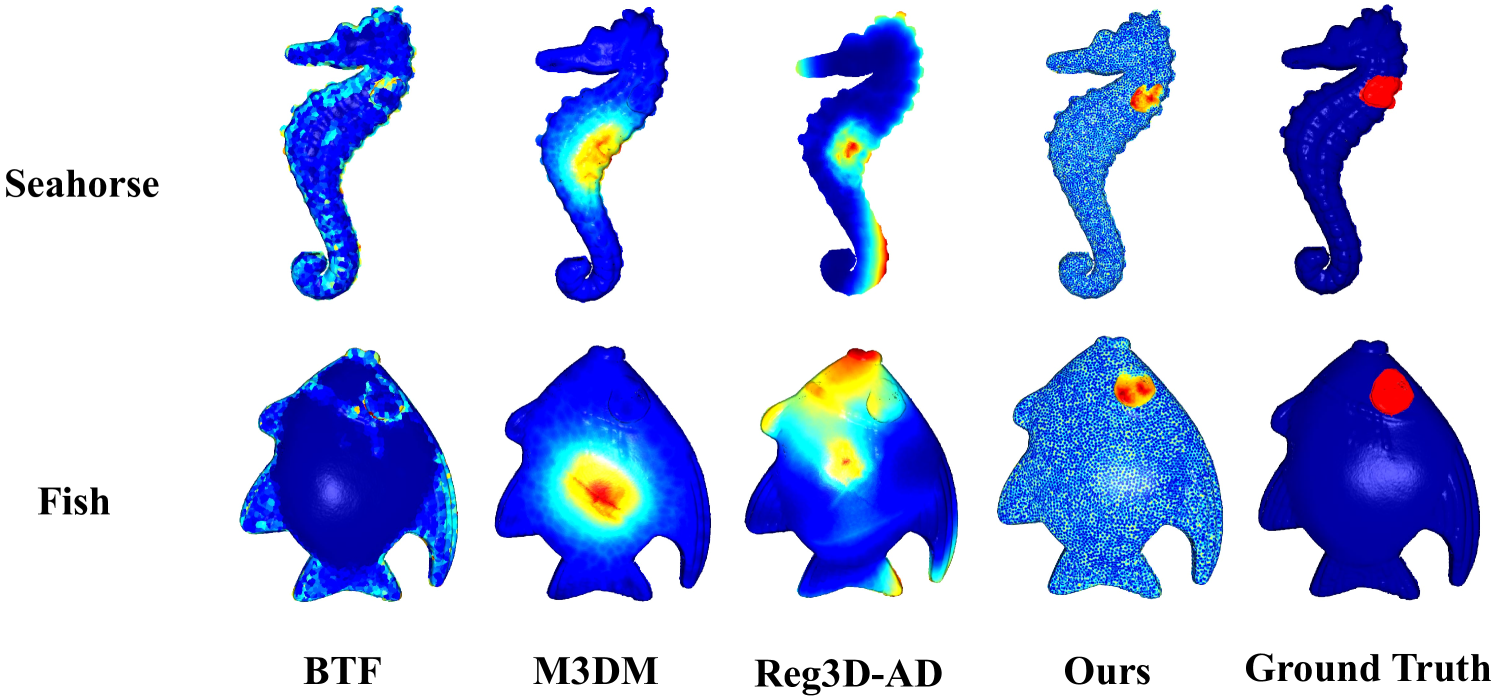
We compare our method with several methods on Real3D-AD, and Table I shows the anomaly detection results at O-AUROC(object-level AUROC). The FPFH and PointMAE features are combined with Raw feature, respectively. The results indicate that PointMAE-based combination performs better. For the proposed PointCore architecture, the coordinate information of point cloud is indispensable. Table II presents a more comprehensive comparison between our model and the SOTA. PointCore has achieved competitive performance across all metrics, including a 17.75% improvement in O-AUROC metric. The performance in point-level AUROC (P-AUROC), object-level AUPR (O-AUPR), and point-level AUPR (P-AUPR) further demonstrate the superior performance of our proposal in anomaly detection.
| Method | PointCore | BTF | M3DM | Reg3D-AD |
|---|---|---|---|---|
| O-AUROC | 0.829 | 0.603 | 0.552 | 0.704 |
| P-AUROC | 0.731 | 0.571 | 0.637 | 0.705 |
| Time(s) | 4.282 | 3.882 | 5.061 | 13.022 |
The comparisons of inference time among BTF, M3DM and PatchCore are implemented, as tabulated in Table III. As can be seen, BTF presented in Table III, albeit fast, show mediocre to poor performance in O-AUROC and P-AUROC. Ours is the fastest excluding BTF.
![[Uncaptioned image]](x6.png)
III-C Ablation Studies
In this section, we ablate our design choices on the Reg3D-AD under 3-view settings in Table. IV.
Effectiveness of Local Optimization (LO). The Reg3D-AD model employs the FPFH+RANSAC method [15] for registration, where the RANSAC algorithm iteratively finds the optimal pose matrix. However, the random points selection of RANSAC in each iteration leads to significant variance in the final registration results. We conducted 20 experiments on a pair point cloud from the Toffees dataset. The results reveal substantial variations even with identical parameters. The local optimization algorithm is introduced to improve the stability of the registration process. The variance in Euler angles decreased from to , achieving a score of . Regarding the local optimization method, we conduct registration error tests on point-point ICP and point-plane ICP algorithms under different levels of Gaussian noise. The results show that the point-plane ICP registration method often yields more accurate results under lower noise levels. The anomaly samples in the Reg3D-AD dataset resemble a point cloud with low noise levels. The point-plane ICP is chosen as the local optimization method.
Effectiveness of PointCore Architecture. Compared to the Reg3D-AD architecture, PointCore architecture can better leverage the coordinate information of point clouds to achieve faster and more accurate point cloud anomaly detection. Regarding speed, we accelerate the inference process by binding the coordinate information and PointMAE feature information of points. This reduces the substantial computational cost introduced by the subsequent PointMAE searching for nearest neighbors. In contrast, the Reg3D-AD architecture stores the coordinate information and PointMAE feature information separately in different memory banks. Each coordinate and PointMAE must find their nearest neighbors in the corresponding memory bank during inference. This poses a significant computational challenge, especially with the 1154 dimensions of PointMAE feature. Regarding accuracy, we enhance the dominance of coordinate information to avoid obvious mismatches in PointMAE features. Specifically, in the Reg3D-AD architecture, the PointMAE features of test point cloud must find the nearest neighbors in the PointMAE memory bank without utilizing any coordinate information. This process leads to erroneous matches between locally similar groups. By strictly limiting the matching range of coordinates, we significantly reduce the probability of mismatches.
Effectiveness of Ranking Block (RB). From Table. IV, the ranking block significantly improves object-level AUROC and object-level AUPR. However, the improvement in point-level metric is limited. This is because the ranking block is primarily employed to mitigate the substantial impact of outliers on different anomaly score distributions. It plays a significant balancing role for object-level anomaly scores, where the sample size is relatively small. In contrast, point-level anomaly scores inherently have many samples, and the influence of outliers is minimal.
IV Conclusion
We propose an unsupervised point cloud anomaly detector, termed PointCore, which is developed on single memory bank with local-global features to store multi-scale information of input point clouds. Extensive experiments on Real3D-AD dataset demonstrate that ours has better recall rate and lower false-positive rate, which is preferable in real applications requiring precise detection of defective samples. Furthermore, the proposed framework is efficient since both the local-global feature memory bank and the multi-feature anomaly score calculation reduce the computational cost.
References
- [1] D. Carrera, F. Manganini, G. Boracchi, and E. Lanzarone, “Defect detection in sem images of nanofibrous materials,” IEEE Transactions on Industrial Informatics, p. 551–561, Apr 2017.
- [2] K. Song and Y. Yan, “A noise robust method based on completed local binary patterns for hot-rolled steel strip surface defects,” Applied Surface Science, p. 858–864, Nov 2013.
- [3] D. Hendrycks, S. Basart, M. Mazeika, M. Mostajabi, J. Steinhardt, and D. Song, “A benchmark for anomaly segmentation,” arXiv preprint arXiv:1911.11132, vol. 1, no. 2, p. 5, 2019.
- [4] Y. Xu, W. Hu, S. Wang, X. Zhang, S. Wang, S. Ma, Z. Guo, and W. Gao, “Predictive generalized graph fourier transform for attribute compression of dynamic point clouds,” IEEE Transactions on Circuits and Systems for Video Technology, vol. 31, no. 5, pp. 1968–1982, 2020.
- [5] V. Zavrtanik, M. Kristan, and D. Skočaj, “Draem – a discriminatively trained reconstruction embedding for surface anomaly detection,” International Conference on Computer Vision, International Conference on Computer Vision, Aug 2021.
- [6] J. T. Zhou, L. Zhang, Z. Fang, J. Du, X. Peng, and Y. Xiao, “Attention-driven loss for anomaly detection in video surveillance,” IEEE transactions on circuits and systems for video technology, vol. 30, no. 12, pp. 4639–4647, 2019.
- [7] Y. Wang, Q. Liu, and Y. Lei, “Ted-net: Dispersal attention for perceiving interaction region in indirectly-contact hoi detection,” IEEE Transactions on Circuits and Systems for Video Technology, pp. 1–1, 2024.
- [8] J. Liu, G. Xie, R. Chen, X. Li, J. Wang, Y. Liu, C. Wang, and F. Zheng, “Real3d-ad: A dataset of point cloud anomaly detection,” Advances in Neural Information Processing Systems, vol. 36, 2024.
- [9] K. Roth, L. Pemula, J. Zepeda, B. Scholkopf, T. Brox, and P. Gehler, “Towards total recall in industrial anomaly detection,” in 2022 IEEE/CVF Conference on Computer Vision and Pattern Recognition (CVPR), Jun 2022.
- [10] W. Li and X. Xu, “Towards scalable 3d anomaly detection and localization: A benchmark via 3d anomaly synthesis and a self-supervised learning network,” arXiv preprint arXiv:2311.14897, 2023.
- [11] W. Zhu, Z. Ma, Y. Xu, L. Li, and Z. Li, “View-dependent dynamic point cloud compression,” IEEE Transactions on Circuits and Systems for Video Technology, vol. 31, no. 2, pp. 765–781, 2020.
- [12] H. Peng and G. Tong, “Class-aware 3d detector from point clouds with partial knowledge diffusion and center-weighted iou,” IEEE Transactions on Circuits and Systems for Video Technology, 2023.
- [13] H. Xiao, Y. Li, W. Kang, and Q. Wu, “Distinguishing and matching-aware unsupervised point cloud completion,” IEEE Transactions on Circuits and Systems for Video Technology, 2023.
- [14] E. Horwitz and Y. Hoshen, “Back to the feature: classical 3d features are (almost) all you need for 3d anomaly detection,” in Proceedings of the IEEE/CVF Conference on Computer Vision and Pattern Recognition, 2023, pp. 2967–2976.
- [15] R. B. Rusu, N. Blodow, and M. Beetz, “Fast point feature histograms (fpfh) for 3d registration,” in 2009 IEEE International Conference on Robotics and Automation, 2009, pp. 3212–3217.
- [16] S. Rusinkiewicz and M. Levoy, “Efficient variants of the icp algorithm,” in Proceedings Third International Conference on 3-D Digital Imaging and Modeling, 2001, pp. 145–152.
- [17] L. Yang and W. Guo, “Greedy local-set based sampling and reconstruction for band-limited graph signals,” in 2016 23rd International Conference on Telecommunications (ICT), 2016, pp. 1–5.
- [18] Y. Pang, W. Wang, F. E. Tay, W. Liu, Y. Tian, and L. Yuan, “Masked autoencoders for point cloud self-supervised learning,” in European conference on computer vision. Springer, 2022, pp. 604–621.
- [19] H. Zhao, L. Jiang, J. Jia, P. Torr, and V. Koltun, “Point transformer.” in 2021 IEEE/CVF International Conference on Computer Vision (ICCV), Oct 2021.
- [20] A. Chang, T. Funkhouser, L. Guibas, P. Hanrahan, Q. Huang, Z. Li, S. Savarese, M. Savva, S. Song, H. Su, J. Xiao, L. Yi, and F. Yu, “Shapenet: An information-rich 3d model repository,” arXiv: Graphics,arXiv: Graphics, Dec 2015.
- [21] Y. Wang, J. Peng, J. Zhang, R. Yi, Y. Wang, and C. Wang, “Multimodal industrial anomaly detection via hybrid fusion,” in Proceedings of the IEEE/CVF Conference on Computer Vision and Pattern Recognition, 2023, pp. 8032–8041.