RegMix: Data Mixture as Regression for
Language Model Pre-training
Abstract
The data mixture for large language model pre-training significantly impacts performance, yet how to determine an effective mixture remains unclear. We propose RegMix to automatically identify a high-performing data mixture by formulating it as a regression task. RegMix involves training a set of small models with diverse data mixtures and fitting a regression model to predict their performance given their respective mixtures. With the fitted regression model, we simulate the top-ranked mixture and use it to train a large-scale model with orders of magnitude more compute. To empirically validate RegMix, we train 512 models with 1M parameters for 1B tokens of different mixtures to fit the regression model and find the optimal mixture. Using this mixture we train a 1B parameter model for 25B tokens (i.e. larger and longer) which we find performs best among 64 candidate 1B parameter models with other mixtures. Further, our method demonstrates superior performance compared to human selection and achieves results that match or surpass DoReMi, while utilizing only 10% of the compute budget. Our experiments also show that (1) Data mixtures significantly impact performance with single-task performance variations of up to 14.6%; (2) Web corpora rather than data perceived as high-quality like Wikipedia have the strongest positive correlation with downstream performance; (3) Domains interact in complex ways often contradicting common sense, thus automatic approaches like RegMix are needed; (4) Data mixture effects transcend scaling laws, and our approach captures the complexity by considering all domains together. Our code is available at https://github.com/sail-sg/regmix.
1 Introduction
The availability of large-scale public datasets has been a key factor enabling the creation of large language models (LLMs). Most data is available on the Internet and includes academic papers (e.g. arXiv), books (e.g. Project Gutenberg), and code (e.g. GitHub). For the creation of one of the first LLMs, GPT-3 [7], the authors had already recognized the importance of selecting the best data for training, and thus they decided to upsample Wikipedia due to its perceived high quality. However, such manual data selection is not scalable and may lead to a suboptimal selection [3]. As the size and diversity of data used for LLM pre-training continue to grow, determining the optimal data mixture becomes increasingly challenging. It gives rise to the critical research question: How can we select the optimal data mixture in a scalable and efficient manner?
Prior work [64, 16, 2] employs small-scale models (“proxy models”) to predict the domain weights for large-scale language models. These works train proxy models with a substantial number of tokens (e.g., 100B), sometimes even the same number as used for training LLMs, and dynamically adjust the data allocation strategy by monitoring the training dynamics. However, these approaches become inefficient as the training data used for pre-training LLMs continues to grow. Training a proxy model for current models, such as Llama-3, would require using up to 15T tokens [1] with current approaches, which is likely too expensive and too slow to make it worthwhile 111These approaches often suffer from instability issues. Details can be found in Appendix F..
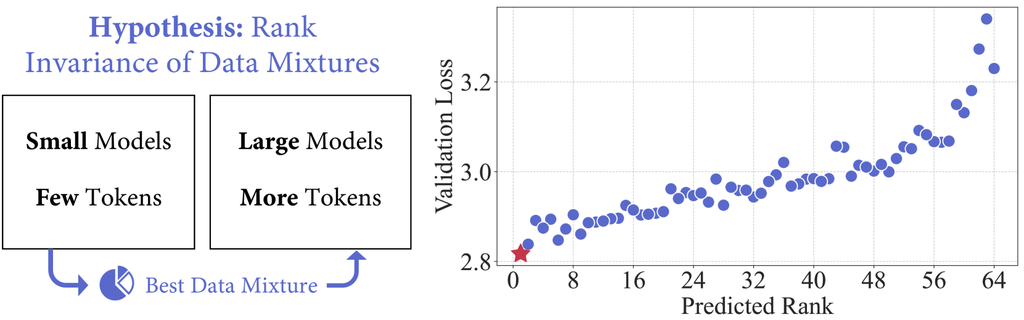
In this work, we argue that training small models on a limited set of tokens is sufficient to predict an effective data mixture for LLM training. Our key assumption is the rank invariance of data mixtures, which posits that the relative ranking of data mixtures in terms of their impact on model performance is consistent across different model sizes and numbers of training tokens. Under this assumption, the key challenge lies in discovering the top-ranked data mixture from the near-infinite number of potential data mixtures. To do so, we treat the data mixture selection as a regression task. Rather than exhaustively training small models with every possible mixture, we train only a set of small models, each with a unique data mixture. Based on the performance of these models and their mixtures, we fit a regression model to predict the performance of other data mixtures. Our approach is significantly more scalable than prior work, as it allows for parallel training of small proxy models rather than training a single model for a long time. Further, the regression model provides insights into domain interactions that can facilitate understanding and data curation.
To validate RegMix, we train models with 1M and 1B parameters222Our model sizes mentioned in this paper refer to the number of non-embedding parameters, as embedding parameters account for a disproportionately large portion in smaller models. with different data mixtures. By training 512 models with 1M parameters on 1B tokens333The estimated FLOPs for training 1M models is nearly 2% of the FLOPs required for one 1B model., we are able to predict the optimal data mixture among 64 models that are larger (1B parameters) and trained longer (25B tokens) as depicted in Figure 1. Moreover, the optimized data mixture using RegMix yields a better model than human selection, and achieves performance on par with the flagship DoReMi method [64] despite it requiring less total compute and allowing for parallel training. We also find that (1) Data mixture significantly impacts downstream performance, resulting in substantial differences of up to 14.6% in single-task performance; (2) General web corpora (e.g., CommonCrawl), rather than Wikipedia, exhibit the strongest positive correlation with improved performance across downstream tasks; (3) The interactions between domains are complex and often contradict intuition, highlighting the need for automated approaches like RegMix. (4) Data mixture effects transcend scaling laws, and RegMix captures the complexity by considering all domains together.
2 Related work
Data selection and mixture is concerned with curating data to optimize some goals, usually model performance [29, 3]. Prior methods can be categorized into: (1) Token-level selection is the most fine-grained level of selection dealing with the filtering of tokens [31]. (2) Sample-level selection is about choosing individual training examples. It is commonly employed for selecting fine-tuning data [57, 13, 65, 15, 63, 33, 8, 25, 37, 49, 67]. For the pre-training of LLMs, most methods rely on heuristics [46, 54, 55], but there have been some learned approaches using optimization algorithms [10, 40, 53, 69], model perplexity [35, 41], or LLMs to inform the sample selection process [61, 48, 72]. (3) Group-level selection assumes the data can be grouped into pools that are then optimally mixed. While early work again relies on manual mixtures [18, 7], learned mixtures have become more common [3]. Learned approaches either leverage proxy models to determine fixed weights for each group (“offline selection”) [46, 64, 16] or dynamically adjust the weights during training of the final model (“online selection”) [9]. Our approach, RegMix, is an offline group-level selection method. Different from the flagship algorithm in this category, DoReMi [64], RegMix does not require training a single model for hundreds of thousands of steps, but instead a few small models for short durations. As these can be trained in parallel, our approach is more scalable, while also yielding better weights leading to a more performant final model.
Data scaling laws explore interactions of data quantity, quality, and mixing proportions, as LLMs are scaled up. Muennighoff et al. [41] introduce scaling laws for data-constrained scenarios and Goyal et al. [21] try to extend this approach to deal with multiple data pools. Prior research has confirmed that different datasets require different scaling [23, 42], thus Ye et al. [68] and Ge et al. [20] propose functional relationships to predict the impact of mixtures on language modeling loss. Some work has investigated optimal mixtures during continued pre-training rather than from scratch training [45, 14]. While most of these works focus on validation loss, others investigate downstream performance and develop predictive relations with loss [17, 66, 62]. Different from data scaling work that attempt to find an analytical scaling function [23], RegMix directly optimizes the target metric using regression models. RegMix is designed for from-scratch pre-training. In line with previous research, we also find strong correlations between loss and downstream performance, especially for loss on web corpora.
3 RegMix: Data mixture as regression
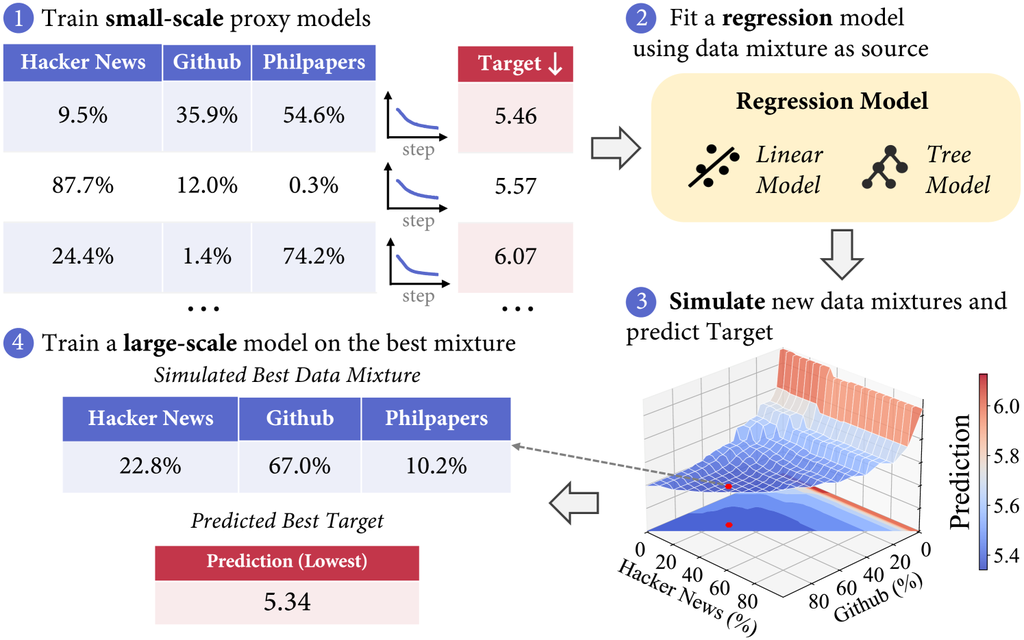
As illustrated in Figure 2, our method involves four key steps: (1) Generate random data mixtures and train small-scale proxy models on these mixtures. (2) Fit a linear regression model using the mixtures as features and the target value as the label. (3) Simulate the data mixture space on a larger scale and leverage the regression model to identify the best mixture for the target value. (4) Train a large-scale model using the simulated best data mixture.
3.1 Train small-scale proxy models
The first step is to train a set of small-scale proxy models on multiple different data mixtures. To reduce the required runs, we aim to select a diverse range of data mixtures that cover extreme weights from 0% to 100% for each domain. We achieve this by using a Dirichlet distribution based on the token distribution, which allows us to sample a wide range of values and expose the regression models to various extremes. Simultaneously, basing the distribution on the token distribution ensures that the overall data mixture statistically reflects the availability of data. For example, this prevents any single domain with a token count below 1% from being overly emphasized, which is not feasible for large-scale training since there are not enough available tokens from that domain. In practice, we multiply the token distribution by a value from to to construct various sparse and near-uniform distributions, then use these distribution vectors as the Dirichlet distribution hyperparameter .
After training small-scale proxy models for a few steps, we can obtain several well-trained small models. For example, in our main experiment, each proxy model contains 1M parameters and is trained on 1B tokens. We can then choose to evaluate these trained models on domains or benchmarks to get the target value we want to optimize. Generally, the target value can be the loss on a domain, as shown in Figure 2 for the StackExchange domain. Once we have obtained these target values, we can use the data mixture as features and the target values as labels to fit a regression model.
3.2 Fit a regression model
| Component | Effective Size |
|---|---|
| Pile-CC | 227.12 GiB |
| PubMed Central | 180.55 GiB |
| Books3 | 151.44 GiB |
| OpenWebText2 | 125.54 GiB |
| ArXiv | 112.42 GiB |
| Github | 95.16 GiB |
| FreeLaw | 76.73 GiB |
| Stack Exchange | 64.39 GiB |
| USPTO Backgrounds | 45.81 GiB |
| PubMed Abstracts | 38.53 GiB |
| Gutenberg (PG-19) | 27.19 GiB |
| Component | Effective Size |
|---|---|
| OpenSubtitles | 19.47 GiB |
| Wikipedia (en) | 19.13 GiB |
| DM Mathematics | 15.49 GiB |
| Ubuntu IRC | 11.03 GiB |
| BookCorpus2 | 9.45 GiB |
| EuroParl | 9.17 GiB |
| HackerNews | 7.80 GiB |
| YoutubeSubtitles | 7.47 GiB |
| PhilPapers | 4.76 GiB |
| NIH ExPorter | 3.79 GiB |
| Enron Emails | 1.76 GiB |
The second step is to fit a regression model using the data mixture as features, and the target value as labels. The regression task is a conventional supervised learning task that involves predicting a continuous target variable based on input features . The goal is to find a function that best maps the input features to the target variable, such that , where represents the error or noise in the data. In the context of this paper, the input features correspond to the domain weights of the data mixture, and the target variable is the value we want to optimize. Using this data, we train regression models that learn a function to predict the target value based on arbitrary data mixtures without requiring further training.
Linear regression.
The linear regression model is widely used in regression. It assumes a linear relationship between the input features and the target variable, which can be represented as:
| (1) |
where is the intercept, and are the coefficients associated with the respective input features . The coefficients are typically estimated using techniques such as ordinary least squares, aiming to minimize the sum of squared residuals between the predicted and actual target values. In practice, we employ linear regression with L2 regularization, also known as ridge regression, which applies a penalty to the magnitude of to prevent overfitting.
LightGBM regression.
The LightGBM [26] is a powerful gradient-boosting algorithm that can be used for both regression and classification tasks. In the context of regression, LightGBM learns an ensemble of decision trees to predict the target variable. The process is guided by a gradient-based optimization algorithm, which minimizes a specified loss function (e.g. mean squared error). Moreover, LightGBM is designed to be efficient and scalable, making it suitable for large datasets.
3.3 Simulate and predict
Once we have trained the regression model, we can efficiently explore the entire space of possible data mixtures. By using the trained model to predict the target value for each potential data mixture, we can quickly identify the input that yields the best target value. This simulation-based optimization is relatively cheap, as both the simulation and the regression prediction are computationally fast. For example, running prediction for 1,000,000 data mixtures takes less than 10 CPU seconds.
3.4 Large-scale model training
After identifying the best data mixture with simulation, we generalize the top-ranked data mixture to a large-scale model training with many more tokens. As shown in Figure 2, we directly use the best data mixture for training the larger model. In practice, to increase the robustness of our regression prediction, we select the top mixtures and average them as the data mixture for large-scale training.
4 Evaluating on regression prediction
In this section, we evaluate the ability of RegMix to predict the effect of unseen data mixtures. First, we fit the regression model using training artifacts of small (i.e., 1M parameter) models and evaluate the loss prediction performance on small models. Then, to verify our rank invariance hypothesis, we test the learned regression on predicting the rank across model sizes and the number of tokens.
4.1 Experimental setup
Datasets and models.
We conduct our experiments using the domains of the Pile dataset [18] depicted in Table 1. Due to copyright concerns, we utilize the 17 subsets available on HuggingFace 444https://huggingface.co/datasets/monology/pile-uncopyrighted that do not violate copyright issues. We consider both linear regression and LightGBM regression models, where the target variable is set to be the validation loss of the Pile-CC domain.
| Method | 1M models with 1B tokens | 60M models with 1B tokens | 1B models with 25B tokens | ||||
|---|---|---|---|---|---|---|---|
| () | Pearson’s () | MSE () | () | Pearson’s () | () | Pearson’s () | |
| Linear | 90.08 | 87.78 | 0.13 | 89.26 | 86.79 | 88.01 | 72.57 |
| LightGBM | 98.45 | 98.57 | 0.04 | 98.64 | 98.28 | 97.12 | 94.36 |
Training and evaluation.
The regression model is fitted using the training artifacts of 1M models with 1B tokens, and evaluated on unseen data mixtures for 1M, 60M models (each trained with 1B tokens) and unseen data mixtures for 1B models (each trained with 25B tokens).
Evaluation metrics.
We use three different metrics to benchmark our regression models: (1) Spearman Rank Correlation () is a non-parametric measure of the strength and direction of the association between two ranked variables. (2) Pearson’s is a measure of the linear relationship between two variables. (3) Mean Squared Error (MSE) is a common metric used to evaluate a regression model by measuring the average squared differences between predicted and actual values.
4.2 Experimental results
High correlation across model sizes.
As shown in Table 2, the LightGBM model demonstrates superior performance over linear regression models across all three metrics, with its advantage becoming increasingly pronounced when evaluating on larger models with more training tokens. Meanwhile, the fact that 1M models trained with 1B tokens can achieve such a high correlation of % on unseen mixtures of 1B models with 25B tokens directly validates our rank invariance hypothesis.
Proxy model count outweighs training token count.
Given the same FLOPs budget for small-scale training, we can either increase the token count (i.e., the number of training tokens) or the number of proxy models. Therefore, we study which approach would yield better performance. As shown in Figure 3, increasing the training tokens of the proxy models saturates after approximately 0.25B tokens. In contrast, increasing the number of proxy models consistently enhances performance, particularly for the LightGBM model. Notably, the performance of 512 models trained on 0.2B tokens surpasses that of 128 models trained on 0.8B tokens, indicating that increasing the number of proxy models is more effective than increasing the training token count beyond a certain token threshold.
5 Evaluating on downstream tasks
In this section, we apply our method to demonstrate its effectiveness on realistic downstream tasks. For evaluation, we exclude specific benchmarks that exhibit large performance variance (e.g., RTE) according to the performance traces reported in previous work [36] and our observations during pre-training. Ultimately, we select the following benchmarks as our downstream tasks: Social IQA [51], HellaSwag [70], PiQA [5], OpenBookQA [39], Lambada [43], SciQ [60], ARC Easy [11], COPA [52], RACE [30], LogiQA [32], QQP [59], WinoGrande [50], and MultiRC [27]. These benchmarks cover a diverse range of tasks, enabling a comprehensive evaluation of the real-world impact of RegMix. For each benchmark, we use normalized accuracy as the evaluation metric if provided by lm-eval-harness [19] else we use regular accuracy.
5.1 Data mixture significantly impacts downstream performance
| Benchmark | Worst Model | Best Model | |
|---|---|---|---|
| Social IQA [51] | 32.4 | 33.9 | 1.5 |
| HellaSwag [70] | 33.0 | 43.4 | 10.4 |
| PiQA [5] | 60.2 | 69.0 | 8.8 |
| OpenBookQA [39] | 25.8 | 31.2 | 5.4 |
| Lambada [43] | 18.9 | 33.5 | 14.6 |
| SciQ [60] | 76.7 | 82.9 | 6.2 |
| ARC Easy [11] | 44.9 | 52.2 | 7.3 |
| COPA [52] | 61.5 | 70.5 | 9.0 |
| RACE [30] | 27.9 | 32.5 | 4.6 |
| LogiQA [32] | 23.2 | 27.7 | 4.5 |
| QQP [59] | 48.0 | 59.7 | 11.7 |
| WinoGrande [50] | 50.3 | 53.2 | 2.9 |
| MultiRC [27] | 47.6 | 55.7 | 8.1 |
| Average Performance | 43.7 | 47.9 | 4.2 |
Initially, we train 64 models, each with 1B parameters, using different data mixtures. Every model is trained on 25B tokens555We set the token quantity such that it is compute-optimal according to the Chinchilla scaling law [23]. from the Pile dataset [18], with tokens allocated based on their corresponding domain weights. Table 3 presents the performance of the worst and best models on each downstream task. The reported performance is the average from 0-shot to 5-shot evaluations, scored using the lm-eval-harness evaluation framework [19, 4]. We find that the data mixture significantly impacts downstream performances, with the largest performance reaching on the Lambada task. This underscores the importance of studying the optimal data mixture.
5.2 Web corpora benefits downstream performance the most
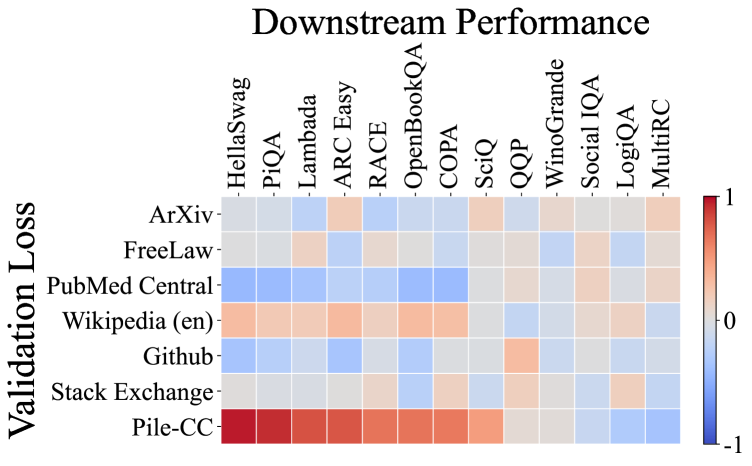
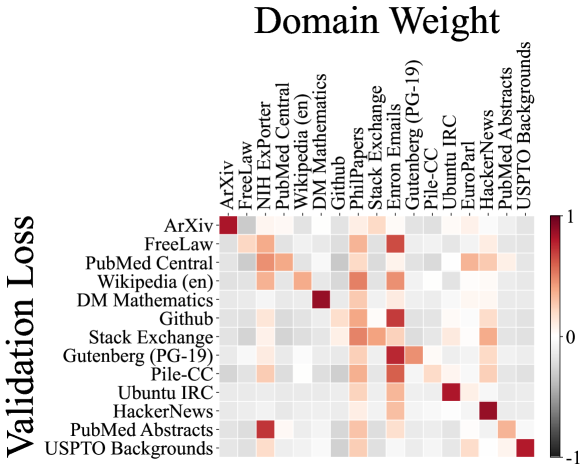
Next, we visualize the correlation between the validation losses of our 64 1B models across different domains and their performance on various downstream tasks in Figure 4 (a). Prior to visualization, we hypothesized that the validation loss on the Wikipedia (en) subset would exhibit a strong correlation with most downstream tasks, as it is a high-quality dataset, and many downstream tasks are derived from Wikipedia text. Similarly, previous work often takes WikiText [38] as a standard benchmark to indicate language model performance.
However, surprisingly, the validation loss on the Pile-CC dataset shows the strongest correlation with most downstream tasks. For instance, the correlation coefficient between the HellaSwag task and the Pile-CC validation loss is remarkably close to . This unexpected result challenges the conventional assumption that WikiText is the most representative dataset for evaluating LLMs. Furthermore, this result aligns with the findings of previous studies [17, 24], which discovered that the validation loss on the web dataset closely relates to downstream performance.
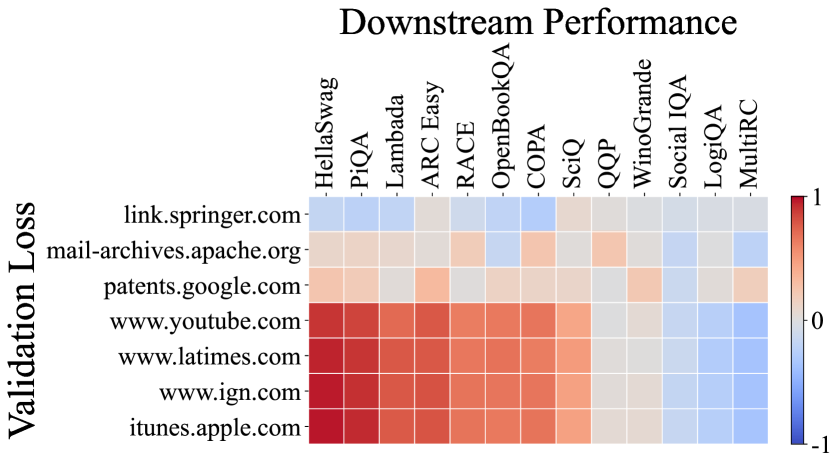
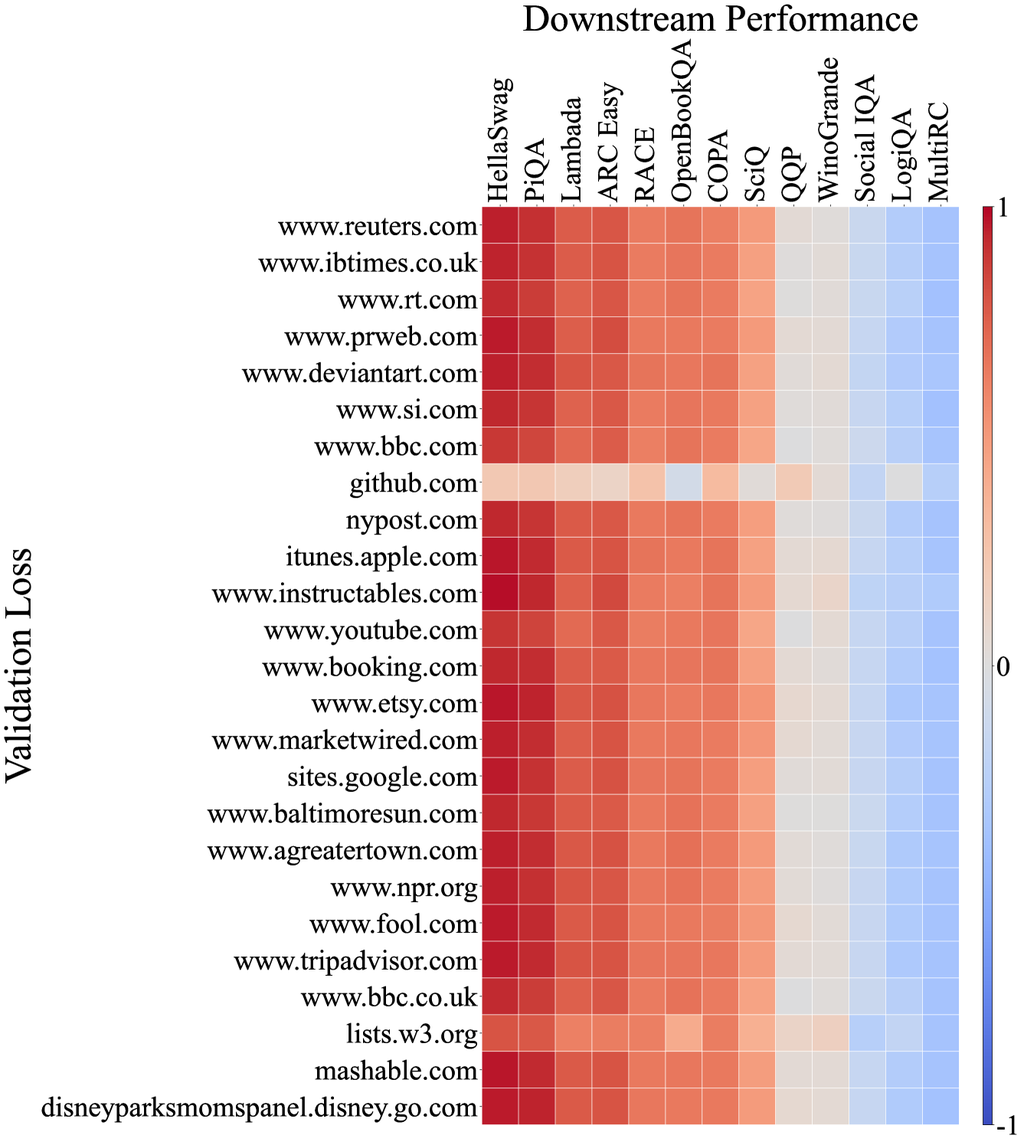
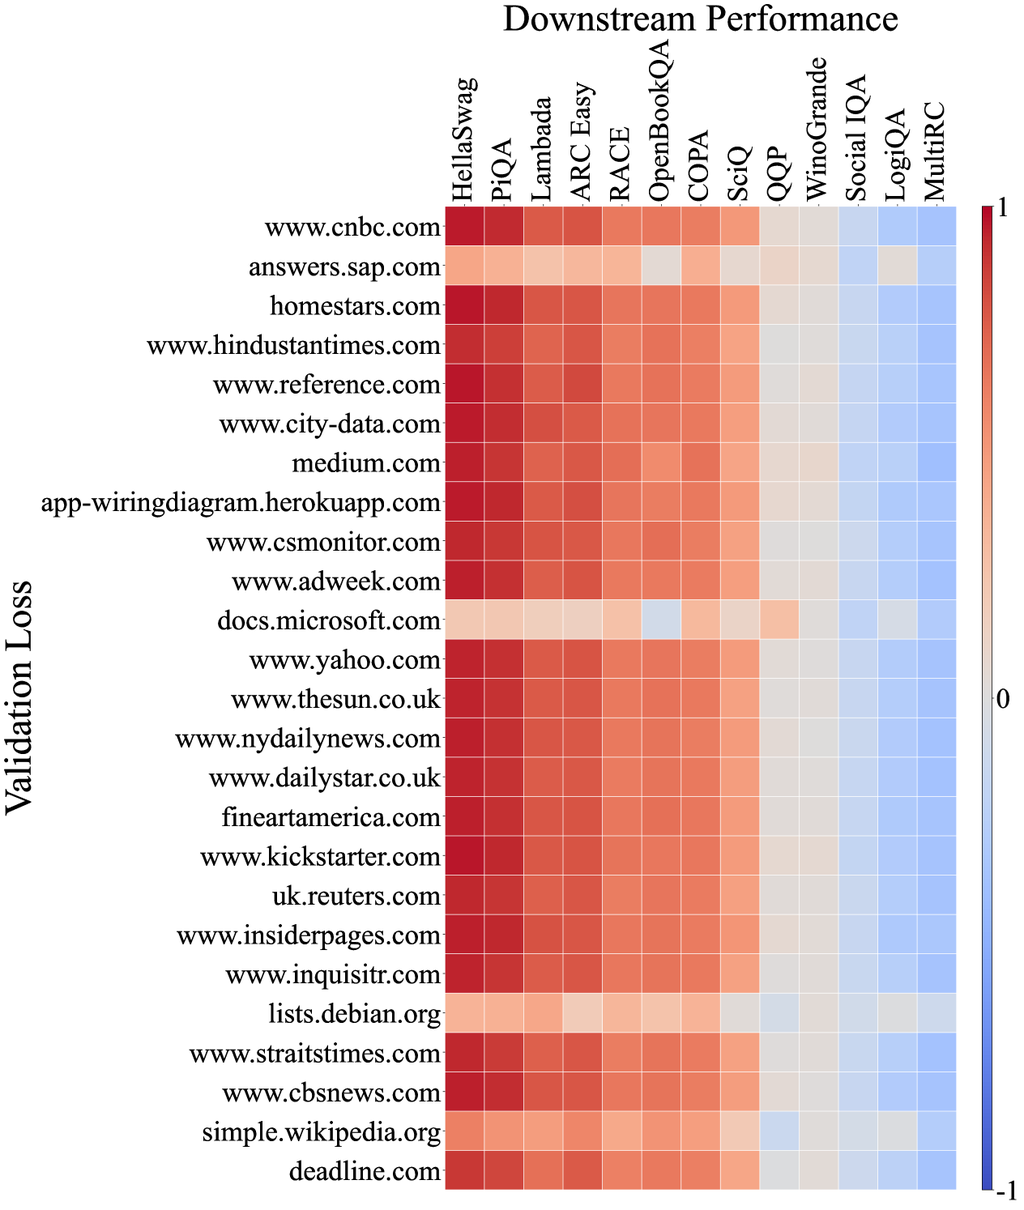
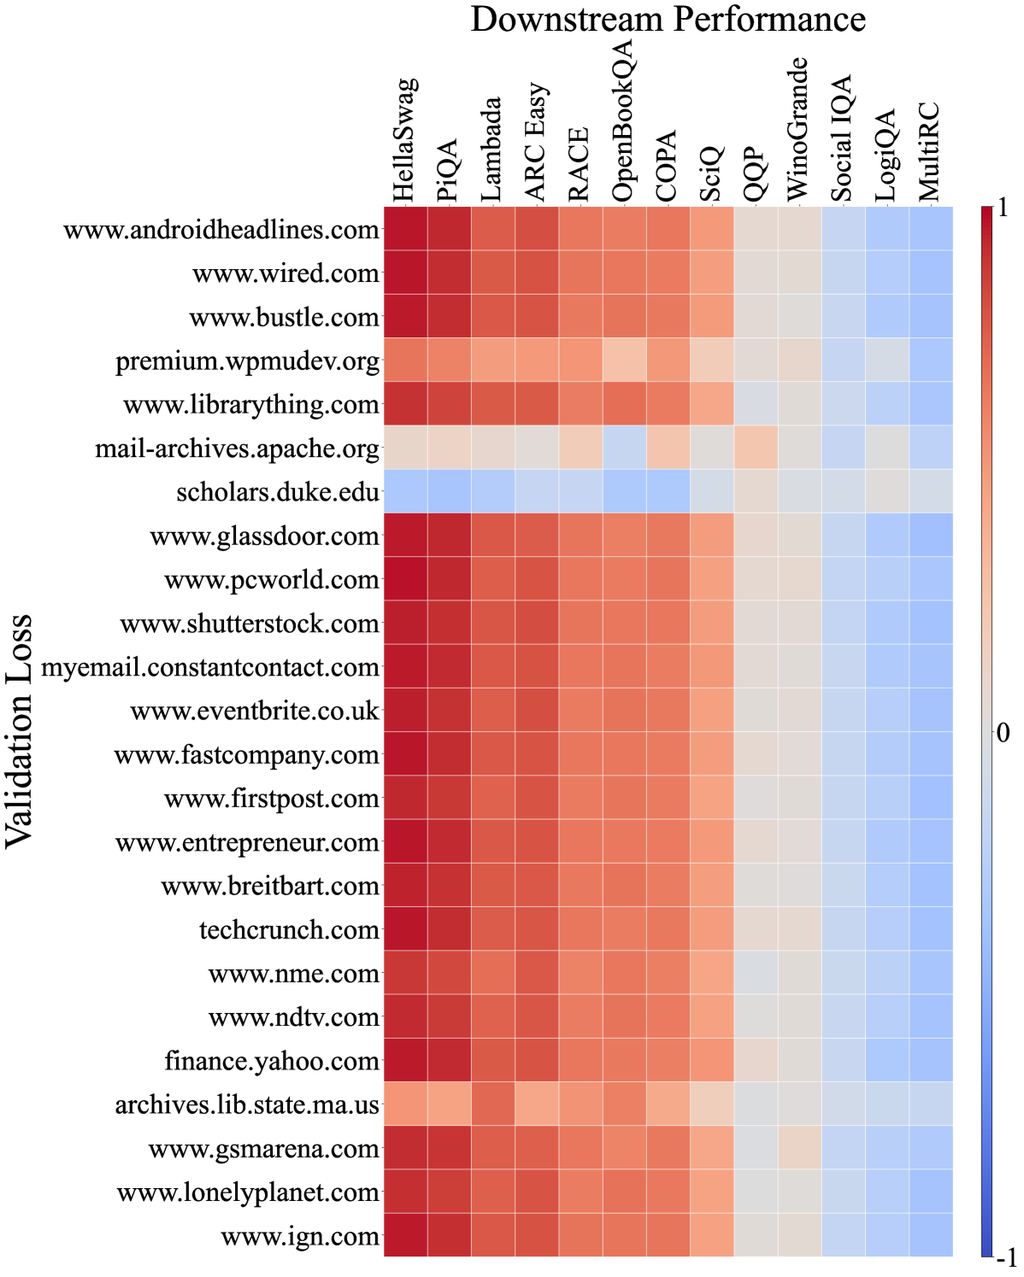
Moreover, we analyze the correlation between the loss of models on the C4100Domain validation set [34], which is taken from the C4 dataset [47] and supposed to share a similar distribution as Pile-CC since they are all derived from the CommonCrawl corpus. Since CommonCrawl is a collection of diverse domains, we would expect the correlation between the loss of each domain and the downstream tasks to vary. However, surprisingly more than 85% of the domains exhibit a very strong correlation with Pile-CC (full correlation graph in Appendix D). This is exemplified by the www.ign.com domain, which closely mirrors the overall correlation graph of Pile-CC, as illustrated in Figure 4 (b). It also suggests that the high correlation between Pile-CC and downstream task performance may be attributed to its diverse coverage across various topics and domains.
5.3 Data mixture by RegMix improves downstream performance
| Benchmark | Human | DoReMi | Pile-CC Only | RegMix |
|---|---|---|---|---|
| Social IQA [51] | 33.8 0.4 | 33.3 0.2 | 33.4 0.4 | 33.5 0.2 |
| HellaSwag [70] | 37.7 0.2 | 43.3 0.3 | 43.2 0.6 | 44.0 0.2 |
| PiQA [5] | 65.5 0.7 | 68.6 0.4 | 68.8 0.6 | 69.1 0.4 |
| OpenBookQA [39] | 28.5 0.4 | 30.0 0.3 | 30.5 0.4 | 29.8 0.5 |
| Lambada [43] | 28.3 1.5 | 32.4 0.7 | 34.2 1.1 | 32.9 1.4 |
| SciQ [60] | 81.5 1.1 | 83.3 1.9 | 82.4 1.0 | 82.8 0.4 |
| ARC Easy [11] | 49.9 0.9 | 52.3 1.1 | 51.8 0.4 | 52.1 0.9 |
| COPA [52] | 64.6 1.8 | 69.7 2.7 | 67.5 2.0 | 69.9 0.6 |
| RACE [30] | 29.5 0.5 | 31.1 0.2 | 31.5 0.5 | 31.2 0.4 |
| LogiQA [32] | 25.7 0.8 | 25.5 0.7 | 26.6 1.0 | 25.4 1.2 |
| QQP [59] | 55.6 2.9 | 57.3 1.4 | 58.0 1.9 | 55.7 1.9 |
| WinoGrande [50] | 52.0 1.0 | 52.1 0.3 | 51.8 0.7 | 52.1 0.7 |
| MultiRC [27] | 52.9 1.4 | 52.9 1.2 | 51.2 1.5 | 52.8 1.5 |
| Average Performance | 46.6 0.3 | 48.6 0.3 | 48.5 0.3 | 48.6 0.3 |
| Beat Human on | – | 8 / 13 | 8 / 13 | 8 / 13 |
| Estimated FLOPs | 0 | 0 |
Previous work has shown that the data mixture method can accelerate LLM pre-training by achieving a smaller validation loss (or perplexity) using less training tokens [64]. However, a key question is which validation loss should be optimized? The most intuitive approach, which is also adopted by previous work, is to minimize the loss across all domains. However, based on our study of 1M training logs, we found this to be nearly impossible to achieve in practice. None of the data mixtures were able to surpass the human selection on all domain validation losses simultaneously. This suggests that a naive approach of minimizing the loss across all domains is likely infeasible. Therefore, we choose to optimize the Pile-CC validation loss to achieve general performance improvement on downstream tasks since it shows the highest correlation with downstream performance.
We implement two approaches to determine the data mixture. The first approach relies on human intuition. Since Pile-CC and its own distribution should be the closest match, we hypothesized that pre-training solely on Pile-CC might yield better performance than baselines. The second approach leverages RegMix, using the Pile-CC validation loss as the target variable. We employed LightGBM to predict the data mixture which can minimize the Pile-CC validation loss.
We compare the performance of our proposed approaches to strong baselines, including selection done by humans for the Pile [18], and DoReMi [64]. For DoReMi we obtain the data mixture directly from their reported best domain weights and re-normalize it across the available 17 domains. This may result in sub-optimal performance for DoReMi compared to the originally reported results. As shown in Table 4, both Pile-CC Only and RegMix demonstrate strong performance compared to the baselines. On the widely used HellaSwag benchmark, RegMix shows an improvement of over Human selection. Additionally, RegMix beats all other three methods on the task performance in 8 out of 14 cases and yields the highest average score. The surprisingly strong performance of Pile-CC Only reinforces the conclusion from our previous section: web corpora benefits on downstream performance. Finally, RegMix surpasses the Best Model in Table 3, demonstrating that our automatic data mixture approach is more efficient than random search.
While the Pile-CC validation loss is an informative indicator for downstream performance, it may not generalize to every task of interest. Sometimes we may not be able to assume that the validation set stems from a similar data distribution as the training set, but rather face an out-of-distribution scenario. To verify the effectiveness of our method in out-of-distribution scenarios, we fully exclude the Pile-CC domain from the pre-training corpus and use the remaining domains to find the optimal data mixture that minimizes Pile-CC validation loss. As illustrated in Figure 5 (right), our proposed method still outperforms baseline approaches. This demonstrates that RegMix is robust regardless of whether the target domain is in- or out-of-distribution. We additionally provide the results of regression evaluation under this setting in Figure 5.
5.4 Domain interactions are challenging for humans to understand
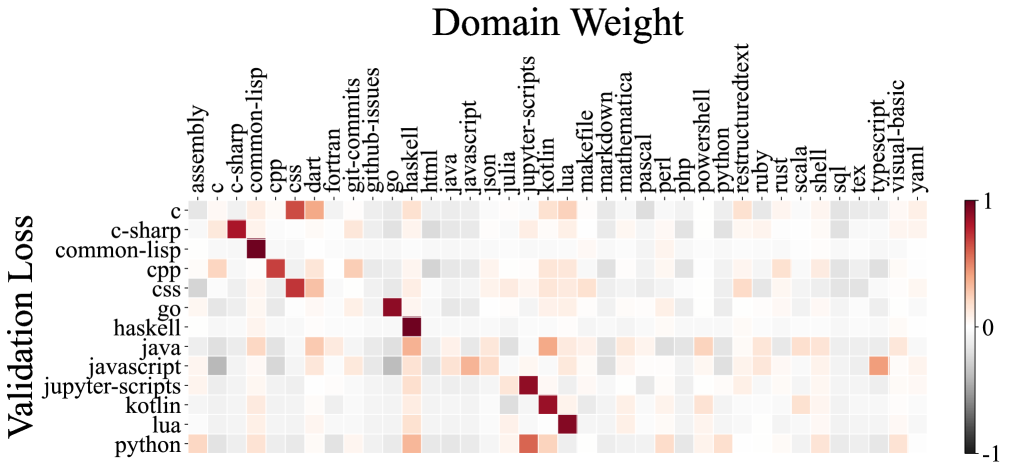
To understand the impact of different domains on each other, we visualize the coefficients () of the linear regression model in Figure 6. The visualization provides insights into how the various data domains contribute to the others, revealing complex interactions among them. We also display code correlation diagrams for each 1M code model trained on The Stack dataset [28]. Surprisingly, both the domain interaction visualization and the code correlation diagrams display complex relationships that are difficult for human experts to fully comprehend. For example, the PhilPapers domain in the Pile dataset appears to provide gains for all other domains under the linear regression modeling, which is a non-obvious finding that challenges intuitive human understanding. These visualizations highlight the inherent complexity in determining the optimal data mixture, underscoring the value of our automated RegMix approach in efficiently identifying high-performing mixtures, rather than relying solely on human intuition.
5.5 Data mixture effects transcend scaling laws
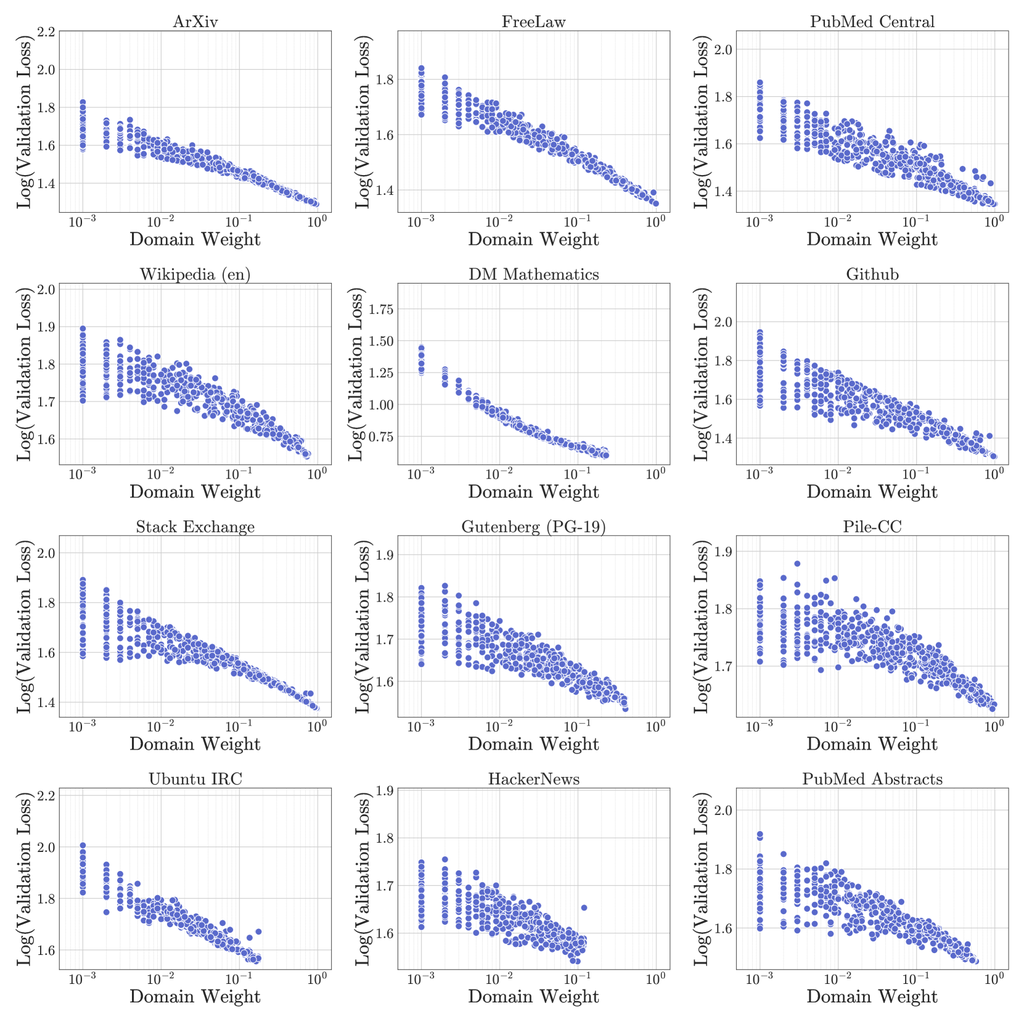
Recent research [68, 20] has demonstrated the feasibility of scaling laws for data mixture. However, our findings in Section 5.4 suggest that the relationship between domain weights and validation loss is more complex than scaling laws might imply. To visualize this complexity, we plotted all experimental points of our 1M training logs in Figure 7. If the scaling law of data mixture held true, we would expect to see a clear log-log linear relationship across all domains. However, our results reveal a more nuanced picture. For example, the DM Mathematics domain, possibly due to its distinct distribution compared to other domains, exhibits a near log-log linear relationship between loss and domain weight. In contrast, for most domains like Pile-CC show more complex patterns, where predicting validation loss is non-trivial. As shown, domain interactions appear to be intricate, making it challenging to predict the validation loss for a domain based solely on its weight in the mixture. These findings suggest that while scaling laws provide valuable insights, they may not fully capture the intricacies of data mixture dynamics. Our approach addresses the challenge by modeling the entire data mixture as input for the regression model, providing a more comprehensive framework for understanding and predicting the validation loss while simultaneously accounting for all domain weights.
6 Conclusion
In this paper, we present a novel approach, RegMix, for automatically selecting the optimal data mixture for pre-training large language models. RegMix formulates the data mixture problem as a regression task and trains small models to predict the impact of different data mixtures. This enables efficient identification of the best mixture, which we then generalize to large-scale model training. RegMix predicts the best data mixture among 64 x 1B models demonstrating its effectiveness. Moreover, our large-scale study provides valuable insights into the impact of data mixture, the relationship between loss and downstream performance, and the domain interaction challenges for human experts in determining the optimal mixture.
References
- AI [2024] Meta AI. Introducing meta llama 3: The most capable openly available llm to date. https://ai.meta.com/blog/meta-llama-3/, April 2024.
- Albalak et al. [2023] Alon Albalak, Liangming Pan, Colin Raffel, and William Yang Wang. Efficient online data mixing for language model pre-training. arXiv preprint arXiv:2312.02406, 2023.
- Albalak et al. [2024] Alon Albalak, Yanai Elazar, Sang Michael Xie, Shayne Longpre, Nathan Lambert, Xinyi Wang, Niklas Muennighoff, Bairu Hou, Liangming Pan, Haewon Jeong, et al. A survey on data selection for language models. arXiv preprint arXiv:2402.16827, 2024.
- Biderman et al. [2024] Stella Biderman, Hailey Schoelkopf, Lintang Sutawika, Leo Gao, Jonathan Tow, Baber Abbasi, Alham Fikri Aji, Pawan Sasanka Ammanamanchi, Sidney Black, Jordan Clive, et al. Lessons from the trenches on reproducible evaluation of language models. arXiv preprint arXiv:2405.14782, 2024.
- Bisk et al. [2020] Yonatan Bisk, Rowan Zellers, Jianfeng Gao, Yejin Choi, et al. Piqa: Reasoning about physical commonsense in natural language. In Proceedings of the AAAI conference on artificial intelligence, 2020.
- Black et al. [2022] Sid Black, Stella Biderman, Eric Hallahan, Quentin Anthony, Leo Gao, Laurence Golding, Horace He, Connor Leahy, Kyle McDonell, Jason Phang, et al. Gpt-neox-20b: An open-source autoregressive language model. arXiv preprint arXiv:2204.06745, 2022.
- Brown et al. [2020] Tom Brown, Benjamin Mann, Nick Ryder, Melanie Subbiah, Jared D Kaplan, Prafulla Dhariwal, Arvind Neelakantan, Pranav Shyam, Girish Sastry, Amanda Askell, Sandhini Agarwal, Ariel Herbert-Voss, Gretchen Krueger, Tom Henighan, Rewon Child, Aditya Ramesh, Daniel Ziegler, Jeffrey Wu, Clemens Winter, Chris Hesse, Mark Chen, Eric Sigler, Mateusz Litwin, Scott Gray, Benjamin Chess, Jack Clark, Christopher Berner, Sam McCandlish, Alec Radford, Ilya Sutskever, and Dario Amodei. Language models are few-shot learners. In H. Larochelle, M. Ranzato, R. Hadsell, M.F. Balcan, and H. Lin, editors, Advances in Neural Information Processing Systems, volume 33, pages 1877–1901. Curran Associates, Inc., 2020. URL https://proceedings.neurips.cc/paper_files/paper/2020/file/1457c0d6bfcb4967418bfb8ac142f64a-Paper.pdf.
- Bukharin and Zhao [2023] Alexander Bukharin and Tuo Zhao. Data diversity matters for robust instruction tuning. arXiv preprint arXiv:2311.14736, 2023.
- Chen et al. [2023] Mayee F Chen, Nicholas Roberts, Kush Bhatia, Jue Wang, Ce Zhang, Frederic Sala, and Christopher Ré. Skill-it! a data-driven skills framework for understanding and training language models. arXiv preprint arXiv:2307.14430, 2023.
- Chen et al. [2024] Xuxi Chen, Zhendong Wang, Daouda Sow, Junjie Yang, Tianlong Chen, Yingbin Liang, Mingyuan Zhou, and Zhangyang Wang. Take the bull by the horns: Hard sample-reweighted continual training improves llm generalization. arXiv preprint arXiv:2402.14270, 2024.
- Clark et al. [2018] Peter Clark, Isaac Cowhey, Oren Etzioni, Tushar Khot, Ashish Sabharwal, Carissa Schoenick, and Oyvind Tafjord. Think you have solved question answering? try arc, the ai2 reasoning challenge. arXiv preprint arXiv:1803.05457, 2018.
- Cobbe et al. [2021] Karl Cobbe, Vineet Kosaraju, Mohammad Bavarian, Mark Chen, Heewoo Jun, Lukasz Kaiser, Matthias Plappert, Jerry Tworek, Jacob Hilton, Reiichiro Nakano, Christopher Hesse, and John Schulman. Training verifiers to solve math word problems. CoRR, abs/2110.14168, 2021. URL https://arxiv.org/abs/2110.14168.
- Das and Khetan [2023] Devleena Das and Vivek Khetan. Deft: Data efficient fine-tuning for large language models via unsupervised core-set selection. arXiv preprint arXiv:2310.16776, 2023.
- Dou et al. [2024] Longxu Dou, Qian Liu, Guangtao Zeng, Jia Guo, Jiahui Zhou, Wei Lu, and Min Lin. Sailor: Open language models for south-east asia. CoRR, abs/2404.03608, 2024. doi: 10.48550/ARXIV.2404.03608. URL https://doi.org/10.48550/arXiv.2404.03608.
- Engstrom et al. [2024] Logan Engstrom, Axel Feldmann, and Aleksander Madry. Dsdm: Model-aware dataset selection with datamodels. arXiv preprint arXiv:2401.12926, 2024.
- Fan et al. [2023] Simin Fan, Matteo Pagliardini, and Martin Jaggi. Doge: Domain reweighting with generalization estimation. arXiv preprint arXiv:2310.15393, 2023.
- Gadre et al. [2024] Samir Yitzhak Gadre, Georgios Smyrnis, Vaishaal Shankar, Suchin Gururangan, Mitchell Wortsman, Rulin Shao, Jean Mercat, Alex Fang, Jeffrey Li, Sedrick Keh, Rui Xin, Marianna Nezhurina, Igor Vasiljevic, Jenia Jitsev, Alexandros G. Dimakis, Gabriel Ilharco, Shuran Song, Thomas Kollar, Yair Carmon, Achal Dave, Reinhard Heckel, Niklas Muennighoff, and Ludwig Schmidt. Language models scale reliably with over-training and on downstream tasks. CoRR, abs/2403.08540, 2024. doi: 10.48550/ARXIV.2403.08540. URL https://doi.org/10.48550/arXiv.2403.08540.
- Gao et al. [2021] Leo Gao, Stella Biderman, Sid Black, Laurence Golding, Travis Hoppe, Charles Foster, Jason Phang, Horace He, Anish Thite, Noa Nabeshima, Shawn Presser, and Connor Leahy. The pile: An 800gb dataset of diverse text for language modeling. CoRR, abs/2101.00027, 2021. URL https://arxiv.org/abs/2101.00027.
- Gao et al. [2023] Leo Gao, Jonathan Tow, Baber Abbasi, Stella Biderman, Sid Black, Anthony DiPofi, Charles Foster, Laurence Golding, Jeffrey Hsu, Alain Le Noac’h, Haonan Li, Kyle McDonell, Niklas Muennighoff, Chris Ociepa, Jason Phang, Laria Reynolds, Hailey Schoelkopf, Aviya Skowron, Lintang Sutawika, Eric Tang, Anish Thite, Ben Wang, Kevin Wang, and Andy Zou. A framework for few-shot language model evaluation, 12 2023. URL https://zenodo.org/records/10256836.
- Ge et al. [2024] Ce Ge, Zhijian Ma, Daoyuan Chen, Yaliang Li, and Bolin Ding. Data mixing made efficient: A bivariate scaling law for language model pretraining. arXiv preprint arXiv:2405.14908, 2024.
- Goyal et al. [2024] Sachin Goyal, Pratyush Maini, Zachary C. Lipton, Aditi Raghunathan, and J. Zico Kolter. Scaling laws for data filtering - data curation cannot be compute agnostic. CoRR, abs/2404.07177, 2024. doi: 10.48550/ARXIV.2404.07177. URL https://doi.org/10.48550/arXiv.2404.07177.
- Hendrycks et al. [2021] Dan Hendrycks, Collin Burns, Steven Basart, Andy Zou, Mantas Mazeika, Dawn Song, and Jacob Steinhardt. Measuring massive multitask language understanding. In 9th International Conference on Learning Representations, ICLR 2021, Virtual Event, Austria, May 3-7, 2021. OpenReview.net, 2021. URL https://openreview.net/forum?id=d7KBjmI3GmQ.
- Hoffmann et al. [2022] Jordan Hoffmann, Sebastian Borgeaud, Arthur Mensch, Elena Buchatskaya, Trevor Cai, Eliza Rutherford, Diego de Las Casas, Lisa Anne Hendricks, Johannes Welbl, Aidan Clark, et al. Training compute-optimal large language models. arXiv preprint arXiv:2203.15556, 2022.
- Huang et al. [2024] Yuzhen Huang, Jinghan Zhang, Zifei Shan, and Junxian He. Compression represents intelligence linearly. arXiv preprint arXiv:2404.09937, 2024.
- Kang et al. [2024] Feiyang Kang, Hoang Anh Just, Yifan Sun, Himanshu Jahagirdar, Yuanzhi Zhang, Rongxing Du, Anit Kumar Sahu, and Ruoxi Jia. Get more for less: Principled data selection for warming up fine-tuning in llms. arXiv preprint arXiv:2405.02774, 2024.
- Ke et al. [2017] Guolin Ke, Qi Meng, Thomas Finley, Taifeng Wang, Wei Chen, Weidong Ma, Qiwei Ye, and Tie-Yan Liu. Lightgbm: A highly efficient gradient boosting decision tree. Advances in neural information processing systems, 30, 2017.
- Khashabi et al. [2018] Daniel Khashabi, Snigdha Chaturvedi, Michael Roth, Shyam Upadhyay, and Dan Roth. Looking beyond the surface: A challenge set for reading comprehension over multiple sentences. In Proceedings of the 2018 Conference of the North American Chapter of the Association for Computational Linguistics: Human Language Technologies, Volume 1 (Long Papers), pages 252–262, 2018.
- Kocetkov et al. [2022] Denis Kocetkov, Raymond Li, Loubna Ben Allal, Jia Li, Chenghao Mou, Carlos Muñoz Ferrandis, Yacine Jernite, Margaret Mitchell, Sean Hughes, Thomas Wolf, Dzmitry Bahdanau, Leandro von Werra, and Harm de Vries. The stack: 3 TB of permissively licensed source code. CoRR, abs/2211.15533, 2022. doi: 10.48550/ARXIV.2211.15533. URL https://doi.org/10.48550/arXiv.2211.15533.
- Koh and Liang [2017] Pang Wei Koh and Percy Liang. Understanding black-box predictions via influence functions. In International conference on machine learning, pages 1885–1894. PMLR, 2017.
- Lai et al. [2017] Guokun Lai, Qizhe Xie, Hanxiao Liu, Yiming Yang, and Eduard Hovy. Race: Large-scale reading comprehension dataset from examinations. arXiv preprint arXiv:1704.04683, 2017.
- Lin et al. [2024] Zhenghao Lin, Zhibin Gou, Yeyun Gong, Xiao Liu, Yelong Shen, Ruochen Xu, Chen Lin, Yujiu Yang, Jian Jiao, Nan Duan, and Weizhu Chen. Rho-1: Not all tokens are what you need. arXiv preprint arXiv:2404.07965, 2024.
- Liu et al. [2020] Jian Liu, Leyang Cui, Hanmeng Liu, Dandan Huang, Yile Wang, and Yue Zhang. Logiqa: A challenge dataset for machine reading comprehension with logical reasoning. arXiv preprint arXiv:2007.08124, 2020.
- Liu et al. [2024] Wei Liu, Weihao Zeng, Keqing He, Yong Jiang, and Junxian He. What makes good data for alignment? a comprehensive study of automatic data selection in instruction tuning. In The International Conference on Learning Representations, 2024.
- Magnusson et al. [2023] Ian Magnusson, Akshita Bhagia, Valentin Hofmann, Luca Soldaini, Ananya Harsh Jha, Oyvind Tafjord, Dustin Schwenk, Evan Pete Walsh, Yanai Elazar, Kyle Lo, Dirk Groeneveld, Iz Beltagy, Hannaneh Hajishirzi, Noah A. Smith, Kyle Richardson, and Jesse Dodge. Paloma: A benchmark for evaluating language model fit. CoRR, abs/2312.10523, 2023. doi: 10.48550/ARXIV.2312.10523. URL https://doi.org/10.48550/arXiv.2312.10523.
- Marion et al. [2023] Max Marion, Ahmet Üstün, Luiza Pozzobon, Alex Wang, Marzieh Fadaee, and Sara Hooker. When less is more: Investigating data pruning for pretraining llms at scale, 2023.
- Mehta et al. [2024] Sachin Mehta, Mohammad Hossein Sekhavat, Qingqing Cao, Maxwell Horton, Yanzi Jin, Chenfan Sun, Iman Mirzadeh, Mahyar Najibi, Dmitry Belenko, Peter Zatloukal, and Mohammad Rastegari. Openelm: An efficient language model family with open training and inference framework. CoRR, abs/2404.14619, 2024. doi: 10.48550/ARXIV.2404.14619. URL https://doi.org/10.48550/arXiv.2404.14619.
- Mekala et al. [2024] Dheeraj Mekala, Alex Nguyen, and Jingbo Shang. Smaller language models are capable of selecting instruction-tuning training data for larger language models. arXiv preprint arXiv:2402.10430, 2024.
- Merity et al. [2016] Stephen Merity, Caiming Xiong, James Bradbury, and Richard Socher. Pointer sentinel mixture models, 2016.
- Mihaylov et al. [2018] Todor Mihaylov, Peter Clark, Tushar Khot, and Ashish Sabharwal. Can a suit of armor conduct electricity? a new dataset for open book question answering. arXiv preprint arXiv:1809.02789, 2018.
- Mindermann et al. [2022] Sören Mindermann, Jan M Brauner, Muhammed T Razzak, Mrinank Sharma, Andreas Kirsch, Winnie Xu, Benedikt Höltgen, Aidan N Gomez, Adrien Morisot, Sebastian Farquhar, et al. Prioritized training on points that are learnable, worth learning, and not yet learnt. In International Conference on Machine Learning, pages 15630–15649. PMLR, 2022.
- Muennighoff et al. [2023] Niklas Muennighoff, Alexander M Rush, Boaz Barak, Teven Le Scao, Nouamane Tazi, Aleksandra Piktus, Sampo Pyysalo, Thomas Wolf, and Colin Raffel. Scaling data-constrained language models. In Thirty-seventh Conference on Neural Information Processing Systems, 2023. URL https://openreview.net/forum?id=j5BuTrEj35.
- Pandey [2024] Rohan Pandey. gzip predicts data-dependent scaling laws. arXiv preprint arXiv:2405.16684, 2024.
- Paperno et al. [2016] Denis Paperno, Germán Kruszewski, Angeliki Lazaridou, Quan Ngoc Pham, Raffaella Bernardi, Sandro Pezzelle, Marco Baroni, Gemma Boleda, and Raquel Fernández. The lambada dataset: Word prediction requiring a broad discourse context. arXiv preprint arXiv:1606.06031, 2016.
- Penedo et al. [2024] Guilherme Penedo, Hynek Kydlíček, Loubna Ben allal, Anton Lozhkov, Margaret Mitchell, Colin Raffel, Leandro Von Werra, and Thomas Wolf. The fineweb datasets: Decanting the web for the finest text data at scale, 2024. URL https://arxiv.org/abs/2406.17557.
- Que et al. [2024] Haoran Que, Jiaheng Liu, Ge Zhang, Chenchen Zhang, Xingwei Qu, Yinghao Ma, Feiyu Duan, Zhiqi Bai, Jiakai Wang, Yuanxing Zhang, Xu Tan, Jie Fu, Wenbo Su, Jiamang Wang, Lin Qu, and Bo Zheng. D-cpt law: Domain-specific continual pre-training scaling law for large language models, 2024.
- Rae et al. [2021] Jack W. Rae, Sebastian Borgeaud, Trevor Cai, Katie Millican, Jordan Hoffmann, H. Francis Song, John Aslanides, Sarah Henderson, Roman Ring, Susannah Young, Eliza Rutherford, Tom Hennigan, Jacob Menick, Albin Cassirer, Richard Powell, George van den Driessche, Lisa Anne Hendricks, Maribeth Rauh, Po-Sen Huang, Amelia Glaese, Johannes Welbl, Sumanth Dathathri, Saffron Huang, Jonathan Uesato, John Mellor, Irina Higgins, Antonia Creswell, Nat McAleese, Amy Wu, Erich Elsen, Siddhant M. Jayakumar, Elena Buchatskaya, David Budden, Esme Sutherland, Karen Simonyan, Michela Paganini, Laurent Sifre, Lena Martens, Xiang Lorraine Li, Adhiguna Kuncoro, Aida Nematzadeh, Elena Gribovskaya, Domenic Donato, Angeliki Lazaridou, Arthur Mensch, Jean-Baptiste Lespiau, Maria Tsimpoukelli, Nikolai Grigorev, Doug Fritz, Thibault Sottiaux, Mantas Pajarskas, Toby Pohlen, Zhitao Gong, Daniel Toyama, Cyprien de Masson d’Autume, Yujia Li, Tayfun Terzi, Vladimir Mikulik, Igor Babuschkin, Aidan Clark, Diego de Las Casas, Aurelia Guy, Chris Jones, James Bradbury, Matthew J. Johnson, Blake A. Hechtman, Laura Weidinger, Iason Gabriel, William Isaac, Edward Lockhart, Simon Osindero, Laura Rimell, Chris Dyer, Oriol Vinyals, Kareem Ayoub, Jeff Stanway, Lorrayne Bennett, Demis Hassabis, Koray Kavukcuoglu, and Geoffrey Irving. Scaling language models: Methods, analysis & insights from training gopher. CoRR, abs/2112.11446, 2021. URL https://arxiv.org/abs/2112.11446.
- Raffel et al. [2019] Colin Raffel, Noam Shazeer, Adam Roberts, Katherine Lee, Sharan Narang, Michael Matena, Yanqi Zhou, Wei Li, and Peter J. Liu. Exploring the limits of transfer learning with a unified text-to-text transformer. arXiv e-prints, 2019.
- Sachdeva et al. [2024] Noveen Sachdeva, Benjamin Coleman, Wang-Cheng Kang, Jianmo Ni, Lichan Hong, Ed H Chi, James Caverlee, Julian McAuley, and Derek Zhiyuan Cheng. How to train data-efficient llms. arXiv preprint arXiv:2402.09668, 2024.
- Sachin Parkar et al. [2024] Ritik Sachin Parkar, Jaehyung Kim, Jong Inn Park, and Dongyeop Kang. Selectllm: Can llms select important instructions to annotate? arXiv e-prints, pages arXiv–2401, 2024.
- Sakaguchi et al. [2021] Keisuke Sakaguchi, Ronan Le Bras, Chandra Bhagavatula, and Yejin Choi. Winogrande: An adversarial winograd schema challenge at scale. Communications of the ACM, 64(9):99–106, 2021.
- Sap et al. [2019] Maarten Sap, Hannah Rashkin, Derek Chen, Ronan LeBras, and Yejin Choi. SocialIQA: Commonsense reasoning about social interactions. In EMNLP, 2019.
- Sarlin et al. [2020] Paul-Edouard Sarlin, Daniel DeTone, Tomasz Malisiewicz, and Andrew Rabinovich. Superglue: Learning feature matching with graph neural networks. In Proceedings of the IEEE/CVF conference on computer vision and pattern recognition, pages 4938–4947, 2020.
- Shao et al. [2024] Yunfan Shao, Linyang Li, Zhaoye Fei, Hang Yan, Dahua Lin, and Xipeng Qiu. Balanced data sampling for language model training with clustering. arXiv preprint arXiv:2402.14526, 2024.
- Sharma et al. [2024] Vasu Sharma, Karthik Padthe, Newsha Ardalani, Kushal Tirumala, Russell Howes, Hu Xu, Po-Yao Huang, Shang-Wen Li, Armen Aghajanyan, and Gargi Ghosh. Text quality-based pruning for efficient training of language models. arXiv preprint arXiv:2405.01582, 2024.
- Soldaini et al. [2024] Luca Soldaini, Rodney Kinney, Akshita Bhagia, Dustin Schwenk, David Atkinson, Russell Authur, Ben Bogin, Khyathi Chandu, Jennifer Dumas, Yanai Elazar, et al. Dolma: An open corpus of three trillion tokens for language model pretraining research. arXiv preprint arXiv:2402.00159, 2024.
- Talmor et al. [2019] Alon Talmor, Jonathan Herzig, Nicholas Lourie, and Jonathan Berant. CommonsenseQA: A question answering challenge targeting commonsense knowledge. In Jill Burstein, Christy Doran, and Thamar Solorio, editors, Proceedings of the 2019 Conference of the North American Chapter of the Association for Computational Linguistics: Human Language Technologies, Volume 1 (Long and Short Papers), pages 4149–4158, Minneapolis, Minnesota, June 2019. Association for Computational Linguistics. doi: 10.18653/v1/N19-1421. URL https://aclanthology.org/N19-1421.
- Thakkar et al. [2023] Megh Thakkar, Tolga Bolukbasi, Sriram Ganapathy, Shikhar Vashishth, Sarath Chandar, and Partha Talukdar. Self-influence guided data reweighting for language model pre-training. arXiv preprint arXiv:2311.00913, 2023.
- Touvron et al. [2023] Hugo Touvron, Louis Martin, Kevin Stone, Peter Albert, Amjad Almahairi, Yasmine Babaei, Nikolay Bashlykov, Soumya Batra, Prajjwal Bhargava, Shruti Bhosale, Dan Bikel, Lukas Blecher, Cristian Canton-Ferrer, Moya Chen, Guillem Cucurull, David Esiobu, Jude Fernandes, Jeremy Fu, Wenyin Fu, Brian Fuller, Cynthia Gao, Vedanuj Goswami, Naman Goyal, Anthony Hartshorn, Saghar Hosseini, Rui Hou, Hakan Inan, Marcin Kardas, Viktor Kerkez, Madian Khabsa, Isabel Kloumann, Artem Korenev, Punit Singh Koura, Marie-Anne Lachaux, Thibaut Lavril, Jenya Lee, Diana Liskovich, Yinghai Lu, Yuning Mao, Xavier Martinet, Todor Mihaylov, Pushkar Mishra, Igor Molybog, Yixin Nie, Andrew Poulton, Jeremy Reizenstein, Rashi Rungta, Kalyan Saladi, Alan Schelten, Ruan Silva, Eric Michael Smith, Ranjan Subramanian, Xiaoqing Ellen Tan, Binh Tang, Ross Taylor, Adina Williams, Jian Xiang Kuan, Puxin Xu, Zheng Yan, Iliyan Zarov, Yuchen Zhang, Angela Fan, Melanie Kambadur, Sharan Narang, Aurélien Rodriguez, Robert Stojnic, Sergey Edunov, and Thomas Scialom. Llama 2: Open foundation and fine-tuned chat models. CoRR, abs/2307.09288, 2023. doi: 10.48550/ARXIV.2307.09288. URL https://doi.org/10.48550/arXiv.2307.09288.
- Wang et al. [2018] Alex Wang, Amanpreet Singh, Julian Michael, Felix Hill, Omer Levy, and Samuel R Bowman. Glue: A multi-task benchmark and analysis platform for natural language understanding. arXiv preprint arXiv:1804.07461, 2018.
- Welbl et al. [2017] Johannes Welbl, Nelson F Liu, and Matt Gardner. Crowdsourcing multiple choice science questions. arXiv preprint arXiv:1707.06209, 2017.
- Wettig et al. [2024] Alexander Wettig, Aatmik Gupta, Saumya Malik, and Danqi Chen. Qurating: Selecting high-quality data for training language models, 2024.
- Xia et al. [2022] Mengzhou Xia, Mikel Artetxe, Chunting Zhou, Xi Victoria Lin, Ramakanth Pasunuru, Danqi Chen, Luke Zettlemoyer, and Ves Stoyanov. Training trajectories of language models across scales. arXiv preprint arXiv:2212.09803, 2022.
- Xia et al. [2024] Mengzhou Xia, Sadhika Malladi, Suchin Gururangan, Sanjeev Arora, and Danqi Chen. Less: Selecting influential data for targeted instruction tuning. arXiv preprint arXiv:2402.04333, 2024.
- Xie et al. [2023a] Sang Michael Xie, Hieu Pham, Xuanyi Dong, Nan Du, Hanxiao Liu, Yifeng Lu, Percy Liang, Quoc V Le, Tengyu Ma, and Adams Wei Yu. Doremi: Optimizing data mixtures speeds up language model pretraining. arXiv preprint arXiv:2305.10429, 2023a.
- Xie et al. [2023b] Sang Michael Xie, Shibani Santurkar, Tengyu Ma, and Percy Liang. Data selection for language models via importance resampling. arXiv preprint arXiv:2302.03169, 2023b.
- Yang et al. [2024a] Chen Yang, Junzhuo Li, Xinyao Niu, Xinrun Du, Songyang Gao, Haoran Zhang, Zhaoliang Chen, Xingwei Qu, Ruibin Yuan, Yizhi Li, et al. The fine line: Navigating large language model pretraining with down-streaming capability analysis. arXiv preprint arXiv:2404.01204, 2024a.
- Yang et al. [2024b] Yu Yang, Siddhartha Mishra, Jeffrey N Chiang, and Baharan Mirzasoleiman. Smalltolarge (s2l): Scalable data selection for fine-tuning large language models by summarizing training trajectories of small models. arXiv preprint arXiv:2403.07384, 2024b.
- Ye et al. [2024] Jiasheng Ye, Peiju Liu, Tianxiang Sun, Yunhua Zhou, Jun Zhan, and Xipeng Qiu. Data mixing laws: Optimizing data mixtures by predicting language modeling performance. CoRR, abs/2403.16952, 2024. doi: 10.48550/ARXIV.2403.16952. URL https://doi.org/10.48550/arXiv.2403.16952.
- Yu et al. [2024] Zichun Yu, Spandan Das, and Chenyan Xiong. Mates: Model-aware data selection for efficient pretraining with data influence models, 2024.
- Zellers et al. [2019] Rowan Zellers, Ari Holtzman, Yonatan Bisk, Ali Farhadi, and Yejin Choi. Hellaswag: Can a machine really finish your sentence? arXiv preprint arXiv:1905.07830, 2019.
- Zhang et al. [2024a] Peiyuan Zhang, Guangtao Zeng, Tianduo Wang, and Wei Lu. Tinyllama: An open-source small language model. arXiv preprint arXiv:2401.02385, 2024a.
- Zhang et al. [2024b] Yifan Zhang, Yifan Luo, Yang Yuan, and Andrew C Yao. Autonomous data selection with language models for mathematical texts. In ICLR 2024 Workshop on Navigating and Addressing Data Problems for Foundation Models, 2024b.
Appendix A Limitations
Despite making progress in understanding and optimizing data mixtures for better performance, our method still has several limitations.
The maximum model parameters.
We have verified that small models can be used to predict the optimal data mixture for large-scale runs with up to 1B parameters. However, much larger models are commonly trained with 7B or 70B parameters [58]. Due to compute constraints we leave the verification of RegMix at larger scales to future work.
The benchmark coverage.
Owing to the scarcity of relevant data in the Pile corpus and the relatively small size of our model at 1B scale, their performance on the MMLU benchmark [22] is nearly random and negligible on GSM8K [12]. Consequently, we do not compute the correlation between the validation loss and scores on these challenging benchmarks.
The infinite data assumption.
Most existing data mixing methods assume the availability of unlimited data for each domain. Although we consider this issue in our no Pile-CC experiments in Section 5.3, systematically incorporating the effect of available data into the method remains challenging. Combining our method with the decay coefficient of data reuse proposed in Muennighoff et al. [41] could be an interesting future work to explore, potentially addressing the limited data availability scenario.
The domain assumption.
A common assumption of existing data mixture methods (including ours) is that the domain each example belongs to is known. However, this may not always be the case and the domain needs to be obtained first. Assigning examples to domains is a hard task, which may make it challenging to apply our methods when the domain boundaries are unclear.
The tokenizer assumption.
All existing data mixture methods require the use of proxy models to obtain domain weights. However, a fundamental assumption of these methods is that the proxy model uses the same tokenizer and vocabulary size as the large model. Generalizing weights across different tokenizers poses significant challenges.
Appendix B Ethic statements
Optimizing the data mixture for LLM pre-training raises several ethical issues. First, the optimized data mixture might be biased toward certain domains, which is good for achieving better performance. However, certain domains might be underrepresented or misrepresented, leading the trained models to perform poorly or produce biased results for these domains. Second, though our method aims to optimize the data mixture efficiently, searching for the optimal data mixture still requires computational resources, leading to high energy consumption and environmental impact. It is worthwhile to explore how to further reduce the computation cost.
Appendix C Additional results
C.1 The regression prediction visualization
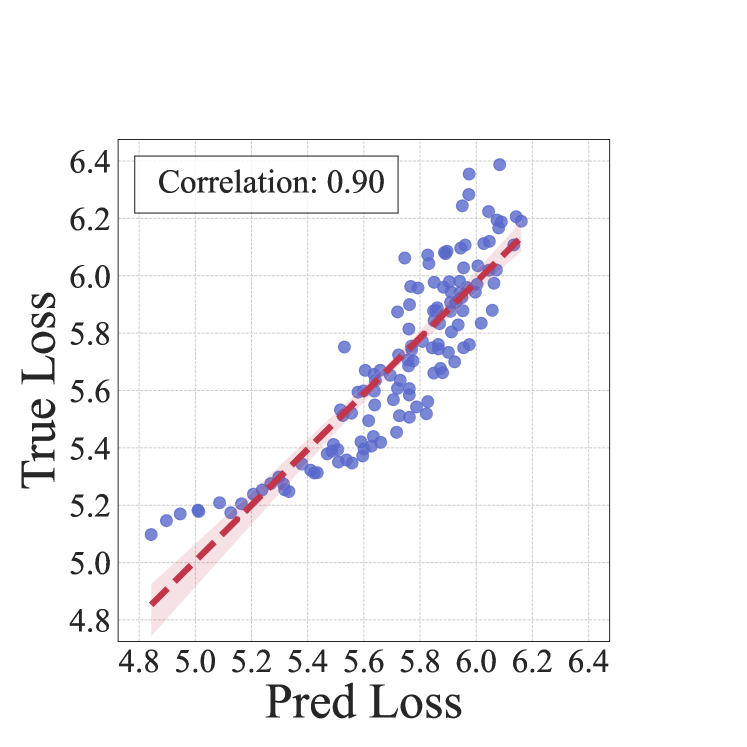
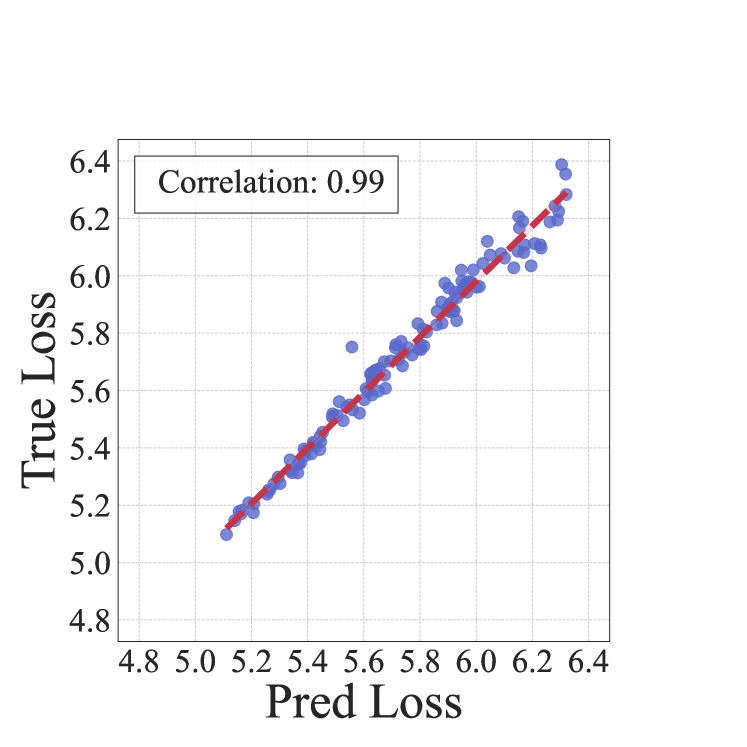
As shown in Figure 8, we visualize the predicted and true loss pairs of the linear model and LightGBM model on the 1M models. The LightGBM model performs better than the linear model, achieving near 100% Spearman Rank Correlation .
C.2 Loss and rank prediction on small models for out-of-distribution setting
In Section 5, we verify the effectiveness of our method in out-of-distribution scenarios where we fully exclude the Pile-CC domain from the pre-training corpus and use the remaining domains to find the optimal data mixture that minimizes Pile-CC validation loss. We also provide the results of regression evaluation under this setting in Figure 5. Similarly, LightGBM model outperforms the linear model and achieves nearly 100% Spearman Rank Correlation .
| Method | 1M models with 1B tokens | ||
|---|---|---|---|
| () | Pearson’s () | MSE () | |
| Linear | 83.00 | 84.18 | 0.08 |
| LightGBM | 95.47 | 95.48 | 0.04 |
C.3 The derived data mixtures
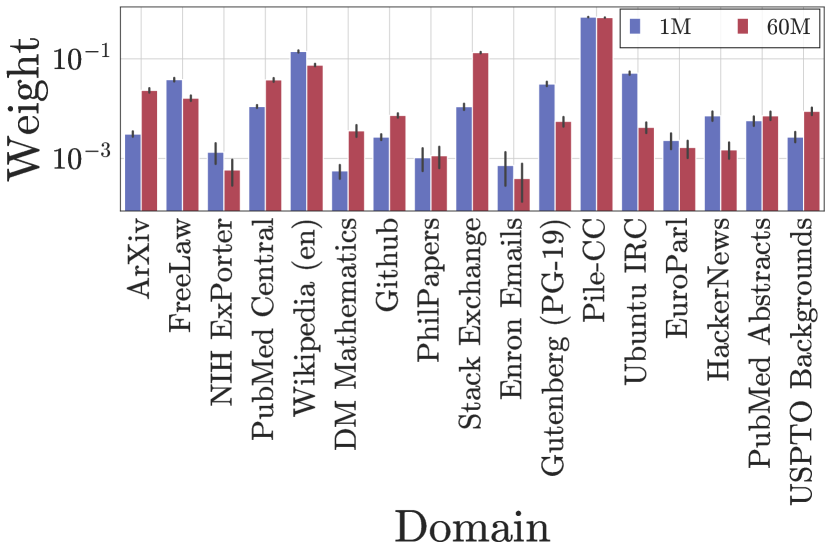
Table 6 presents the derived data mixture weights for different methods. As illustrated, RegMix assigns a high weight of 0.87 to the Pile-CC dataset, aligning with human intuition.
| Domain Weights | Human† | DoReMi† | Pile-CC Only | RegMix |
|---|---|---|---|---|
| ArXiv | 0.134 | 0.004 | 0.0 | 0.001 |
| FreeLaw | 0.049 | 0.005 | 0.0 | 0.001 |
| NIH ExPorter | 0.007 | 0.008 | 0.0 | 0.001 |
| PubMed Central | 0.136 | 0.006 | 0.0 | 0.003 |
| Wikipedia (en) | 0.117 | 0.086 | 0.0 | 0.016 |
| DM Mathematics | 0.025 | 0.002 | 0.0 | 0.0 |
| Github | 0.054 | 0.022 | 0.0 | 0.0 |
| PhilPapers | 0.003 | 0.034 | 0.0 | 0.0 |
| Stack Exchange | 0.118 | 0.019 | 0.0 | 0.0 |
| Enron Emails | 0.004 | 0.009 | 0.0 | 0.002 |
| Gutenberg (PG-19) | 0.025 | 0.009 | 0.0 | 0.002 |
| Pile-CC | 0.142 | 0.743 | 1.0 | 0.87 |
| Ubuntu IRC | 0.009 | 0.011 | 0.0 | 0.064 |
| EuroParl | 0.005 | 0.008 | 0.0 | 0.0 |
| HackerNews | 0.01 | 0.016 | 0.0 | 0.012 |
| PubMed Abstracts | 0.107 | 0.014 | 0.0 | 0.024 |
| USPTO Backgrounds | 0.053 | 0.004 | 0.0 | 0.002 |
C.4 The evaluation results using LightEval
| Benchmark | Human | DoReMi | Pile-CC Only | RegMix |
|---|---|---|---|---|
| ARC Easy [11] | 45.3 0.4 | 46.6 0.7 | 47.1 0.6 | 47.2 0.9 |
| ARC Challenge [11] | 25.5 0.8 | 25.9 0.8 | 25.6 0.5 | 25.6 0.5 |
| CommonsenseQA [56] | 31.8 1.2 | 34.1 0.7 | 34.9 0.3 | 35.0 0.5 |
| HellaSwag [70] | 36.5 0.2 | 41.5 0.3 | 39.7 0.5 | 42.1 0.3 |
| OpenBookQA [39] | 29.8 0.6 | 31.0 0.8 | 31.5 0.4 | 31.8 0.8 |
| PiQA [5] | 65.4 0.6 | 68.7 0.3 | 69.0 0.5 | 69.4 0.5 |
| Social IQA [51] | 41.7 0.3 | 42.0 0.2 | 42.7 0.3 | 42.6 0.7 |
| WinoGrande [50] | 51.1 1.0 | 51.2 0.4 | 50.7 1.0 | 50.9 0.4 |
| MMLU [22] | 28.6 0.2 | 28.9 0.4 | 28.5 0.2 | 28.7 0.3 |
| Average Performance | 39.5 0.3 | 41.1 0.3 | 41.2 0.3 | 41.5 0.2 |
| Beat Human on | – | 5 / 9 | 6 / 9 | 6 / 9 |
| Estimated FLOPs | 0 | 0 |
Following the approach of FineWeb [44], we employ the LightEval 666https://github.com/huggingface/lighteval library to evaluate our models using a suite of benchmarks selected for their stability and suitability. The chosen benchmarks exhibit three key characteristics: low score variance across different data samples, monotonic score improvement during training, and above-random baseline scores for models in the 1B parameter range. Table 7 presents the evaluation results. Our method, RegMix, consistently outperforms the Human baseline on 6 benchmarks. Moreover, RegMix demonstrates superior average performance compared to the DoReMi and the Pile-CC Only methods.
Appendix D URL domain correlation graph

Appendix E Implementation details
We utilize the model architecture proposed by Zhang et al. [71] and create various model variants by modifying the number of layers, the number of attention heads, and the dimensions of token embeddings and hidden states, as illustrated in Figure 8. For tokenization, we employ the GPTNeoX tokenizer [6], which has a vocabulary size of 50,432.
For models with 1M and 60M parameters, we set the training iterations as 1000 and the batch size as 1M tokens, which means the training budget is 1B tokens. Similarly, we train the larger model with 1B parameters with 25000 training iterations and the same batch size thus consuming 25B tokens in total. We set the learning rate as 4e-4 and use the cosine learning rate scheduler.
For linear regression, we employ 5-fold cross-validation with ridge regression to determine the optimal regularization weight from the set [1e-3, 1e-2, 1e-1, 1e0, 1e1, 1e2, 1e3]. For LightGBM, we manually set the number of iterations to 1000 and the learning rate to 1e-2. leaving all other hyperparameters at their default values.
| Model | 1M | 60M | 1B |
|---|---|---|---|
| Vocabulary Size | 50432 | 50432 | 50432 |
| 2 | 10 | 22 | |
| 8 | 8 | 16 | |
| 256 | 768 | 2048 | |
| 512 | 1536 | 5632 |
Appendix F The stability of our method
Previous research [64, 16, 2] has employed small-scale proxy models, trained on substantial volumes of tokens, to predict optimal data mixtures for large language models. However, these approaches often suffer from instability issues. For example, DoReMi [64] reported that different proxy model sizes can result in significantly different predicted data mixtures. Their findings (Figure 8, Appendix) show that using a 280M proxy model resulted in a Pile-CC weight of 0.67, while a 1B proxy model yielded a Pile-CC weight below 0.20. The large discrepancy highlights potential instabilities in previous approaches. To evaluate the robustness of RegMix against such instabilities, we conducted comparative experiments using two distinct model scales: a 1M proxy model and a 60M proxy model. We used their respective training logs to fit regression models and subsequently simulated the top 1024 predictions. The resulting distributions are plotted in Figure 13. Our results demonstrate that while the prediction distributions for the 1M and 60M models are not identical, they exhibit remarkably similar patterns. This consistency suggests that RegMix achieves improved stability compared to previous approaches, even when varying the scale of proxy training models.
Appendix G Detailed experimental results
To facilitate future research, we share all the data mixtures and the corresponding downstream performances of the 64 trained models with 1B parameters.
| Model Index | 1 | 2 | 3 | 4 | 5 | 6 | 7 | 8 |
| Pre-training Domain Weights | ||||||||
| ArXiv | 0.123 | 0.066 | 0.055 | 0.059 | 0.201 | 0.036 | 0.042 | 0.126 |
| FreeLaw | 0.065 | 0.071 | 0.052 | 0.083 | 0.004 | 0.212 | 0.113 | 0.21 |
| NIH ExPorter | 0.0 | 0.0 | 0.004 | 0.0 | 0.014 | 0.0 | 0.0 | 0.0 |
| PubMed Central | 0.126 | 0.211 | 0.177 | 0.174 | 0.243 | 0.153 | 0.089 | 0.123 |
| Wikipedia (en) | 0.036 | 0.013 | 0.02 | 0.177 | 0.01 | 0.005 | 0.022 | 0.055 |
| DM Mathematics | 0.0 | 0.0 | 0.011 | 0.0 | 0.03 | 0.047 | 0.007 | 0.008 |
| Github | 0.034 | 0.153 | 0.095 | 0.194 | 0.017 | 0.205 | 0.028 | 0.008 |
| PhilPapers | 0.0 | 0.033 | 0.0 | 0.0 | 0.0 | 0.0 | 0.0 | 0.0 |
| Stack Exchange | 0.039 | 0.097 | 0.18 | 0.0 | 0.103 | 0.075 | 0.011 | 0.129 |
| Enron Emails | 0.0 | 0.0 | 0.0 | 0.0 | 0.0 | 0.0 | 0.0 | 0.0 |
| Gutenberg (PG-19) | 0.0 | 0.0 | 0.016 | 0.0 | 0.002 | 0.0 | 0.217 | 0.035 |
| Pile-CC | 0.27 | 0.101 | 0.381 | 0.192 | 0.359 | 0.209 | 0.232 | 0.288 |
| Ubuntu IRC | 0.0 | 0.0 | 0.001 | 0.005 | 0.0 | 0.0 | 0.08 | 0.0 |
| EuroParl | 0.0 | 0.0 | 0.0 | 0.109 | 0.0 | 0.001 | 0.117 | 0.0 |
| HackerNews | 0.0 | 0.011 | 0.005 | 0.0 | 0.0 | 0.0 | 0.018 | 0.0 |
| PubMed Abstracts | 0.0 | 0.136 | 0.0 | 0.005 | 0.014 | 0.002 | 0.011 | 0.016 |
| USPTO Backgrounds | 0.307 | 0.106 | 0.003 | 0.0 | 0.002 | 0.055 | 0.011 | 0.0 |
| Downstream Performance (%) | ||||||||
| Social IQA | 33.27 | 33.33 | 33.62 | 33.53 | 33.49 | 33.56 | 33.62 | 33.55 |
| HellaSwag | 40.58 | 36.86 | 40.58 | 36.06 | 40.07 | 37.85 | 37.93 | 39.59 |
| PiQA | 67.29 | 65.14 | 67.97 | 64.66 | 67.03 | 65.36 | 66.0 | 66.55 |
| OpenBookQA | 28.63 | 27.87 | 29.33 | 29.1 | 29.23 | 28.33 | 29.13 | 28.73 |
| Lambada | 29.17 | 26.86 | 31.55 | 27.11 | 29.16 | 28.92 | 31.53 | 30.92 |
| SciQ | 80.68 | 79.98 | 81.05 | 80.8 | 82.4 | 79.88 | 78.67 | 79.7 |
| COPA | 70.5 | 63.83 | 69.17 | 65.0 | 67.5 | 66.0 | 66.67 | 68.67 |
| RACE | 29.47 | 30.0 | 32.11 | 28.82 | 31.13 | 30.06 | 29.9 | 30.75 |
| ARC Easy | 50.03 | 48.72 | 50.01 | 46.64 | 51.06 | 47.46 | 46.75 | 48.39 |
| LogiQA | 23.76 | 24.17 | 25.29 | 25.29 | 24.55 | 25.96 | 25.45 | 26.32 |
| QQP | 55.71 | 55.9 | 54.84 | 56.52 | 54.01 | 56.34 | 52.35 | 54.2 |
| WinoGrande | 51.54 | 51.59 | 51.39 | 50.91 | 53.13 | 52.26 | 51.26 | 51.45 |
| MultiRC | 52.65 | 53.39 | 51.89 | 50.92 | 49.03 | 53.09 | 53.64 | 50.23 |
| Avg | 47.18 | 45.97 | 47.60 | 45.80 | 47.06 | 46.54 | 46.38 | 46.85 |
| Model Index | 9 | 10 | 11 | 12 | 13 | 14 | 15 | 16 |
| Pre-training Domain Weights | ||||||||
| ArXiv | 0.184 | 0.226 | 0.107 | 0.139 | 0.101 | 0.099 | 0.251 | 0.147 |
| FreeLaw | 0.009 | 0.046 | 0.276 | 0.048 | 0.047 | 0.002 | 0.024 | 0.046 |
| NIH ExPorter | 0.0 | 0.0 | 0.0 | 0.0 | 0.001 | 0.022 | 0.0 | 0.0 |
| PubMed Central | 0.094 | 0.261 | 0.157 | 0.184 | 0.119 | 0.501 | 0.101 | 0.196 |
| Wikipedia (en) | 0.035 | 0.001 | 0.009 | 0.032 | 0.049 | 0.003 | 0.17 | 0.14 |
| DM Mathematics | 0.007 | 0.001 | 0.0 | 0.001 | 0.092 | 0.0 | 0.0 | 0.008 |
| Github | 0.106 | 0.189 | 0.024 | 0.055 | 0.078 | 0.017 | 0.048 | 0.237 |
| PhilPapers | 0.0 | 0.0 | 0.0 | 0.0 | 0.0 | 0.043 | 0.019 | 0.0 |
| Stack Exchange | 0.142 | 0.077 | 0.051 | 0.109 | 0.002 | 0.065 | 0.007 | 0.06 |
| Enron Emails | 0.0 | 0.0 | 0.0 | 0.0 | 0.0 | 0.0 | 0.0 | 0.0 |
| Gutenberg (PG-19) | 0.0 | 0.01 | 0.001 | 0.0 | 0.051 | 0.091 | 0.0 | 0.012 |
| Pile-CC | 0.341 | 0.114 | 0.273 | 0.354 | 0.283 | 0.055 | 0.339 | 0.111 |
| Ubuntu IRC | 0.0 | 0.003 | 0.0 | 0.0 | 0.057 | 0.0 | 0.017 | 0.0 |
| EuroParl | 0.0 | 0.0 | 0.003 | 0.003 | 0.0 | 0.006 | 0.0 | 0.0 |
| HackerNews | 0.002 | 0.0 | 0.034 | 0.0 | 0.0 | 0.0 | 0.0 | 0.001 |
| PubMed Abstracts | 0.005 | 0.039 | 0.009 | 0.075 | 0.061 | 0.007 | 0.0 | 0.01 |
| USPTO Backgrounds | 0.075 | 0.033 | 0.056 | 0.0 | 0.057 | 0.088 | 0.024 | 0.032 |
| Downstream Performance (%) | ||||||||
| Social IQA | 33.43 | 33.21 | 33.31 | 33.17 | 33.28 | 32.43 | 33.57 | 33.7 |
| HellaSwag | 40.05 | 35.89 | 39.55 | 39.89 | 38.63 | 36.18 | 39.52 | 35.94 |
| PiQA | 66.6 | 64.74 | 66.29 | 66.27 | 66.9 | 64.05 | 66.7 | 64.51 |
| OpenBookQA | 28.87 | 26.6 | 29.33 | 28.73 | 29.4 | 27.87 | 29.67 | 27.83 |
| Lambada | 31.39 | 27.37 | 30.32 | 30.31 | 31.38 | 26.25 | 29.86 | 26.95 |
| SciQ | 81.1 | 79.12 | 79.97 | 82.85 | 79.42 | 81.4 | 81.38 | 81.23 |
| COPA | 67.0 | 64.5 | 66.83 | 69.5 | 67.33 | 65.83 | 69.5 | 66.33 |
| RACE | 30.57 | 29.63 | 30.49 | 30.85 | 30.35 | 28.66 | 31.21 | 29.57 |
| ARC Easy | 50.66 | 47.74 | 47.47 | 50.18 | 49.92 | 49.52 | 50.73 | 48.65 |
| LogiQA | 23.6 | 25.65 | 26.37 | 23.81 | 25.58 | 26.29 | 25.86 | 25.12 |
| QQP | 54.89 | 54.79 | 54.2 | 55.23 | 53.69 | 57.09 | 53.95 | 54.24 |
| WinoGrande | 50.83 | 51.84 | 51.05 | 51.83 | 52.12 | 52.0 | 51.01 | 51.82 |
| MultiRC | 54.18 | 54.48 | 50.17 | 52.12 | 51.42 | 52.69 | 51.87 | 53.48 |
| Avg | 47.17 | 45.81 | 46.57 | 47.29 | 46.88 | 46.17 | 47.30 | 46.11 |
| Model Index | 17 | 18 | 19 | 20 | 21 | 22 | 23 | 24 |
| Pre-training Domain Weights | ||||||||
| ArXiv | 0.228 | 0.0 | 0.501 | 0.101 | 0.047 | 0.031 | 0.078 | 0.068 |
| FreeLaw | 0.016 | 0.019 | 0.005 | 0.03 | 0.014 | 0.073 | 0.024 | 0.181 |
| NIH ExPorter | 0.0 | 0.0 | 0.0 | 0.0 | 0.0 | 0.0 | 0.0 | 0.0 |
| PubMed Central | 0.204 | 0.084 | 0.156 | 0.272 | 0.163 | 0.053 | 0.302 | 0.126 |
| Wikipedia (en) | 0.02 | 0.159 | 0.17 | 0.021 | 0.218 | 0.129 | 0.027 | 0.07 |
| DM Mathematics | 0.036 | 0.009 | 0.0 | 0.099 | 0.0 | 0.0 | 0.0 | 0.001 |
| Github | 0.02 | 0.012 | 0.022 | 0.124 | 0.137 | 0.066 | 0.04 | 0.195 |
| PhilPapers | 0.004 | 0.0 | 0.017 | 0.0 | 0.0 | 0.0 | 0.0 | 0.0 |
| Stack Exchange | 0.002 | 0.052 | 0.062 | 0.113 | 0.173 | 0.12 | 0.007 | 0.24 |
| Enron Emails | 0.0 | 0.0 | 0.0 | 0.0 | 0.0 | 0.0 | 0.0 | 0.0 |
| Gutenberg (PG-19) | 0.0 | 0.001 | 0.002 | 0.054 | 0.001 | 0.089 | 0.002 | 0.0 |
| Pile-CC | 0.244 | 0.361 | 0.061 | 0.154 | 0.19 | 0.057 | 0.499 | 0.023 |
| Ubuntu IRC | 0.0 | 0.296 | 0.002 | 0.0 | 0.029 | 0.001 | 0.0 | 0.0 |
| EuroParl | 0.004 | 0.0 | 0.0 | 0.001 | 0.007 | 0.0 | 0.0 | 0.0 |
| HackerNews | 0.0 | 0.0 | 0.0 | 0.0 | 0.011 | 0.031 | 0.0 | 0.0 |
| PubMed Abstracts | 0.196 | 0.001 | 0.0 | 0.011 | 0.008 | 0.351 | 0.0 | 0.059 |
| USPTO Backgrounds | 0.026 | 0.007 | 0.002 | 0.02 | 0.001 | 0.001 | 0.021 | 0.036 |
| Downstream Performance (%) | ||||||||
| Social IQA | 33.89 | 33.31 | 33.53 | 33.38 | 33.75 | 33.24 | 33.56 | 33.71 |
| HellaSwag | 38.68 | 39.9 | 34.67 | 37.12 | 37.44 | 36.07 | 42.15 | 34.67 |
| PiQA | 66.83 | 67.39 | 63.33 | 64.83 | 65.0 | 63.68 | 67.8 | 62.99 |
| OpenBookQA | 28.13 | 30.67 | 28.03 | 29.4 | 27.67 | 27.77 | 29.37 | 25.83 |
| Lambada | 28.78 | 28.56 | 24.13 | 29.41 | 27.67 | 28.03 | 33.47 | 24.04 |
| SciQ | 79.6 | 78.83 | 77.42 | 78.98 | 78.95 | 78.72 | 81.83 | 79.12 |
| COPA | 65.17 | 68.17 | 65.33 | 67.33 | 67.67 | 62.67 | 69.83 | 65.83 |
| RACE | 28.74 | 30.03 | 29.76 | 29.49 | 30.77 | 29.76 | 31.21 | 27.91 |
| ARC Easy | 48.86 | 49.42 | 47.9 | 48.3 | 47.88 | 46.68 | 50.92 | 45.24 |
| LogiQA | 25.91 | 26.34 | 26.24 | 25.76 | 26.11 | 26.24 | 24.17 | 25.91 |
| QQP | 53.35 | 53.18 | 50.61 | 51.49 | 54.27 | 54.99 | 52.77 | 55.19 |
| WinoGrande | 52.54 | 51.17 | 52.01 | 51.09 | 52.13 | 52.03 | 52.5 | 50.28 |
| MultiRC | 51.49 | 52.45 | 55.4 | 54.87 | 51.73 | 49.49 | 50.61 | 50.29 |
| Avg | 46.30 | 46.88 | 45.26 | 46.27 | 46.23 | 45.34 | 47.71 | 44.69 |
| Model Index | 25 | 26 | 27 | 28 | 29 | 30 | 31 | 32 |
| Pre-training Domain Weights | ||||||||
| ArXiv | 0.074 | 0.076 | 0.05 | 0.067 | 0.244 | 0.073 | 0.234 | 0.08 |
| FreeLaw | 0.214 | 0.085 | 0.039 | 0.052 | 0.023 | 0.087 | 0.015 | 0.134 |
| NIH ExPorter | 0.0 | 0.0 | 0.0 | 0.0 | 0.0 | 0.026 | 0.0 | 0.0 |
| PubMed Central | 0.135 | 0.214 | 0.049 | 0.221 | 0.064 | 0.175 | 0.086 | 0.255 |
| Wikipedia (en) | 0.011 | 0.005 | 0.068 | 0.052 | 0.151 | 0.017 | 0.287 | 0.058 |
| DM Mathematics | 0.0 | 0.0 | 0.019 | 0.0 | 0.0 | 0.101 | 0.026 | 0.037 |
| Github | 0.121 | 0.127 | 0.042 | 0.101 | 0.073 | 0.1 | 0.04 | 0.171 |
| PhilPapers | 0.006 | 0.0 | 0.0 | 0.0 | 0.0 | 0.019 | 0.0 | 0.0 |
| Stack Exchange | 0.024 | 0.204 | 0.146 | 0.001 | 0.02 | 0.054 | 0.022 | 0.015 |
| Enron Emails | 0.0 | 0.0 | 0.0 | 0.0 | 0.0 | 0.0 | 0.0 | 0.0 |
| Gutenberg (PG-19) | 0.001 | 0.147 | 0.01 | 0.265 | 0.017 | 0.0 | 0.0 | 0.045 |
| Pile-CC | 0.088 | 0.138 | 0.302 | 0.214 | 0.383 | 0.12 | 0.134 | 0.182 |
| Ubuntu IRC | 0.001 | 0.002 | 0.0 | 0.026 | 0.01 | 0.134 | 0.0 | 0.0 |
| EuroParl | 0.0 | 0.0 | 0.008 | 0.0 | 0.0 | 0.037 | 0.0 | 0.0 |
| HackerNews | 0.004 | 0.0 | 0.0 | 0.0 | 0.0 | 0.0 | 0.0 | 0.0 |
| PubMed Abstracts | 0.132 | 0.001 | 0.01 | 0.002 | 0.007 | 0.053 | 0.022 | 0.016 |
| USPTO Backgrounds | 0.189 | 0.001 | 0.255 | 0.0 | 0.007 | 0.002 | 0.134 | 0.008 |
| Downstream Performance (%) | ||||||||
| Social IQA | 33.51 | 33.4 | 33.59 | 33.52 | 33.53 | 33.49 | 33.16 | 33.56 |
| HellaSwag | 36.75 | 36.97 | 40.81 | 38.25 | 40.28 | 35.71 | 37.37 | 37.39 |
| PiQA | 64.09 | 64.74 | 67.97 | 66.15 | 66.88 | 63.84 | 64.47 | 65.05 |
| OpenBookQA | 29.47 | 28.7 | 29.57 | 29.77 | 29.5 | 29.13 | 29.47 | 28.0 |
| Lambada | 26.69 | 33.0 | 31.6 | 33.08 | 31.49 | 27.69 | 26.99 | 29.54 |
| SciQ | 80.03 | 79.17 | 80.12 | 80.22 | 81.92 | 78.23 | 77.42 | 80.87 |
| COPA | 67.67 | 65.5 | 69.0 | 65.67 | 68.33 | 63.33 | 64.67 | 67.17 |
| RACE | 30.05 | 30.19 | 30.96 | 30.37 | 30.08 | 29.62 | 30.13 | 29.92 |
| ARC Easy | 47.5 | 46.9 | 50.26 | 48.57 | 50.55 | 46.96 | 48.77 | 48.79 |
| LogiQA | 27.24 | 25.55 | 25.86 | 24.37 | 25.32 | 25.12 | 26.4 | 24.3 |
| QQP | 49.68 | 55.43 | 50.94 | 50.91 | 51.99 | 53.53 | 49.53 | 51.36 |
| WinoGrande | 51.68 | 52.12 | 51.93 | 51.5 | 52.32 | 51.67 | 52.13 | 52.63 |
| MultiRC | 51.24 | 51.91 | 50.33 | 52.42 | 52.52 | 54.04 | 52.05 | 53.04 |
| Avg | 45.82 | 46.43 | 47.15 | 46.52 | 47.29 | 45.57 | 45.58 | 46.28 |
| Model Index | 33 | 34 | 35 | 36 | 37 | 38 | 39 | 40 |
| Pre-training Domain Weights | ||||||||
| ArXiv | 0.105 | 0.295 | 0.142 | 0.279 | 0.052 | 0.251 | 0.239 | 0.157 |
| FreeLaw | 0.007 | 0.029 | 0.122 | 0.01 | 0.07 | 0.007 | 0.087 | 0.062 |
| NIH ExPorter | 0.0 | 0.0 | 0.001 | 0.0 | 0.253 | 0.007 | 0.0 | 0.0 |
| PubMed Central | 0.407 | 0.061 | 0.065 | 0.184 | 0.4 | 0.331 | 0.223 | 0.039 |
| Wikipedia (en) | 0.045 | 0.124 | 0.0 | 0.0 | 0.003 | 0.107 | 0.029 | 0.096 |
| DM Mathematics | 0.054 | 0.0 | 0.001 | 0.0 | 0.0 | 0.0 | 0.0 | 0.007 |
| Github | 0.017 | 0.006 | 0.006 | 0.108 | 0.033 | 0.13 | 0.049 | 0.057 |
| PhilPapers | 0.0 | 0.0 | 0.003 | 0.0 | 0.0 | 0.0 | 0.0 | 0.0 |
| Stack Exchange | 0.126 | 0.006 | 0.001 | 0.097 | 0.019 | 0.021 | 0.202 | 0.174 |
| Enron Emails | 0.0 | 0.0 | 0.0 | 0.0 | 0.0 | 0.0 | 0.0 | 0.0 |
| Gutenberg (PG-19) | 0.009 | 0.047 | 0.014 | 0.039 | 0.0 | 0.001 | 0.0 | 0.015 |
| Pile-CC | 0.167 | 0.364 | 0.618 | 0.198 | 0.031 | 0.006 | 0.156 | 0.181 |
| Ubuntu IRC | 0.0 | 0.0 | 0.001 | 0.0 | 0.0 | 0.12 | 0.0 | 0.0 |
| EuroParl | 0.007 | 0.026 | 0.0 | 0.0 | 0.0 | 0.0 | 0.0 | 0.089 |
| HackerNews | 0.0 | 0.004 | 0.0 | 0.0 | 0.018 | 0.0 | 0.0 | 0.012 |
| PubMed Abstracts | 0.047 | 0.0 | 0.0 | 0.083 | 0.002 | 0.005 | 0.012 | 0.016 |
| USPTO Backgrounds | 0.008 | 0.037 | 0.025 | 0.002 | 0.119 | 0.014 | 0.001 | 0.095 |
| Downstream Performance (%) | ||||||||
| Social IQA | 33.48 | 33.28 | 33.35 | 33.29 | 33.63 | 33.61 | 33.21 | 33.61 |
| HellaSwag | 38.0 | 40.18 | 43.37 | 37.69 | 32.96 | 32.98 | 37.31 | 37.79 |
| PiQA | 65.3 | 66.68 | 69.04 | 66.46 | 62.25 | 60.17 | 65.24 | 65.32 |
| OpenBookQA | 29.43 | 30.37 | 30.43 | 27.63 | 26.43 | 26.83 | 27.97 | 28.7 |
| Lambada | 26.59 | 31.46 | 31.71 | 30.21 | 18.92 | 20.29 | 28.1 | 28.58 |
| SciQ | 79.82 | 80.58 | 82.13 | 80.83 | 76.73 | 77.9 | 79.12 | 79.6 |
| COPA | 64.33 | 69.33 | 67.0 | 67.83 | 61.5 | 62.67 | 64.67 | 66.0 |
| RACE | 30.03 | 30.16 | 32.47 | 30.49 | 29.27 | 28.12 | 30.11 | 30.21 |
| ARC Easy | 48.86 | 49.88 | 52.22 | 48.32 | 44.86 | 45.54 | 48.15 | 48.86 |
| LogiQA | 25.91 | 24.3 | 23.35 | 24.96 | 26.19 | 27.68 | 25.47 | 25.37 |
| QQP | 56.06 | 56.56 | 52.57 | 56.7 | 52.54 | 48.04 | 49.81 | 57.12 |
| WinoGrande | 50.92 | 50.97 | 52.39 | 52.7 | 52.3 | 51.68 | 51.42 | 52.8 |
| MultiRC | 53.09 | 49.97 | 52.18 | 49.05 | 53.78 | 52.27 | 51.45 | 55.68 |
| Avg | 46.29 | 47.21 | 47.86 | 46.63 | 43.95 | 43.67 | 45.54 | 46.90 |
| Model Index | 41 | 42 | 43 | 44 | 45 | 46 | 47 | 48 |
| Pre-training Domain Weights | ||||||||
| ArXiv | 0.422 | 0.466 | 0.027 | 0.063 | 0.121 | 0.041 | 0.033 | 0.114 |
| FreeLaw | 0.213 | 0.075 | 0.041 | 0.089 | 0.008 | 0.025 | 0.048 | 0.116 |
| NIH ExPorter | 0.0 | 0.0 | 0.0 | 0.0 | 0.0 | 0.0 | 0.0 | 0.0 |
| PubMed Central | 0.08 | 0.07 | 0.116 | 0.219 | 0.093 | 0.111 | 0.22 | 0.081 |
| Wikipedia (en) | 0.019 | 0.006 | 0.021 | 0.001 | 0.008 | 0.092 | 0.027 | 0.038 |
| DM Mathematics | 0.001 | 0.0 | 0.001 | 0.05 | 0.016 | 0.062 | 0.002 | 0.031 |
| Github | 0.026 | 0.044 | 0.067 | 0.291 | 0.012 | 0.121 | 0.169 | 0.109 |
| PhilPapers | 0.0 | 0.0 | 0.0 | 0.0 | 0.0 | 0.0 | 0.0 | 0.0 |
| Stack Exchange | 0.003 | 0.078 | 0.137 | 0.002 | 0.408 | 0.124 | 0.082 | 0.001 |
| Enron Emails | 0.0 | 0.0 | 0.0 | 0.0 | 0.0 | 0.0 | 0.0 | 0.0 |
| Gutenberg (PG-19) | 0.01 | 0.0 | 0.001 | 0.0 | 0.006 | 0.0 | 0.057 | 0.021 |
| Pile-CC | 0.026 | 0.2 | 0.549 | 0.238 | 0.156 | 0.214 | 0.312 | 0.428 |
| Ubuntu IRC | 0.0 | 0.0 | 0.002 | 0.0 | 0.013 | 0.129 | 0.0 | 0.001 |
| EuroParl | 0.0 | 0.0 | 0.0 | 0.001 | 0.001 | 0.006 | 0.0 | 0.0 |
| HackerNews | 0.0 | 0.0 | 0.0 | 0.001 | 0.0 | 0.012 | 0.0 | 0.0 |
| PubMed Abstracts | 0.101 | 0.028 | 0.002 | 0.045 | 0.005 | 0.012 | 0.0 | 0.031 |
| USPTO Backgrounds | 0.099 | 0.031 | 0.037 | 0.0 | 0.153 | 0.052 | 0.05 | 0.029 |
| Downstream Performance (%) | ||||||||
| Social IQA | 33.49 | 33.43 | 33.07 | 33.28 | 33.44 | 33.08 | 33.78 | 33.17 |
| HellaSwag | 34.51 | 37.59 | 42.69 | 37.37 | 38.31 | 38.3 | 39.67 | 41.07 |
| PiQA | 62.24 | 65.58 | 68.05 | 66.62 | 66.54 | 65.52 | 66.98 | 67.21 |
| OpenBookQA | 27.1 | 28.77 | 28.9 | 28.07 | 28.07 | 27.6 | 31.17 | 29.73 |
| Lambada | 22.78 | 26.99 | 31.34 | 29.51 | 27.87 | 29.47 | 30.34 | 32.71 |
| SciQ | 77.78 | 80.25 | 79.47 | 80.25 | 80.7 | 79.72 | 81.35 | 81.77 |
| COPA | 64.0 | 66.33 | 67.0 | 67.0 | 67.33 | 68.33 | 67.17 | 67.67 |
| RACE | 28.33 | 28.82 | 30.78 | 30.8 | 30.08 | 30.24 | 30.24 | 30.67 |
| ARC Easy | 45.48 | 48.64 | 51.49 | 46.99 | 48.79 | 48.05 | 49.58 | 49.49 |
| LogiQA | 24.83 | 24.96 | 24.76 | 23.25 | 26.06 | 25.55 | 24.32 | 24.68 |
| QQP | 50.27 | 54.73 | 53.96 | 57.0 | 53.73 | 51.19 | 57.52 | 56.91 |
| WinoGrande | 51.79 | 51.63 | 51.32 | 50.76 | 53.18 | 52.45 | 50.72 | 52.24 |
| MultiRC | 54.03 | 53.96 | 48.91 | 50.74 | 53.01 | 50.89 | 47.63 | 53.84 |
| Avg | 44.35 | 46.28 | 47.06 | 46.28 | 46.7 | 46.18 | 46.96 | 47.78 |
| Model Index | 49 | 50 | 51 | 52 | 53 | 54 | 55 | 56 |
| Pre-training Domain Weights | ||||||||
| ArXiv | 0.082 | 0.091 | 0.194 | 0.011 | 0.039 | 0.294 | 0.012 | 0.25 |
| FreeLaw | 0.12 | 0.084 | 0.04 | 0.022 | 0.063 | 0.119 | 0.16 | 0.058 |
| NIH ExPorter | 0.0 | 0.0 | 0.022 | 0.0 | 0.0 | 0.0 | 0.0 | 0.0 |
| PubMed Central | 0.051 | 0.343 | 0.126 | 0.37 | 0.079 | 0.186 | 0.311 | 0.104 |
| Wikipedia (en) | 0.067 | 0.0 | 0.046 | 0.006 | 0.0 | 0.023 | 0.014 | 0.044 |
| DM Mathematics | 0.034 | 0.174 | 0.028 | 0.0 | 0.002 | 0.005 | 0.0 | 0.0 |
| Github | 0.205 | 0.144 | 0.048 | 0.14 | 0.482 | 0.023 | 0.117 | 0.028 |
| PhilPapers | 0.0 | 0.0 | 0.01 | 0.0 | 0.0 | 0.0 | 0.0 | 0.0 |
| Stack Exchange | 0.036 | 0.009 | 0.099 | 0.058 | 0.012 | 0.001 | 0.004 | 0.06 |
| Enron Emails | 0.0 | 0.0 | 0.0 | 0.0 | 0.0 | 0.0 | 0.0 | 0.0 |
| Gutenberg (PG-19) | 0.0 | 0.019 | 0.04 | 0.216 | 0.0 | 0.002 | 0.236 | 0.0 |
| Pile-CC | 0.371 | 0.122 | 0.229 | 0.101 | 0.269 | 0.213 | 0.037 | 0.363 |
| Ubuntu IRC | 0.0 | 0.001 | 0.0 | 0.033 | 0.0 | 0.023 | 0.007 | 0.0 |
| EuroParl | 0.0 | 0.003 | 0.002 | 0.0 | 0.0 | 0.0 | 0.0 | 0.0 |
| HackerNews | 0.0 | 0.001 | 0.0 | 0.002 | 0.0 | 0.0 | 0.0 | 0.0 |
| PubMed Abstracts | 0.029 | 0.006 | 0.089 | 0.026 | 0.002 | 0.024 | 0.007 | 0.086 |
| USPTO Backgrounds | 0.004 | 0.004 | 0.027 | 0.015 | 0.052 | 0.088 | 0.094 | 0.007 |
| Downstream Performance (%) | ||||||||
| Social IQA | 33.53 | 33.74 | 33.37 | 33.41 | 32.96 | 33.88 | 33.75 | 33.79 |
| HellaSwag | 39.09 | 35.65 | 38.68 | 36.07 | 37.68 | 38.53 | 35.4 | 40.5 |
| PiQA | 66.81 | 64.58 | 65.68 | 63.99 | 65.85 | 65.76 | 64.51 | 66.89 |
| OpenBookQA | 29.13 | 27.57 | 28.27 | 29.1 | 29.43 | 28.73 | 28.3 | 29.87 |
| Lambada | 30.23 | 26.19 | 30.29 | 30.84 | 29.76 | 29.03 | 28.63 | 30.74 |
| SciQ | 79.9 | 80.83 | 78.4 | 80.03 | 81.38 | 80.92 | 77.75 | 82.07 |
| COPA | 68.17 | 61.83 | 67.0 | 66.0 | 66.17 | 63.17 | 66.33 | 64.0 |
| RACE | 31.42 | 29.35 | 30.41 | 31.08 | 30.77 | 29.73 | 30.8 | 31.42 |
| ARC Easy | 49.54 | 47.71 | 49.02 | 47.64 | 48.38 | 49.36 | 46.96 | 51.22 |
| LogiQA | 24.99 | 24.58 | 25.32 | 24.91 | 25.17 | 26.22 | 24.63 | 24.91 |
| QQP | 54.06 | 56.48 | 50.96 | 56.62 | 56.45 | 53.86 | 53.85 | 53.26 |
| WinoGrande | 50.51 | 50.26 | 51.83 | 51.33 | 52.18 | 51.89 | 51.59 | 50.5 |
| MultiRC | 50.25 | 54.37 | 50.94 | 52.38 | 51.21 | 55.34 | 54.52 | 50.5 |
| Avg | 46.74 | 45.63 | 46.17 | 46.42 | 46.72 | 46.65 | 45.92 | 46.90 |
| Model Index | 57 | 58 | 59 | 60 | 61 | 62 | 63 | 64 |
| Pre-training Domain Weights | ||||||||
| ArXiv | 0.137 | 0.176 | 0.471 | 0.081 | 0.107 | 0.278 | 0.119 | 0.131 |
| FreeLaw | 0.085 | 0.007 | 0.038 | 0.153 | 0.016 | 0.141 | 0.085 | 0.006 |
| NIH ExPorter | 0.0 | 0.0 | 0.0 | 0.0 | 0.0 | 0.0 | 0.027 | 0.03 |
| PubMed Central | 0.085 | 0.05 | 0.218 | 0.17 | 0.218 | 0.257 | 0.294 | 0.075 |
| Wikipedia (en) | 0.059 | 0.122 | 0.005 | 0.017 | 0.003 | 0.099 | 0.02 | 0.0 |
| DM Mathematics | 0.0 | 0.001 | 0.0 | 0.033 | 0.0 | 0.009 | 0.073 | 0.093 |
| Github | 0.039 | 0.088 | 0.097 | 0.041 | 0.238 | 0.041 | 0.038 | 0.369 |
| PhilPapers | 0.0 | 0.069 | 0.0 | 0.048 | 0.0 | 0.0 | 0.0 | 0.0 |
| Stack Exchange | 0.017 | 0.05 | 0.016 | 0.077 | 0.113 | 0.027 | 0.046 | 0.06 |
| Enron Emails | 0.009 | 0.0 | 0.0 | 0.0 | 0.0 | 0.0 | 0.001 | 0.0 |
| Gutenberg (PG-19) | 0.007 | 0.0 | 0.018 | 0.001 | 0.0 | 0.0 | 0.026 | 0.002 |
| Pile-CC | 0.435 | 0.339 | 0.112 | 0.268 | 0.272 | 0.128 | 0.232 | 0.188 |
| Ubuntu IRC | 0.0 | 0.006 | 0.017 | 0.095 | 0.001 | 0.0 | 0.0 | 0.001 |
| EuroParl | 0.0 | 0.012 | 0.0 | 0.0 | 0.0 | 0.0 | 0.001 | 0.003 |
| HackerNews | 0.001 | 0.0 | 0.0 | 0.0 | 0.0 | 0.0 | 0.0 | 0.017 |
| PubMed Abstracts | 0.004 | 0.004 | 0.001 | 0.0 | 0.02 | 0.0 | 0.013 | 0.016 |
| USPTO Backgrounds | 0.122 | 0.077 | 0.006 | 0.016 | 0.013 | 0.02 | 0.025 | 0.009 |
| Downstream Performance (%) | ||||||||
| Social IQA | 33.24 | 33.3 | 33.56 | 33.54 | 33.42 | 33.84 | 33.32 | 33.55 |
| HellaSwag | 41.74 | 39.63 | 35.36 | 38.83 | 38.53 | 36.46 | 38.8 | 36.43 |
| PiQA | 68.07 | 67.31 | 64.44 | 66.38 | 66.5 | 64.74 | 66.54 | 64.87 |
| OpenBookQA | 29.2 | 29.5 | 28.1 | 27.97 | 27.83 | 27.37 | 28.83 | 27.87 |
| Lambada | 31.79 | 31.11 | 27.32 | 30.17 | 28.75 | 26.22 | 30.38 | 26.25 |
| SciQ | 80.42 | 79.83 | 80.85 | 79.6 | 78.93 | 80.05 | 79.5 | 78.65 |
| COPA | 66.17 | 69.0 | 64.0 | 64.83 | 67.0 | 64.0 | 66.0 | 66.83 |
| RACE | 31.39 | 29.82 | 29.67 | 30.08 | 29.98 | 29.46 | 30.37 | 29.19 |
| ARC Easy | 51.14 | 49.24 | 47.13 | 47.88 | 48.2 | 47.09 | 49.09 | 46.9 |
| LogiQA | 25.19 | 25.93 | 23.68 | 25.17 | 25.7 | 25.52 | 26.5 | 26.65 |
| QQP | 55.37 | 54.46 | 52.73 | 53.17 | 59.65 | 58.15 | 57.5 | 55.31 |
| WinoGrande | 53.21 | 51.46 | 50.83 | 52.16 | 52.37 | 51.41 | 51.63 | 51.85 |
| MultiRC | 53.58 | 52.31 | 52.22 | 53.03 | 50.41 | 52.17 | 52.27 | 51.5 |
| Avg | 47.73 | 47.15 | 45.38 | 46.37 | 46.71 | 45.88 | 46.98 | 45.84 |