CDM: A Reliable Metric for Fair and Accurate Formula Recognition Evaluation
Abstract
Formula recognition presents significant challenges due to the complicated structure and varied notation of mathematical expressions. Despite continuous advancements in formula recognition models, the evaluation metrics employed by these models, such as BLEU and Edit Distance, still exhibit notable limitations. They overlook the fact that the same formula has diverse representations and is highly sensitive to the distribution of training data, thereby causing the unfairness in formula recognition evaluation. To this end, we propose a Character Detection Matching (CDM) metric, ensuring the evaluation objectivity by designing a image-level rather than LaTex-level metric score. Specifically, CDM renders both the model-predicted LaTeX and the ground-truth LaTeX formulas into image-formatted formulas, then employs visual feature extraction and localization techniques for precise character-level matching, incorporating spatial position information. Such a spatially-aware and character-matching method offers a more accurate and equitable evaluation compared with previous BLEU and Edit Distance metrics that rely solely on text-based character matching. Experimentally, we evaluated various formula recognition models using CDM, BLEU, and ExpRate metrics. Their results demonstrate that the CDM aligns more closely with human evaluation standards and provides a fairer comparison across different models by eliminating discrepancies caused by diverse formula representations.
1 Introduction
Mathematical formula recognition is pivotal in document analysis as it directly influences the scientific rigor and accuracy of the content. Unlike standard optical character recognition (OCR), formula recognition presents unique challenges. Formulas often encompass multi-level symbols, subscripts, fractions, and other complex structures, requiring models to comprehend spatial and structural relationships rather than just linear, sequential text. Additionally, formulas exhibit representational diversity, meaning that the same formula can be expressed in multiple valid ways.
In recent years, significant advancements in formula recognition (Deng et al., 2017; Zhang et al., 2020; Yuan et al., 2022; Blecher, 2022; Paruchuri, 2023) have been primarily driven by deep learning. Deep learning models, especially those leveraging the Transformer architecture and large-scale pretraining strategies, have demonstrated superior performance in specific scenarios. Notably, commercial formula recognition software like Mathpix and the recently proposed UniMERNet Wang et al. (2024) model have achieved impressive results in diverse real-world settings. Despite these advancements, the existing evaluation metrics for formula recognition have notable shortcomings. Commonly-used metrics such as BLEU and Edit Distance primarily rely on text-based character matching, which introduces several limitations as follows:
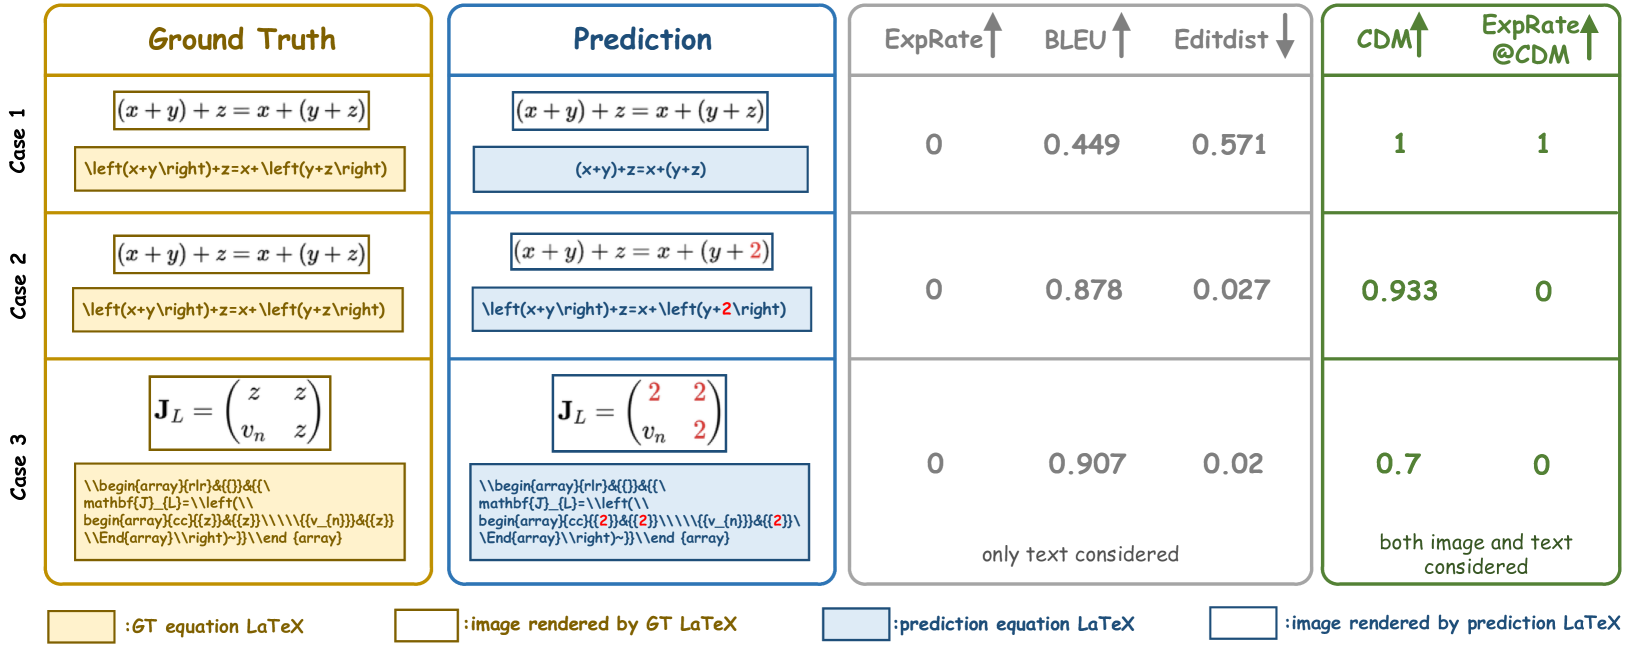
(1) Low Metric Reliability. BLEU and Edit Distance are reliable for evaluating the quality of text-level similarity. However, the diversity in formula representations makes these text-level evaluation metrics inadequate for precisely reflecting formula recognition quality. For example, as shown in Figure 1 (Case 1), a model’s prediction might render an image identical to the ground truth formula. However, due to the variations in formula expression styles, the evaluation results obtained using the ExpRate Deng et al. (2017), BLEU Papineni et al. (2002), and Edit Distance Levenshtein et al. (1966) may be somewhat misleading.
(2) Unfair Model Comparison. Current metrics can be biased by the distribution of training and testing data. If a model’s training data distribution differs significantly from the test data, it can adversely affect the evaluation metrics. As illustrated in Figure 1 (Case 1 and Case 2), a model may produce a correct prediction but score poorly due to representational differences from the ground truth, while an incorrect prediction might score higher if its representation aligns more closely with the test data distribution.
(3) Lack of Intuitive Scoring. There can be a significant discrepancy between BLEU scores and human perception. For instance, in Figure 1 (Case 3), a model’s prediction contains many errors, yet the BLEU score is as high as 0.907, which does not align with human judgment.
To address these issues, we propose a novel evaluation metric for formula recognition: Character Detection Matching (CDM). The proposed CDM regards the formula recognition evaluation as an image-based object detection task, by converting both the predicted LaTeX and the ground-truth LaTeX formulas into the image-formatted formulas and treating each character as an independent target. This approach overcomes the challenges posed by the diverse representations of formulas and aligns more closely with human subjective evaluation standards. CDM offers the advantages as follows: 1) Accuracy and Reliable. By calculating metrics in the image space, CDM eliminates issues caused by different valid representations of the same formula, directly reflecting recognition accuracy and aligning more closely with human intuitive perception. 2) Fairness. CDM removes the high dependency on consistent data distribution between training and evaluation task, allowing for a fair comparison of different models based on their true recognition capabilities. Our contributions can be summarized as follows:
-
•
We perform a detailed analysis of the existing formula recognition evaluation methods, highlighting the issues and unreliability of ExpRate and BLEU metrics.
-
•
We introduce a novel evaluation metric, CDM, which assesses formula recognition quality by performing visual character matching between rendered images of predicted and ground-truth formulas, providing an intuitive and fair evaluation standard.
-
•
We validate CDM’s effectiveness through extensive experiments on various mainstream models and datasets, demonstrating its superiority over traditional metrics like BLEU in assessing formula recognition performance.
2 Related Work
2.1 Formula Recognition Algorithms
Initially, researchers employ specific grammar rules to represent the spatial structure of formulas, including graph grammars Lavirotte and Pottier (1998), relational grammars MacLean and Labahn (2013), and probabilistic grammars Awal, Mouchere, and Viard-Gaudin (2014); Álvaro, Sánchez, and Benedí (2016). Besides, the CROHME competitions Mouchere et al. (2013, 2014); Mouchère et al. (2016); Mahdavi et al. (2019) have promoted the development of handwritten formula recognition by incorporating deep learning algorithms. Key contributions include a neural encoder-decoder model with coarse-to-fine attention Deng et al. (2017), a tree-structured decoder Zhang et al. (2020), and the Counting-Aware Network Li et al. (2022), which integrates a weakly-supervised counting module. The ABM network Bian et al. (2022) employs mutual distillation and an Attention Aggregation Module, while a transformer-based decoder Zhao et al. (2021) simplifies model architecture. The Syntax-Aware Network (SAN) Yuan et al. (2022) models recognition as a tree traversal process, significantly improving accuracy for complex expressions. Overall, these models employ ExpRate for formula evaluation.
In document information extraction Xia et al. (2024a, b), Donut Kim et al. (2022) directly converts input documents into structured outputs without using traditional OCR tools. Texify Paruchuri (2023) and UniMERNet Wang et al. (2024) are designed using Donut (Kim et al., 2022), utilizing more diverse datasets and data augmentation operations. Nougat (Blecher et al., 2023) is designed to convert PDF documents from screenshot to Markdown format, making the document content (e.g. table and formula) easier to edit. These methods use BLEU and Edit Distance metrics for formula evaluation.
2.2 Formula Recognition Evaluation Metrics
BLEU is initially proposed for machine translation tasks, matching standard and machine-translated texts using N-grams (sequences of N words) between the generated and the reference texts. It applies a brevity penalty factor to produce the final BLEU score Papineni et al. (2002):
| (1) |
where BP is the brevity penalty factor, and is the N-gram match result, with ranging from 1 to 4.
Edit Distance is also commonly-used metric to assess the similarity between the generated and the reference texts. It measures the number of insertions, deletions, or substitutions needed to transform one text into another, with a smaller Edit Distance indicating higher similarity Levenshtein et al. (1966).
ExpRate refers to the proportion of samples where the texts are exactly matched out of the total number of samples. Compared to BLEU and Edit Distance, ExpRate is coarser and more stringent in evaluation Li et al. (2022).
The above three metrics can effectively evaluate the textual differences between ground truth and reference, making them suitable for tasks requiring strict matches. BLEU and Edit Distance, in particular, provide a finer evaluation of text recognition capabilities compared to ExpRate, making them widely used in extensive text recognition tasks such as document recognition Blecher et al. (2023); Huang et al. (2024). These metrics are also applied to formula recognition, with most open-source models, such as Pix2Tex Blecher (2022) and Texify, adopting them for evaluation and comparison.
In addition to text-based metrics, image edit distance has been explored to measure the accuracy of predicted formulas Wang and Liu (2021). Image processing metrics like MSE (Mean Squared Error) and SSIM Wang et al. (2004) have also been considered. Structuring Chart-oriented Representation Metric (SCRM) Xia et al. (2023) is designed to comprehensively evaluate the information represented by structured triplet representations. However, these metrics are better suited for natural images. For document images such as formula images, even slight character misalignments can result in significant penalties, making these metrics less suitable for formula recognition.
3 Limitations of Current Metrics
Although ExpRate, BLEU, and Edit Distance are widely used in formula evaluation tasks, they exhibit significant limitations in accurately reflecting formula recognition performance, particularly in scenarios where there are domain gaps between training and testing data distributions. The main reason is that a single formula can have multiple valid LaTeX representations, making the Ground Truth (GT) LaTeX non-unique, which introduces inherent flaws for the formula evaluation.
As illustrated in Case 1 of Figure 1, the formula corresponds to the GT annotation "\left(x+y\right)+z=x+\left(y+z\right)". When the model’s prediction is "(x+y)+z=x+(y+z)", the prediction is correct because the rendered formula image matches the GT image, despite different LaTeX syntax. Theoretically, the ExpRate/BLEU/Edit Distance results should be 1/1/0, indicating a correct instance. However, in practice, ExpRate is 0, BLEU is 0.449, and Edit Distance is 0.571, failing to accurately assess the formula’s quality.
The aforementioned issues make it challenging to objectively evaluate the performance of different formula recognition models. For instance, as illustrated in Case 2 of Figure 1, one character "z" is misrecognized as "2". The prediction is incorrect, and the ExpRate, BLEU, and Edit Distance metrics reflect this error. However, when compared to Case 1 where the model prediction is correct, the BLEU and Edit Distance metrics for the incorrect prediction in Case 2 are better than those for the correct prediction in Case 1.
A LaTeX regularization method, which abstracts LaTeX code into a tree structure and standardizes elements, addresses LaTeX syntax diversity Deng et al. (2017). Pix2tex (Blecher, 2022), Texify (Paruchuri, 2023), and UniMERNet (Wang et al., 2024) use such regularization method as a preprocessing step before evaluation, which can solve part of the syntax inconsistency issue. For instance, "x^b_a", "x^{b}_{a}", and "x_{a}^{b}" all compile to . Directly calculating BLEU scores would not correctly assess the model’s prediction quality. Regularized code unifies these into a consistent format, such as always adding curly braces and arranging superscripts before subscripts, contributing to the fairness of subsequent metric calculations. However, regularization does not solve all LaTeX syntax diversity issues. Some symbols have multiple representations, such as "\leq" and "\le" both representing . Exhaustively listing these representations is challenging due to the huge LaTeX symbol library and many additional symbols provided by extension packages (e.g., amsmath, amssymb).
Overall, while regularization mitigates some issues, it does not fully address the inherent limitations of current metrics in evaluating formula recognition performance. This highlights the need for a more robust and comprehensive evaluation metric that can accurately reflect the quality of formula recognition across diverse representations.
4 Character Detection Matching
Due to the diversity of LaTeX expressions, text-based character-matching methods are unreliable for formula recognition evaluation. The basic idea of CDM is to compare the rendered images from LaTex text. If the image rendered from the predicted LaTeX source code matches the image rendered from the ground truth LaTeX source code, the formula is considered entirely correct. However, directly comparing the pixel values of the original and predicted formulas is not ideal. Any error or extra/missing character in the prediction can cause subsequent characters to be mismatched. Additionally, two similar formulas might have different layouts, with one being a single-line formula and the other a multi-line formula due to line breaks. Therefore, a more robust algorithm is needed to calculate the match between the predicted result and the ground truth image.
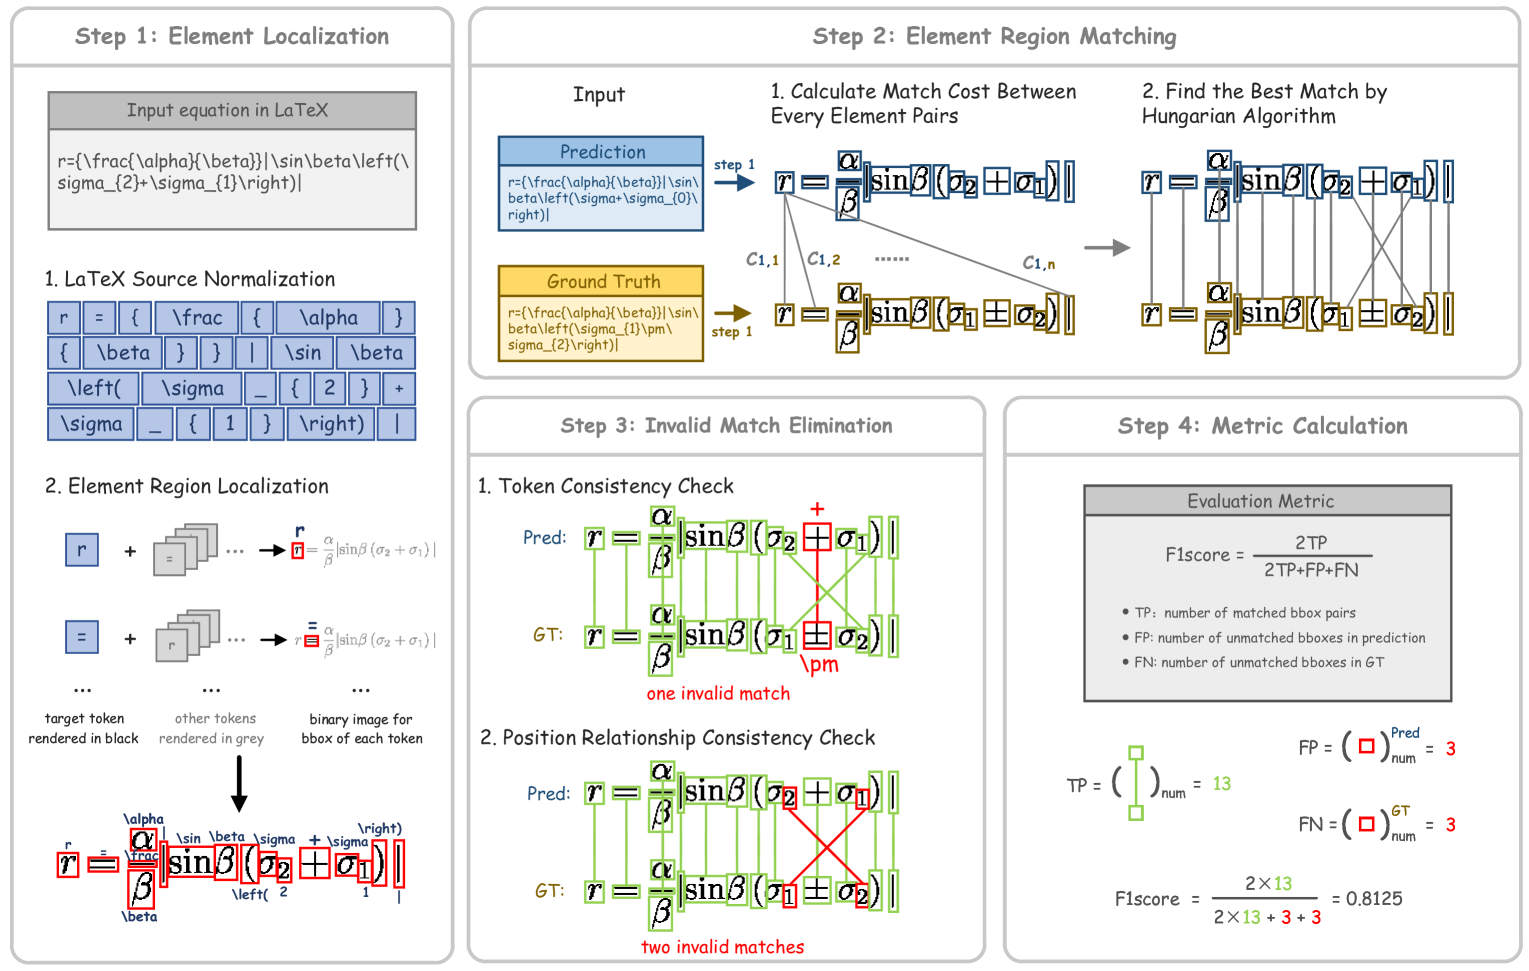
To this end, we propose a metric that incorporates a bipartite matching step for element-level matching in images, providing a more intuitive assessment. As shown in Figure 2, the algorithm consists of four stages as follows.
4.1 Element Localization
First, the bounding boxes (bboxes) of each individual element in the rendered image are extracted, followed by the subsequent steps.
LaTeX Source Normalization. LaTeX source codes of both the ground truth and predicted formulas are normalized, breaking them down into individual tokens such as "2", "a", "A", "\alpha", "\sin". Composite elements are decomposed into individual characters, e.g., "\frac ab" is decomposed into "\frac {a} {b}".
Element Region Localization. Each token in color based on the normalized LaTex source code is rendered. For the element to be localized, render it using "\black{e}" while rendering other elements using "\gray{}". By binarizing the fully rendered formula to extract the bounding box of each element, this process is repeated until all elements are accurately localized.
4.2 Element Region Matching
In this stage, a bipartite matching method pairs the predicted elements with the corresponding ground truth elements. Based on the element localization, two sets are obtained for each formula: one for the ground truth independent elements and one for the predicted independent elements . The number of independent elements in each set is and , respectively, with being the number of elements in the smaller set.
To measure the similarity between and , we match elements in the two sets by identifying the corresponding ground truth element for each predicted element. We use the bipartite matching Hungarian algorithm Kuhn (1955), as described in DETR Carion et al. (2020), to find a permutation that minimizes the total matching cost:
| (2) |
| (3) |
where the matching cost is defined as a weighted sum of three components as introduced as follows:
-
•
Token Matching Cost : This component measures whether the tokens corresponding to two bounding boxes are the same. If they are identical, the cost is 0; if they are different, the cost is 1. For tokens that render identically but are different, such as "(", "\left(", and "\big(", the cost is 0.05, which can be formulated as follows:
(4) where denotes tokens that differ but render identically.
-
•
Positional Proximity Cost : This component measures the proximity of the two bounding boxes’ positions using the L1 norm of their coordinates, which can be formulated as follows:
(5) where , and is the dimension of the bounding box coordinates.
-
•
Order Similarity Cost : This measures the similarity of the token order in the original LaTeX source (an approximation of reading order). The order is normalized to the range [0, 1], and the L1 norm can be calculated as follows:
(6) where this calculation is similar to , with .
Overall, the weights are used to balance the contributions of the three components. By employing this comprehensive matching strategy, we ensure a more accurate and robust evaluation of the correspondence between the predicted and ground truth elements, thereby improving the overall assessment of formula recognition quality.
4.3 Invalid Match Elimination
After pairing the individual elements of the predicted result with the ground truth using the Hungarian matching algorithm, we need to verify these pairs and eliminate invalid matches. This process involves two steps:
Token Consistency Check. Check whether the elements in each matched pair are consistent in terms of characters. If they are inconsistent, discard the match.
Position Relationship Consistency Check. The relative positions of elements in mathematical formulas are crucial. For instance, in the expressions and , bipartite matching might pair 2 with 2 and 3 with 3, but their meanings and visual representations are entirely different. Thus, we need to check the consistency of the positional relationships within the matched pairs. We treat each element in the matched pair as a bounding box and analyze their relative positions. Specifically, we assume an affine transformation between the ground truth and predicted elements:
| (7) |
where is the affine transformation matrix. To identify inconsistent match pairs, we detect pairs that do not conform to this transformation relationship. We employ the RANSAC algorithm Fischler and Bolles (1981) for this purpose. RANSAC can determine the optimal transformation matrix in the presence of noise. Given that formulas are usually horizontally arranged during rendering, we fix the rotation angle in the transformation matrix to 0, considering only translation and scaling. This approach not only improves the convergence speed of the RANSAC algorithm but also enhances the final matching accuracy.
To account for line-breaking effects in formulas, we perform multiple rounds of RANSAC iterations to ensure that as many matched pairs as possible conform to the transformation relationship. After several iterations, matched pairs that still do not conform to the transformation relationship are considered incorrect and are eliminated.
The above two steps effectively eliminate invalid match pairs, ensuring more accurate final matching results.
4.4 Metric Calculation
We use the F1-Score as the default metric for evaluating CDM (Character Detection Metric), defined as:
| (8) |
where denotes true positives, denotes false positives, and denotes false negatives.
To further evaluate the accuracy of formula recognition, we introduce the metric , defined as:
| (9) |
where is the indicator function that equals 1 if and 0 otherwise, and is the total number of formulas. This metric represents the proportion of formulas for which the model’s prediction results are perfectly matched. Essentially, serves as a precise version of the ExpRate metric specifically for formula recognition.
5 Experiments
5.1 Models and Data
We validate the CDM metric by evaluating several mainstream formula recognition models using both subjective impressions and objective metrics. The models include open-source UniMERNet Wang et al. (2024), Texify (Paruchuri, 2023), Pix2tex (Blecher, 2022), and the commercial Mathpix API, all tested on the UniMER-Test dataset. Besides, we evaluate document-level models, such as the open-source Nougat Blecher et al. (2023) and the commercial GPT-4o GPT-4o (2024). Vary Wei et al. (2023) and StrucTexTv3 Lyu et al. (2024) are excluded as they are currently unavailable.
UniMER-Test Dataset. The dataset includes 23,757 formula samples, categorized into Simple Printed Expressions (SPE), Complex Printed Expressions (CPE), Screenshot Expressions (SCE), and Handwritten Expressions (HWE). We use these categories to conduct the model evaluation.
Tiny-Doc-Math Dataset. To evaluate document-level recognition, we construct the Tiny-Doc-Math dataset, consisting of arXiv papers in mathematics and computer science, published after June 2024, to ensure that they are not in the training data of the compared models. We obtain LaTeX code and corresponding PDFs, match displayed equations using regular expressions, and manually verify them. Overall, the dataset includes 12 PDFs, totaling 196 pages and 437 formulas.
This validation set includes both formula-level and document-level evaluations:
-
•
Formula-level: Using single rendered formula images as input, we evaluate Mathpix, Pix2Tex, and UniMERNet. These models accept cropped formula images as input, and we compare the model outputs with the ground truth to compute relevant metrics.
-
•
Document-level: Using PDFs or images as input, we evaluate Nougat, GPT-4o, and Mathpix, which can convert entire PDF pages into Markdown format. We match the displayed equations in the model outputs using regular expressions and compare them with the ground truth LaTeX formulas to compute relevant metrics.
5.2 Credibility Assessment of CDM
Rendering Success Rate
The CDM metric relies on the successful rendering of formula images. For models that fail to render images, we assign a CDM score of 0, as rendering failures indicate that the predicted LaTeX code lacks critical elements. The rendering success rates on the UniMER-Test dataset for Pix2tex, Texify, UniMERNet, and Mathpix are 86.17%, 94.97%, 97.62%, and 98.95%, respectively, ensuring the applicability and reliability of the CDM metric.
| Model | ExpRate | ExpRate@CDM | BLEU | CDM |
|---|---|---|---|---|
| Pix2tex | 0.1237 | 0.2413 | 0.4080 | 0.570 |
| Texify | 0.2288 | 0.5005 | 0.5890 | 0.759 |
| Mathpix | 0.2610 | 0.4860 | 0.8067 | 0.896 |
| UniMERNet | 0.4799 | 0.8099 | 0.8425 | 0.959 |
| Method | SPE | CPE | HWE | SCE | ||||
|---|---|---|---|---|---|---|---|---|
| BLEU | CDM | BLEU | CDM | BLEU | CDM | BLEU | CDM | |
| Pix2tex Blecher (2022) | 0.8730 | 0.9392 | 0.6550 | 0.4614 | 0.0120 | 0.2131 | 0.0920 | 0.6531 |
| Texify Paruchuri (2023) | 0.9060 | 0.9856 | 0.6900 | 0.7065 | 0.3410 | 0.5341 | 0.4200 | 0.7991 |
| Mathpix | 0.7920 | 0.9664 | 0.8061 | 0.8421 | 0.8060 | 0.9305 | 0.8182 | 0.8156 |
| UniMERNet Wang et al. (2024) | 0.9170 | 0.9955 | 0.9160 | 0.9300 | 0.9210 | 0.9526 | 0.6160 | 0.9513 |
| Image Type | Model | BLEU | CDM | ExpRate@CDM |
|---|---|---|---|---|
| Formula | Pix2tex | 0.4648 | 0.7563 | 0.3592 |
| GPT-4o | 0.6431 | 0.7120 | 0.4210 | |
| UniMERNet | 0.6056 | 0.9422 | 0.6681 | |
| Mathpix | 0.6112 | 0.9480 | 0.1853 | |
| Document | GPT-4o | 0.3148 | 0.6317 | 0.1510 |
| Nougat | 0.5713 | 0.7838 | 0.5171 | |
| Mathpix | 0.5997 | 0.9413 | 0.5789 |
User Preference Evaluation
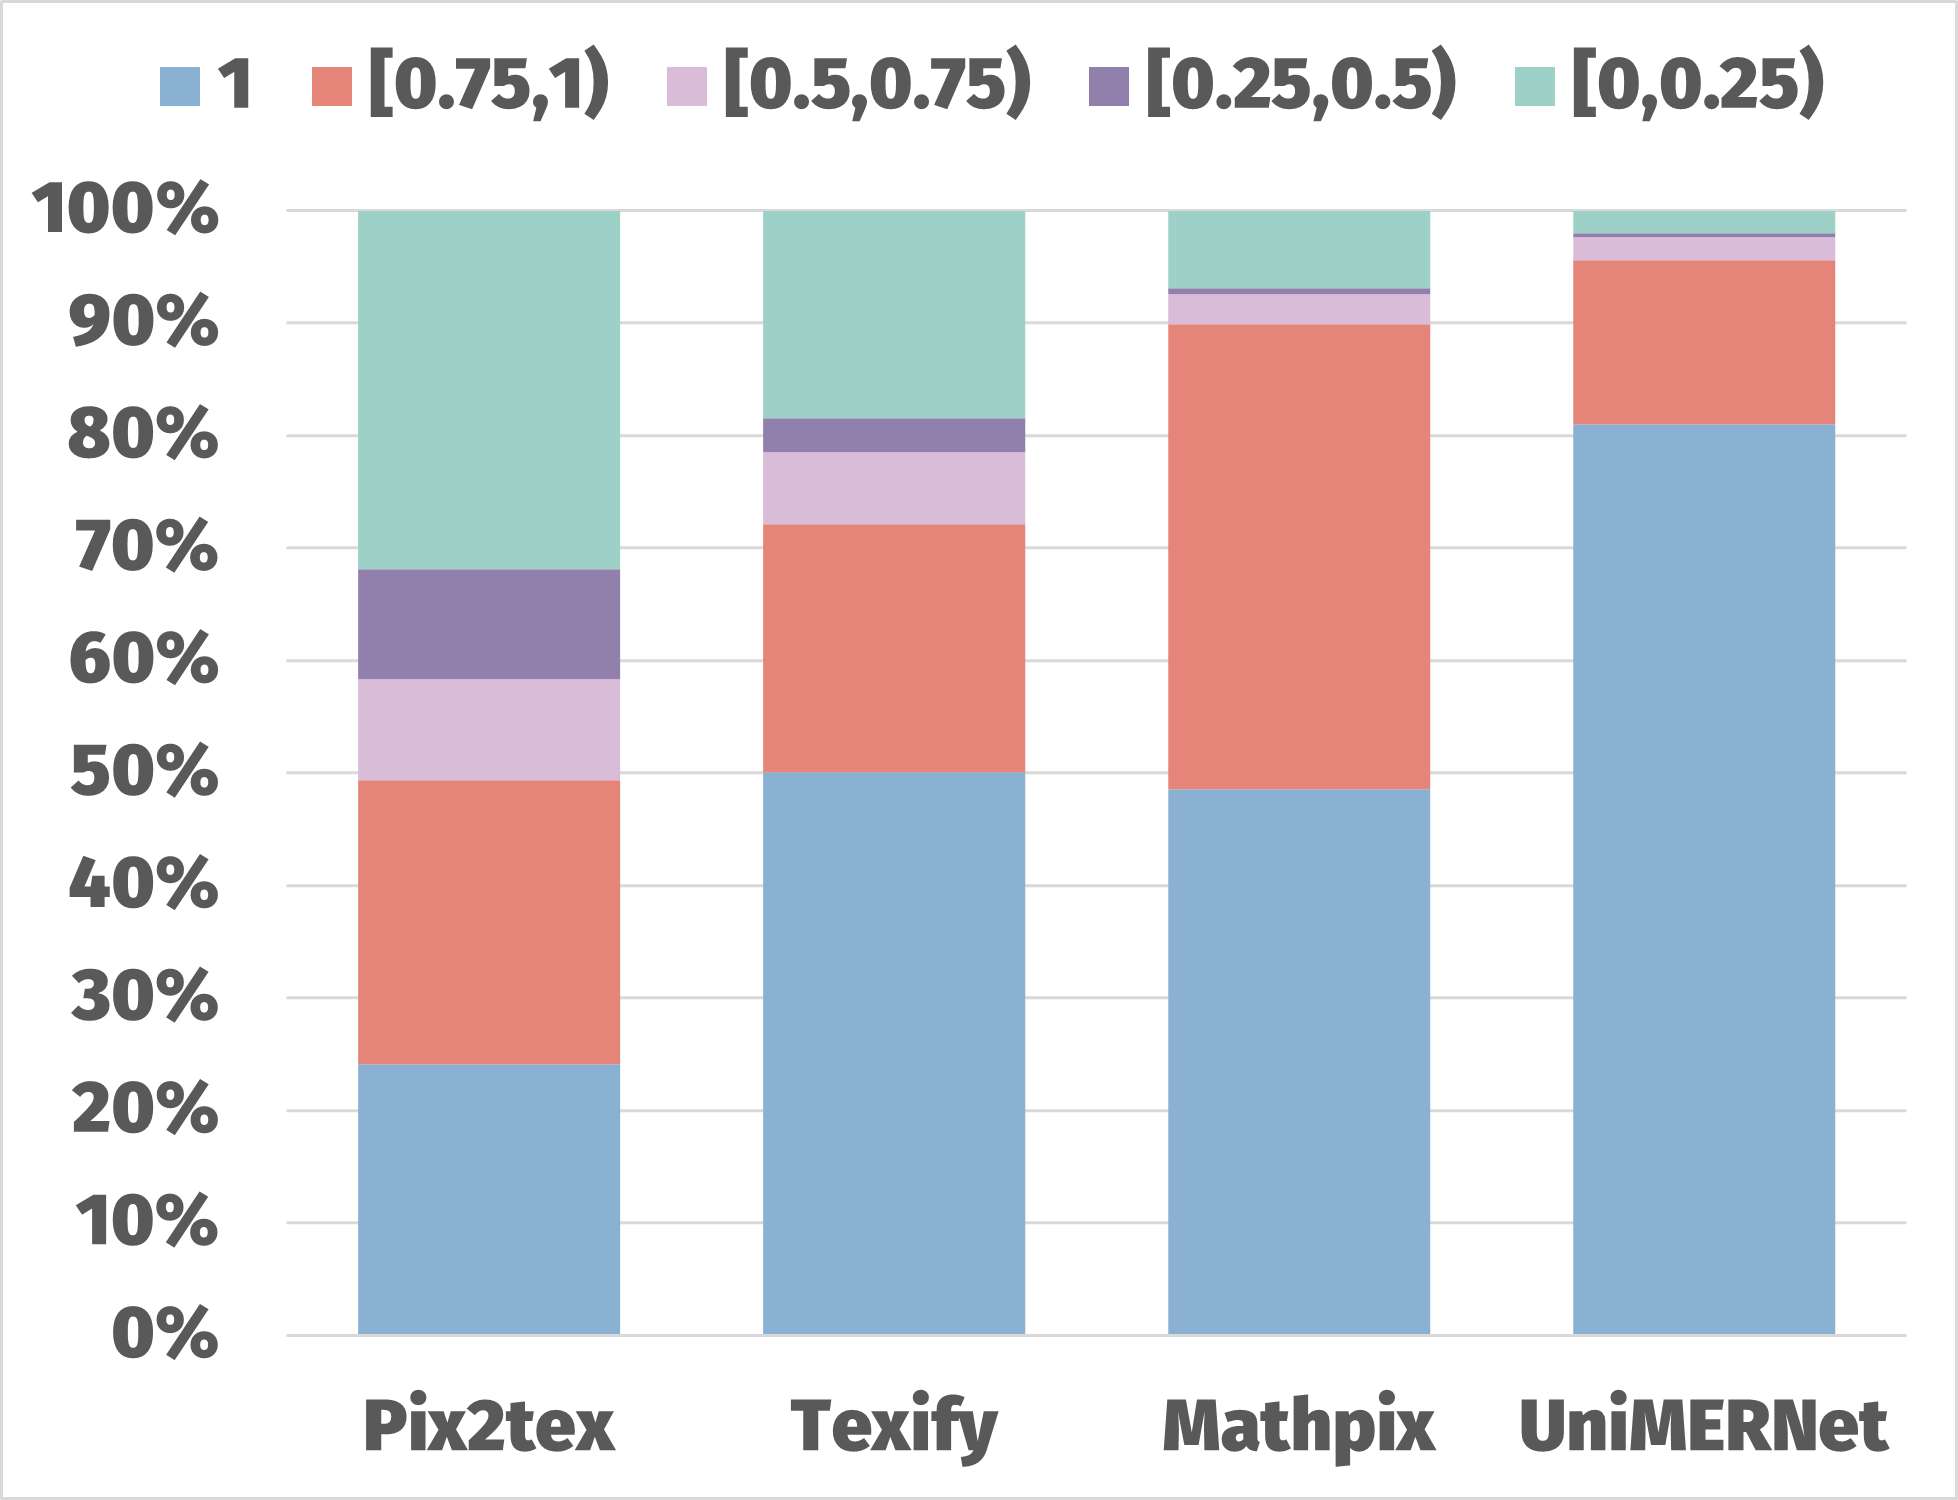
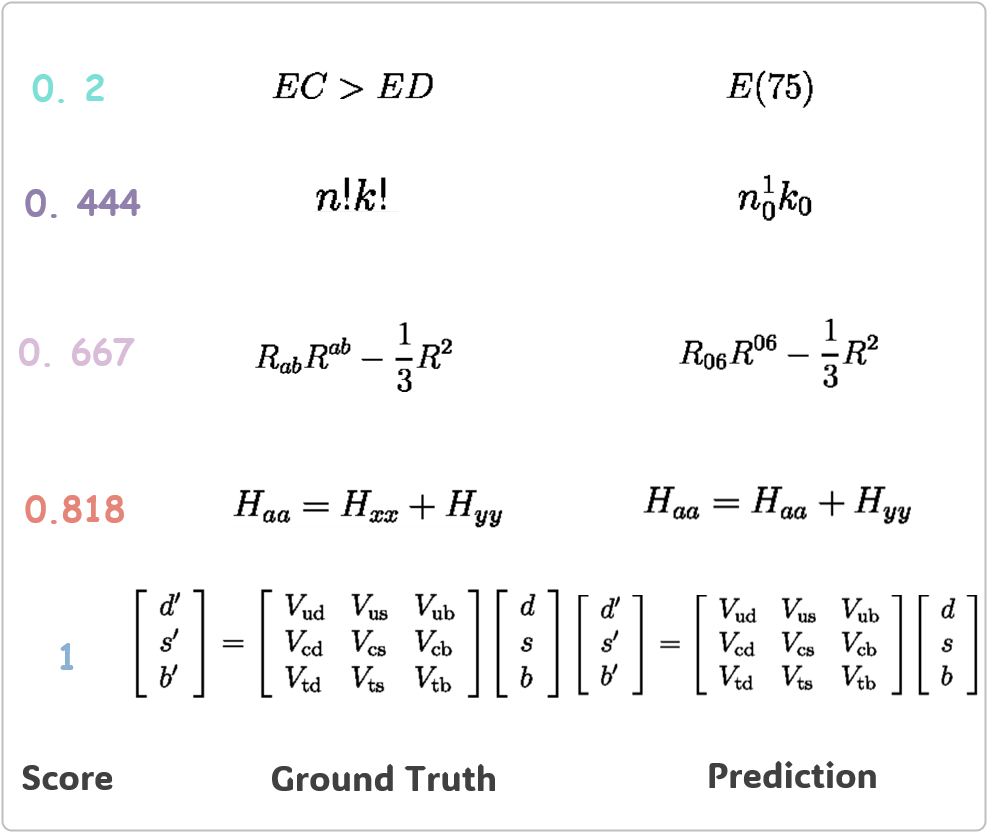
We analyze the distribution of CDM scores for four models on the UniMER-Test dataset. As shown in Figure 3(a), Mathpix and UniMERNet perform well in terms of CDM scores. We conduct a detailed analysis of the Pix2Tex model by randomly selecting samples from different score ranges to evaluate if the prediction quality corresponds to the CDM scores. The analysis in Figure 3(b) shows that the CDM scores effectively reflect formula quality, with higher scores indicating fewer errors.
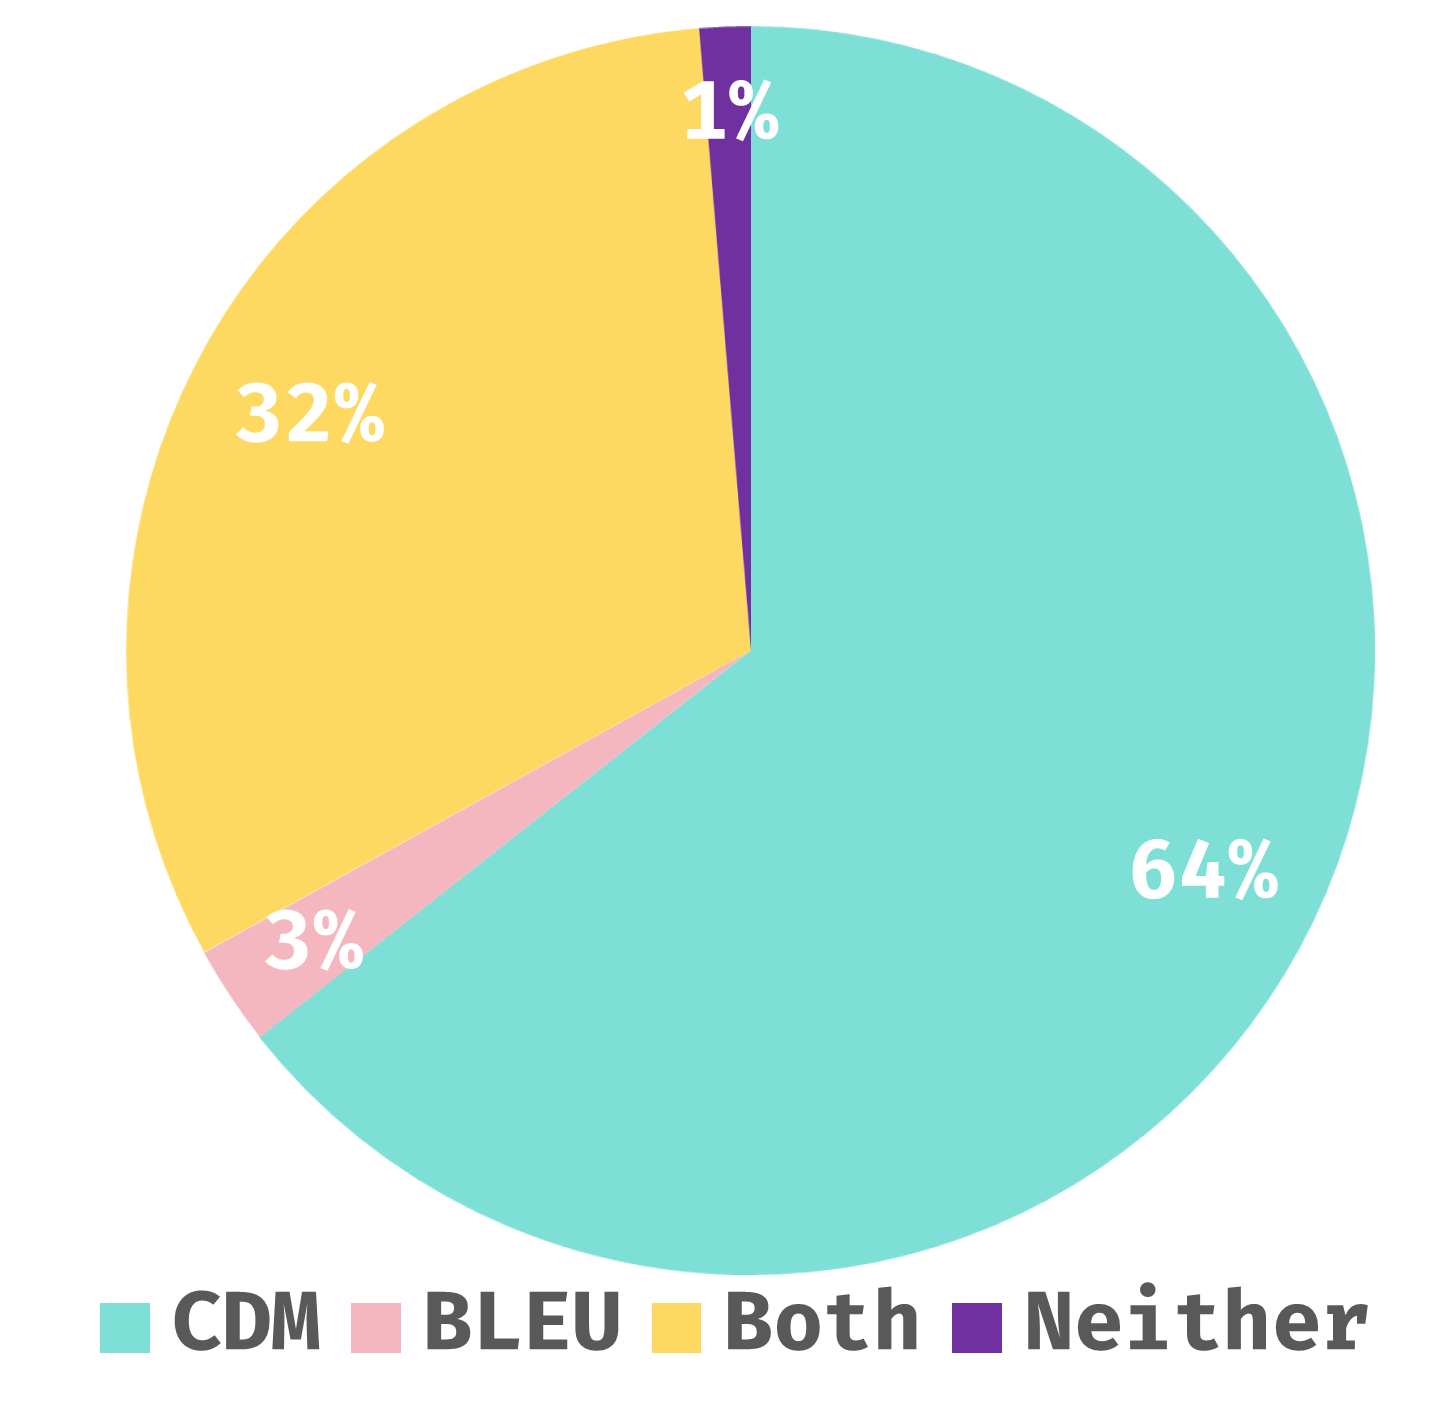
To verify the consistency between the CDM metric and human evaluation, we conduct a large-scale experiment. We select 1,008 CDM scores from Pix2Tex predictions, ensuring a balanced score distribution. We design an annotation interface displaying a ground truth label and the corresponding predicted LaTeX rendered image. Annotators choose between ScoreA, ScoreB, Both (credible), and Neither (credible). ScoreA and ScoreB correspond to the BLEU and CDM scores, respectively, but their order is randomized.
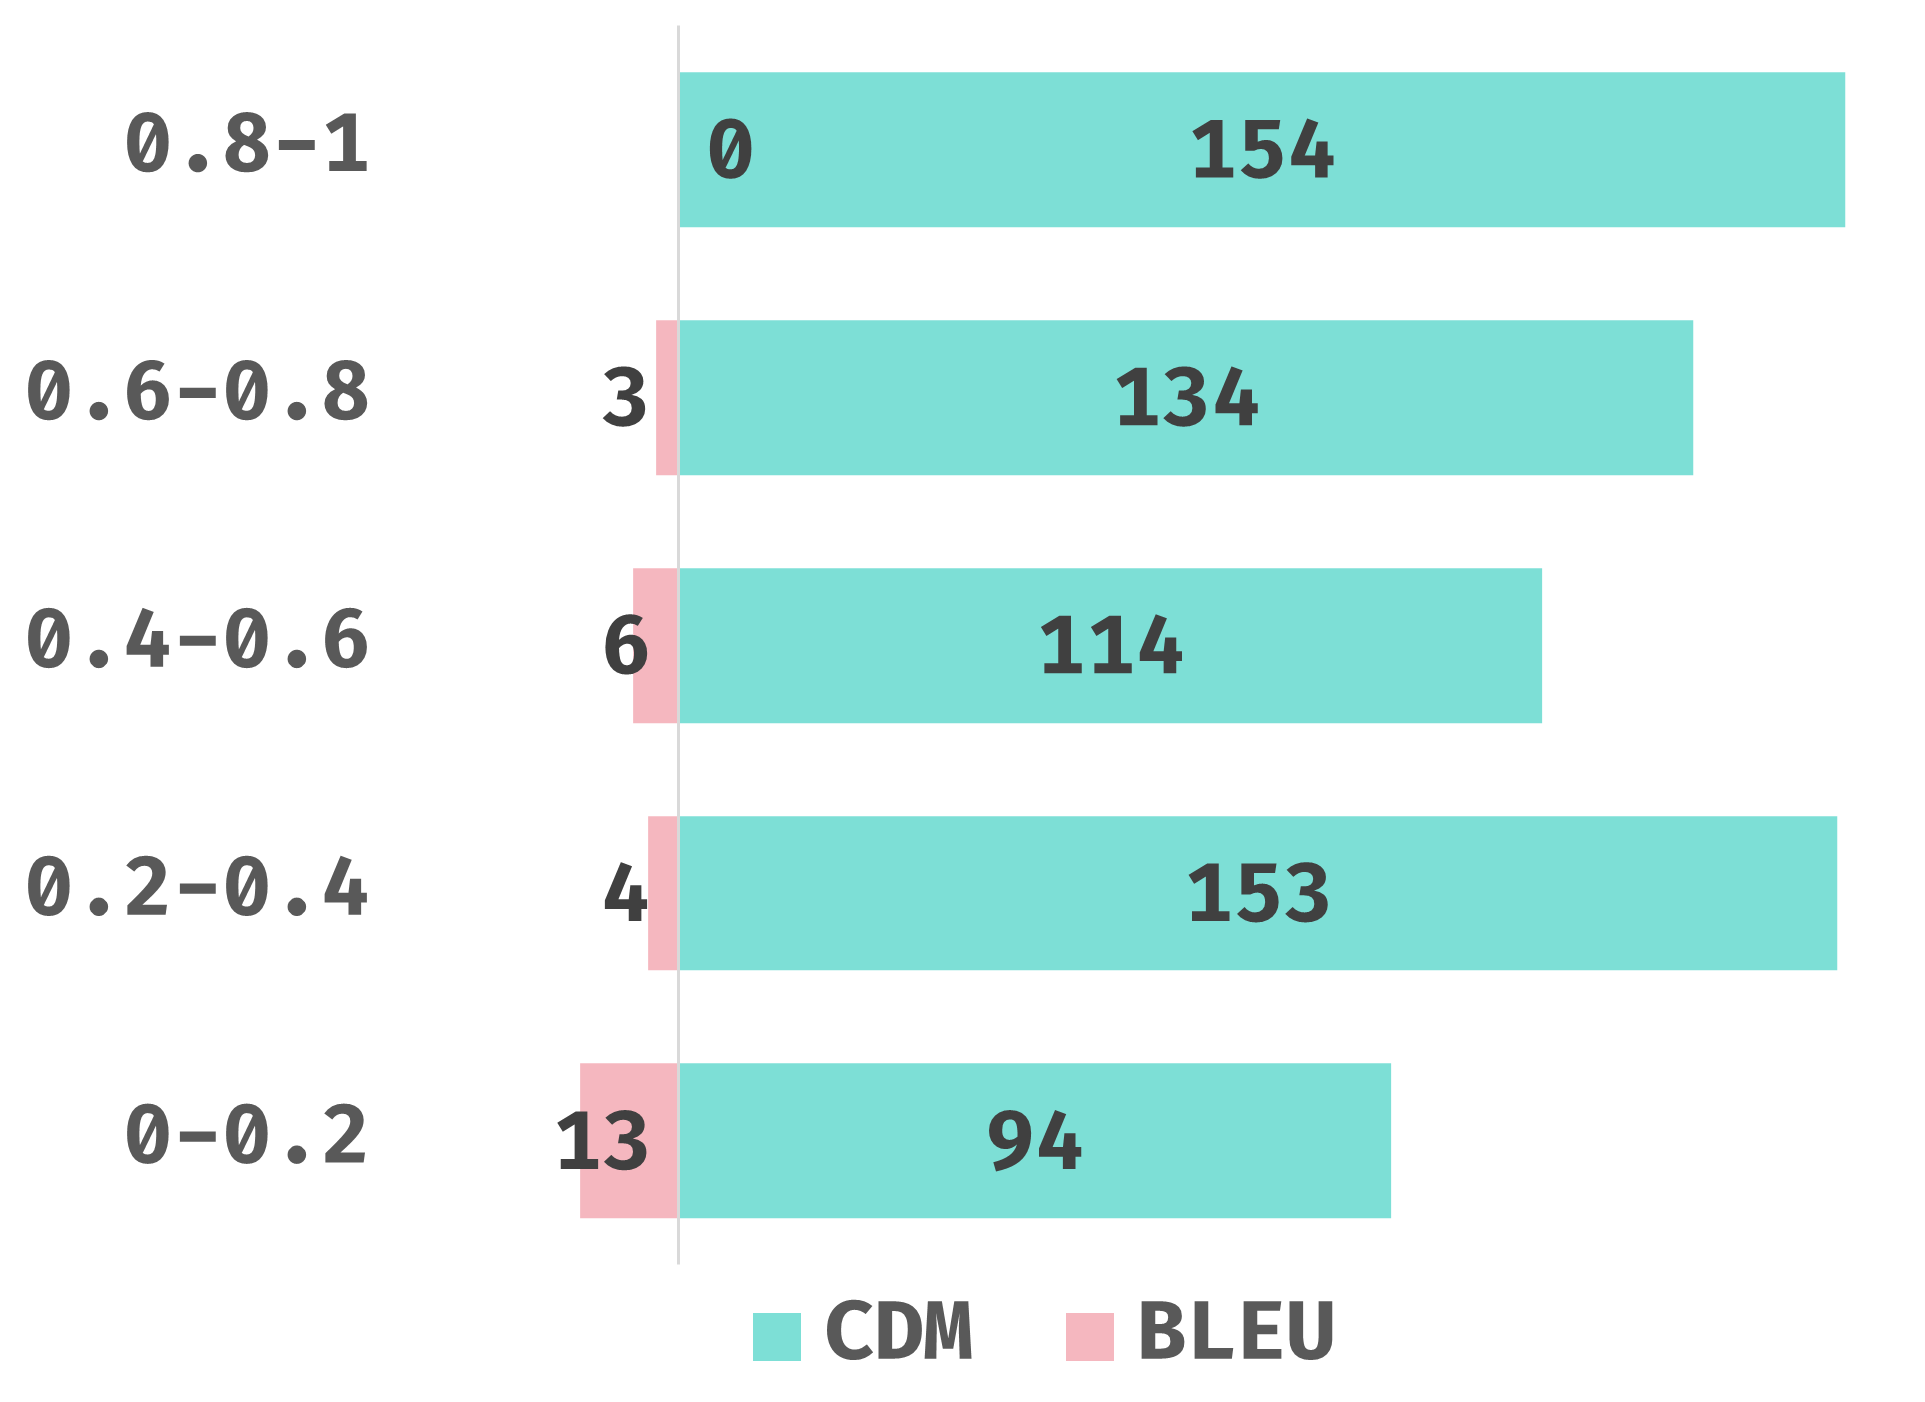
The results in Figure 4(a) show that 64% of participants prefer the CDM metric, and 32% consider both metrics good. This indicates a 96% consistency between the CDM metric and human evaluation, demonstrating its reliability. Figure 4(b) compares the number of cases where BLEU or CDM is preferred across different score ranges, showing that CDM consistently outperforms BLEU.
Objective Stability Assessment
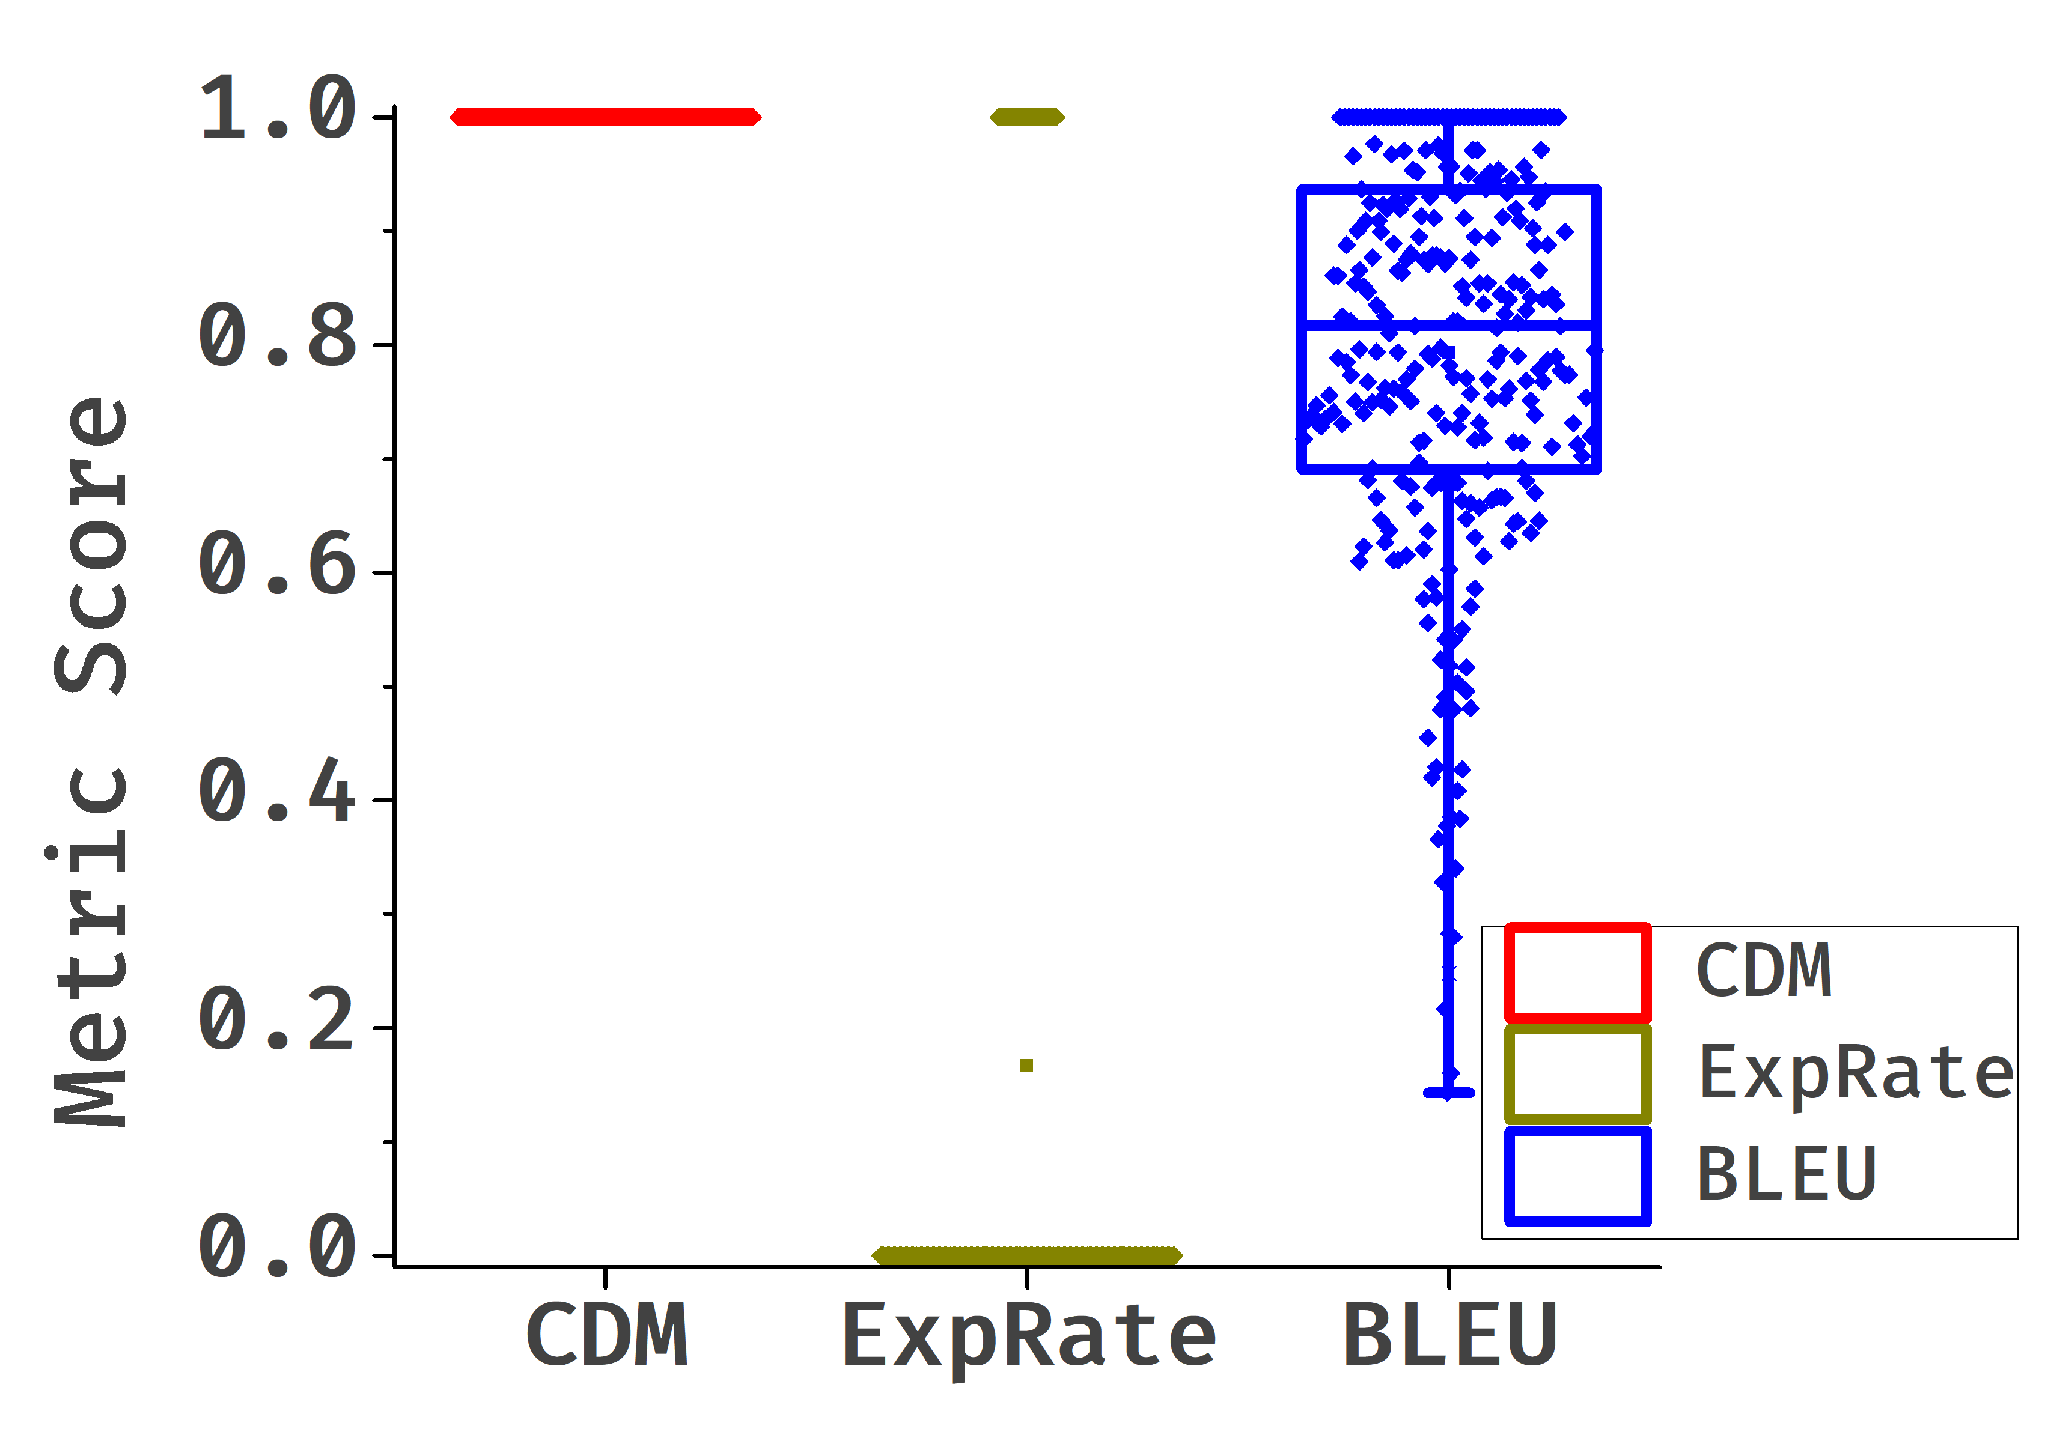
To evaluate the impact of formula writing styles on the CDM and BLEU metrics, we randomly select 50 formulas with LaTeX source code and rewrite each formula five times using GPT-4, generating 250 additional formulas. We manually verify these formulas to ensure their rendered results are identical to the original 50 formulas. Using the initial LaTeX source code as the ground truth, we analyze the score distribution of the BLEU and CDM metrics. As shown in Figure 4(c), the CDM metric is unaffected by style changes, with all samples scoring 1. In contrast, the BLEU metric’s scores are dispersed, making it unsuitable for formula evaluation. The CDM metric remains robust and reliable despite formatting changes.
5.3 Evaluation of Mainstream Models
We conduct a detailed evaluation of mainstream models using both the CDM and BLEU metric. Note that all BLEU metric in this paper have been normalized Deng et al. (2017); Blecher (2022). However, as discussed in the limitation section, normalization operations cannot address all issues, which will be evident in the following experiments.
UniMER-Test Evaluation
As shown in Table 1, the evaluation results of the four models on the UniMER-Test dataset indicate that the quality ranges from low to high as follows: Pix2Tex, Texify, Mathpix, and UniMERNet, based on both BLEU and CDM metrics. ExpRate@CDM clearly shows the proportion of completely correct predictions for each model, indicating that the text character-based ExpRate is unreliable.
From the results in Table 1, it appears that the trends of the BLEU and CDM metrics are consistent. To verify the reliability of using the BLEU metric for model comparison, we further present evaluation results on the UniMER-Test subsets. As shown in Table 2, we observe two notable anomalies: Firstly, in the SCE subset, when comparing the quality of the Mathpix and UniMERNet models, the BLEU and CDM metrics provide opposite conclusions. A detailed review of the UniMERNet paper reveals that the SCE subset was annotated based on Mathpix and then manually corrected. This means that the expression style of the SCE formulas is more consistent with Mathpix. Consequently, even though the CDM metric indicates that UniMERNet has better actual model quality, the BLEU metric, influenced by the expression style, suggests that Mathpix is superior. Secondly, for the Pix2Tex model, the BLEU metric is very low on the HWE and SCE subsets but performs well on the SPE and CPE subsets. This discrepancy arises because the Pix2Tex training set includes a large number of printed formulas from arXiv and lacks data in the HWE and SCE styles.
These anomalies clearly illustrate the limitations of the BLEU metric in evaluating the quality of formula recognition models. In contrast, the CDM metric proposed in this paper is fair and intuitive.
Tiny-Doc-Math Evaluation
The evaluation results of Tiny-Doc-Math are shown in Table 3. For cropped formula inputs (formula-level), all four models perform reasonably well, with CDM scores above 0.7. Notably, the current leading multimodal large model GPT-4o has the highest BLEU score among the four models but the lowest CDM score. This discrepancy indicates that the BLEU metric may not be reliable, suggesting that the formula recognition accuracy of GPT-4o still has room for improvement, lagging behind traditional SOTA models. Additionally, although Mathpix has the highest CDM score, only 18.53% of the formulas are completely accurate. Manual verification revealed that many formulas are missing commas or periods at the end.
When the input is document-level screenshots, the models output the recognition results for the entire document (not just the formulas). Evaluation is conducted by matching the recognized block formulas. In this scenario, it can be observed that the accuracy of GPT-4o further decreases. In contrast, Mathpix and Nougat perform better, but even the document multimodal large model Nougat only achieves a CDM score of 0.7852. This indicates that there is still significant room for improvement in document-level recognition models. Mathpix remains the best performer, with a fully correct formula rate of 57.89%. The accuracy of document-level recognition is crucial for advanced document understanding tasks like scientific knowledge Q&A, and CDM provides an excellent standard for selecting formula models and offers direction for improving formula recognition.
6 Conclusion
In this paper, we introduced Character Detection Matching (CDM), a novel evaluation metric for formula recognition. CDM addresses the shortcomings of the existing metrics by utilizing spatial character matching, overcoming issues with diverse formula representations. Comprehensive evaluations on different models and datasets demonstrate CDM’s superiority in precisely reflecting recognition quality. CDM provides a fairer and more intuitive assessment, highlighting current evaluation metric issues and paving the way for future research and improvements in the field.
References
- Álvaro, Sánchez, and Benedí (2016) Álvaro, F.; Sánchez, J.-A.; and Benedí, J.-M. 2016. An integrated grammar-based approach for mathematical expression recognition. Pattern Recognition, 51: 135–147.
- Awal, Mouchere, and Viard-Gaudin (2014) Awal, A.-M.; Mouchere, H.; and Viard-Gaudin, C. 2014. A global learning approach for an online handwritten mathematical expression recognition system. Pattern Recognition Letters, 35: 68–77.
- Bian et al. (2022) Bian, X.; Qin, B.; Xin, X.; Li, J.; Su, X.; and Wang, Y. 2022. Handwritten mathematical expression recognition via attention aggregation based bi-directional mutual learning. In Proceedings of the AAAI Conference on Artificial Intelligence (AAAI), volume 36, 113–121.
- Blecher (2022) Blecher, L. 2022. pix2tex - LaTeX OCR. https://github.com/lukas-blecher/LaTeX-OCR. Accessed: 2024-2-29.
- Blecher et al. (2023) Blecher, L.; Cucurull, G.; Scialom, T.; and Stojnic, R. 2023. Nougat: Neural optical understanding for academic documents. arXiv.org, 2308.13418.
- Carion et al. (2020) Carion, N.; Massa, F.; Synnaeve, G.; Usunier, N.; Kirillov, A.; and Zagoruyko, S. 2020. End-to-end object detection with transformers. In European Conference on Computer Vision (ECCV), 213–229. Springer.
- Deng et al. (2017) Deng, Y.; Kanervisto, A.; Ling, J.; and Rush, A. M. 2017. Image-to-markup generation with coarse-to-fine attention. In International Conference on Machine Learning (ICML), 980–989. PMLR.
- Fischler and Bolles (1981) Fischler, M. A.; and Bolles, R. C. 1981. Random sample consensus: a paradigm for model fitting with applications to image analysis and automated cartography. Communications of the ACM, 24(6): 381–395.
- GPT-4o (2024) GPT-4o. 2024. GPT-4o. https://openai.com/index/hello-gpt-4o/. Accessed: 2024-08-15.
- Huang et al. (2024) Huang, M.; Liu, Y.; Liang, D.; Jin, L.; and Bai, X. 2024. Mini-Monkey: Alleviate the Sawtooth Effect by Multi-Scale Adaptive Cropping. arXiv.org.
- Kim et al. (2022) Kim, G.; Hong, T.; Yim, M.; Nam, J.; Park, J.; Yim, J.; Hwang, W.; Yun, S.; Han, D.; and Park, S. 2022. Ocr-free document understanding transformer. In European Conference on Computer Vision (ECCV), 498–517. Springer.
- Kuhn (1955) Kuhn, H. W. 1955. The Hungarian method for the assignment problem. Naval research logistics quarterly, 2(1-2): 83–97.
- Lavirotte and Pottier (1998) Lavirotte, S.; and Pottier, L. 1998. Mathematical formula recognition using graph grammar. In Lopresti, D. P.; and Zhou, J., eds., Document Recognition V, San Jose, CA, USA, January 24, 1998.
- Levenshtein et al. (1966) Levenshtein, V. I.; et al. 1966. Binary codes capable of correcting deletions, insertions, and reversals. In Soviet physics doklady, volume 10, 707–710. Soviet Union.
- Li et al. (2022) Li, B.; Yuan, Y.; Liang, D.; Liu, X.; Ji, Z.; Bai, J.; Liu, W.; and Bai, X. 2022. When counting meets HMER: counting-aware network for handwritten mathematical expression recognition. In European Conference on Computer Vision (ECCV), 197–214. Springer.
- Lyu et al. (2024) Lyu, P.; Li, Y.; Zhou, H.; Ma, W.; Wan, X.; Xie, Q.; Wu, L.; Zhang, C.; Yao, K.; Ding, E.; et al. 2024. StrucTexTv3: An Efficient Vision-Language Model for Text-rich Image Perception, Comprehension, and Beyond. arXiv.org.
- MacLean and Labahn (2013) MacLean, S.; and Labahn, G. 2013. A new approach for recognizing handwritten mathematics using relational grammars and fuzzy sets. International Journal on Document Analysis and Recognition (IJDAR), 16: 139–163.
- Mahdavi et al. (2019) Mahdavi, M.; Zanibbi, R.; Mouchere, H.; Viard-Gaudin, C.; and Garain, U. 2019. ICDAR 2019 CROHME+ TFD: Competition on recognition of handwritten mathematical expressions and typeset formula detection. In International Conference on Document Analysis and Recognition (ICDAR), 1533–1538. IEEE.
- Mouchere et al. (2014) Mouchere, H.; Viard-Gaudin, C.; Zanibbi, R.; and Garain, U. 2014. ICFHR 2014 competition on recognition of on-line handwritten mathematical expressions (CROHME 2014). In International Conference on Frontiers in Handwriting Recognition (ICFHR), 791–796. IEEE.
- Mouchère et al. (2016) Mouchère, H.; Viard-Gaudin, C.; Zanibbi, R.; and Garain, U. 2016. ICFHR2016 CROHME: Competition on recognition of online handwritten mathematical expressions. In International Conference on Frontiers in Handwriting Recognition (ICFHR), 607–612. IEEE.
- Mouchere et al. (2013) Mouchere, H.; Viard-Gaudin, C.; Zanibbi, R.; Garain, U.; Kim, D. H.; and Kim, J. H. 2013. Icdar 2013 crohme: Third international competition on recognition of online handwritten mathematical expressions. In International Conference on Document Analysis and Recognition (ICDAR), 1428–1432. IEEE.
- Papineni et al. (2002) Papineni, K.; Roukos, S.; Ward, T.; and Zhu, W.-J. 2002. Bleu: a method for automatic evaluation of machine translation. In Proceedings of the 40th annual meeting of the Association for Computational Linguistics, 311–318.
- Paruchuri (2023) Paruchuri, V. 2023. Texify. https://github.com/VikParuchuri/texify. Accessed: 2024-2-29.
- Wang et al. (2024) Wang, B.; Gu, Z.; Xu, C.; Zhang, B.; Shi, B.; and He, C. 2024. UniMERNet: A Universal Network for Real-World Mathematical Expression Recognition. arXiv.org.
- Wang et al. (2004) Wang, Z.; Bovik, A. C.; Sheikh, H. R.; and Simoncelli, E. P. 2004. Image quality assessment: from error visibility to structural similarity. IEEE TIP, 13(4): 600–612.
- Wang and Liu (2021) Wang, Z.; and Liu, J.-C. 2021. Translating math formula images to LaTeX sequences using deep neural networks with sequence-level training. International Journal on Document Analysis and Recognition (IJDAR), 24(1): 63–75.
- Wei et al. (2023) Wei, H.; Kong, L.; Chen, J.; Zhao, L.; Ge, Z.; Yang, J.; Sun, J.; Han, C.; and Zhang, X. 2023. Vary: Scaling up the vision vocabulary for large vision-language models. arXiv.org, 2312.06109.
- Xia et al. (2024a) Xia, R.; Mao, S.; Yan, X.; Zhou, H.; Zhang, B.; Peng, H.; Pi, J.; Fu, D.; Wu, W.; Ye, H.; et al. 2024a. DocGenome: An Open Large-scale Scientific Document Benchmark for Training and Testing Multi-modal Large Language Models. arXiv preprint arXiv:2406.11633.
- Xia et al. (2023) Xia, R.; Zhang, B.; Peng, H.; Liao, N.; Ye, P.; Shi, B.; Yan, J.; and Qiao, Y. 2023. Structchart: Perception, structuring, reasoning for visual chart understanding. arXiv preprint arXiv:2309.11268.
- Xia et al. (2024b) Xia, R.; Zhang, B.; Ye, H.; Yan, X.; Liu, Q.; Zhou, H.; Chen, Z.; Dou, M.; Shi, B.; Yan, J.; et al. 2024b. Chartx & chartvlm: A versatile benchmark and foundation model for complicated chart reasoning. arXiv preprint arXiv:2402.12185.
- Yuan et al. (2022) Yuan, Y.; Liu, X.; Dikubab, W.; Liu, H.; Ji, Z.; Wu, Z.; and Bai, X. 2022. Syntax-aware network for handwritten mathematical expression recognition. In Proceedings of the IEEE/CVF Conference on Computer Vision and Pattern Recognition (CVPR), 4553–4562.
- Zhang et al. (2020) Zhang, J.; Du, J.; Yang, Y.; Song, Y.-Z.; Wei, S.; and Dai, L. 2020. A tree-structured decoder for image-to-markup generation. In International Conference on Machine Learning (ICML), 11076–11085. PMLR.
- Zhao et al. (2021) Zhao, W.; Gao, L.; Yan, Z.; Peng, S.; Du, L.; and Zhang, Z. 2021. Handwritten mathematical expression recognition with bidirectionally trained transformer. In International Conference on Document Analysis and Recognition (ICDAR), 570–584. Springer.
Appendix
Appendix A User Preference Evaluation Analysis
To provide a more intuitive and clear analysis of the credibility of CDM, we supplement the content in Section 5.2 with a detailed examination of user preferences for CDM and BLEU metrics under different conditions.
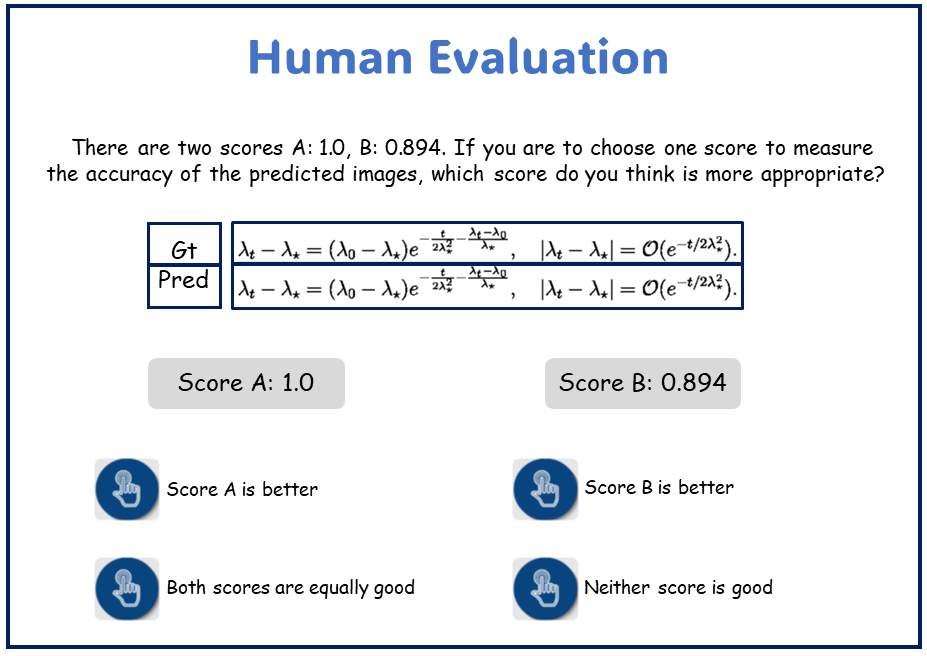
To assess the reliability of CDM, we design an annotation interface as shown in Figure 5. Given the ground truth rendered image and the model’s predicted rendered image for various samples, annotators are asked to assign an appropriate score. Score A and Score B correspond to the BLEU and CDM scores of the prediction results, but the order is randomized so that users do not know which score corresponds to which metric. Users make their choice based on their intuitive judgment from four options.
A total of 1008 samples are scored, and the results are categorized into four scenarios. We provide a detailed and clear analysis of user preferences for CDM and BLEU metrics in each scenario, as illustrated in Figure 6:
CDM is better (64%): In this scenario, examples include Case 1 and Case 2. In Case 1, the prediction result is 100% correct, with a CDM score of 1 and a BLEU score of 0. Users directly chose the CDM score. In Case 2, the prediction result is mostly correct, but the BLEU score is significantly lower than expected, leading users to prefer the CDM score.
Both scores are equally good (32%): Examples in this scenario include cases 3 and 4, where the CDM and BLEU scores are relatively close, both reflecting the proportion of model prediction errors in an accurate and intuitive manner.
BLEU is better (3%): In Case 5, due to different token representations of ”BF”, BLEU detects inconsistencies, while CDM considers and as the same token.
Neither score is good (1%): In Case 6, although the two formulas contain different tokens, "\mathcal{E}" and "\varepsilon", they render similar images ( and ). Both CDM and BLEU fail in this case.
CDM is reliable in 96% of cases. The remaining 4% are due to LaTeX issues, which will be optimized in future versions, with minimal impact on the overall evaluation.

A.1 Latex Rendering and Syntax Errors
CDM relies on normalizing LaTeX source code and rendering images. Therefore, code that cannot be rendered or contains syntax errors (which cannot be normalized) will result in computation failures. For example, the expression "z = \left( \begin{array}{cc} x \\ y" is a failure case due to a missing "\end{array}", leading to rendering failure. For these cases, CDM assigns a score of 0. Although CDM cannot directly handle them, this approach is reasonable and aligns well with human perception.
The number of LaTeX rendering and syntax errors depends on the quality of the model’s prediction. Among the four models, Pix2tex, Texify, Mathpix, and UniMERNet, the proportion of LaTeX rendering and syntax errors in the predicted results on the UniMER-Test is 13.83%, 5.03%, 2.38%, and 1.05%, respectively.
A.2 Rendering Types Affecting Token Consistency
CDM defines characters without considering rendering styles. However, different rendering styles can produce visually distinct results, potentially causing different tokens to render into nearly identical characters(Figure 6 Case6), or same tokens to render into different characters(Figure 6 Case5). Similar situations include "G" and "\mathcal { G }", "\mathcal { X }" and "\mathfrac { X }", whose rendering effects are , respectively. This inconsistency can confuse the token consistency check, leading to errors in the model’s output.
Appendix B In-Depth Methodology for Evaluating Tiny-Doc-Math
B.1 Construction of Tiny-Doc-Math Dataset
The evaluation dataset is constructed primarily from arXiv papers in the fields of mathematics and computer science, published after June 2024. We manually select a batch of these papers and download the LaTeX source code and corresponding PDFs. Using regular expressions, we match the formulas displayed from the LaTeX source. After individual formula rendering and manual verification, the Tiny-Doc-Math validation set is built, comprising 12 papers, 196 pages, and a total of 437 formulas.
B.2 Formula-Level Evaluation Methodology
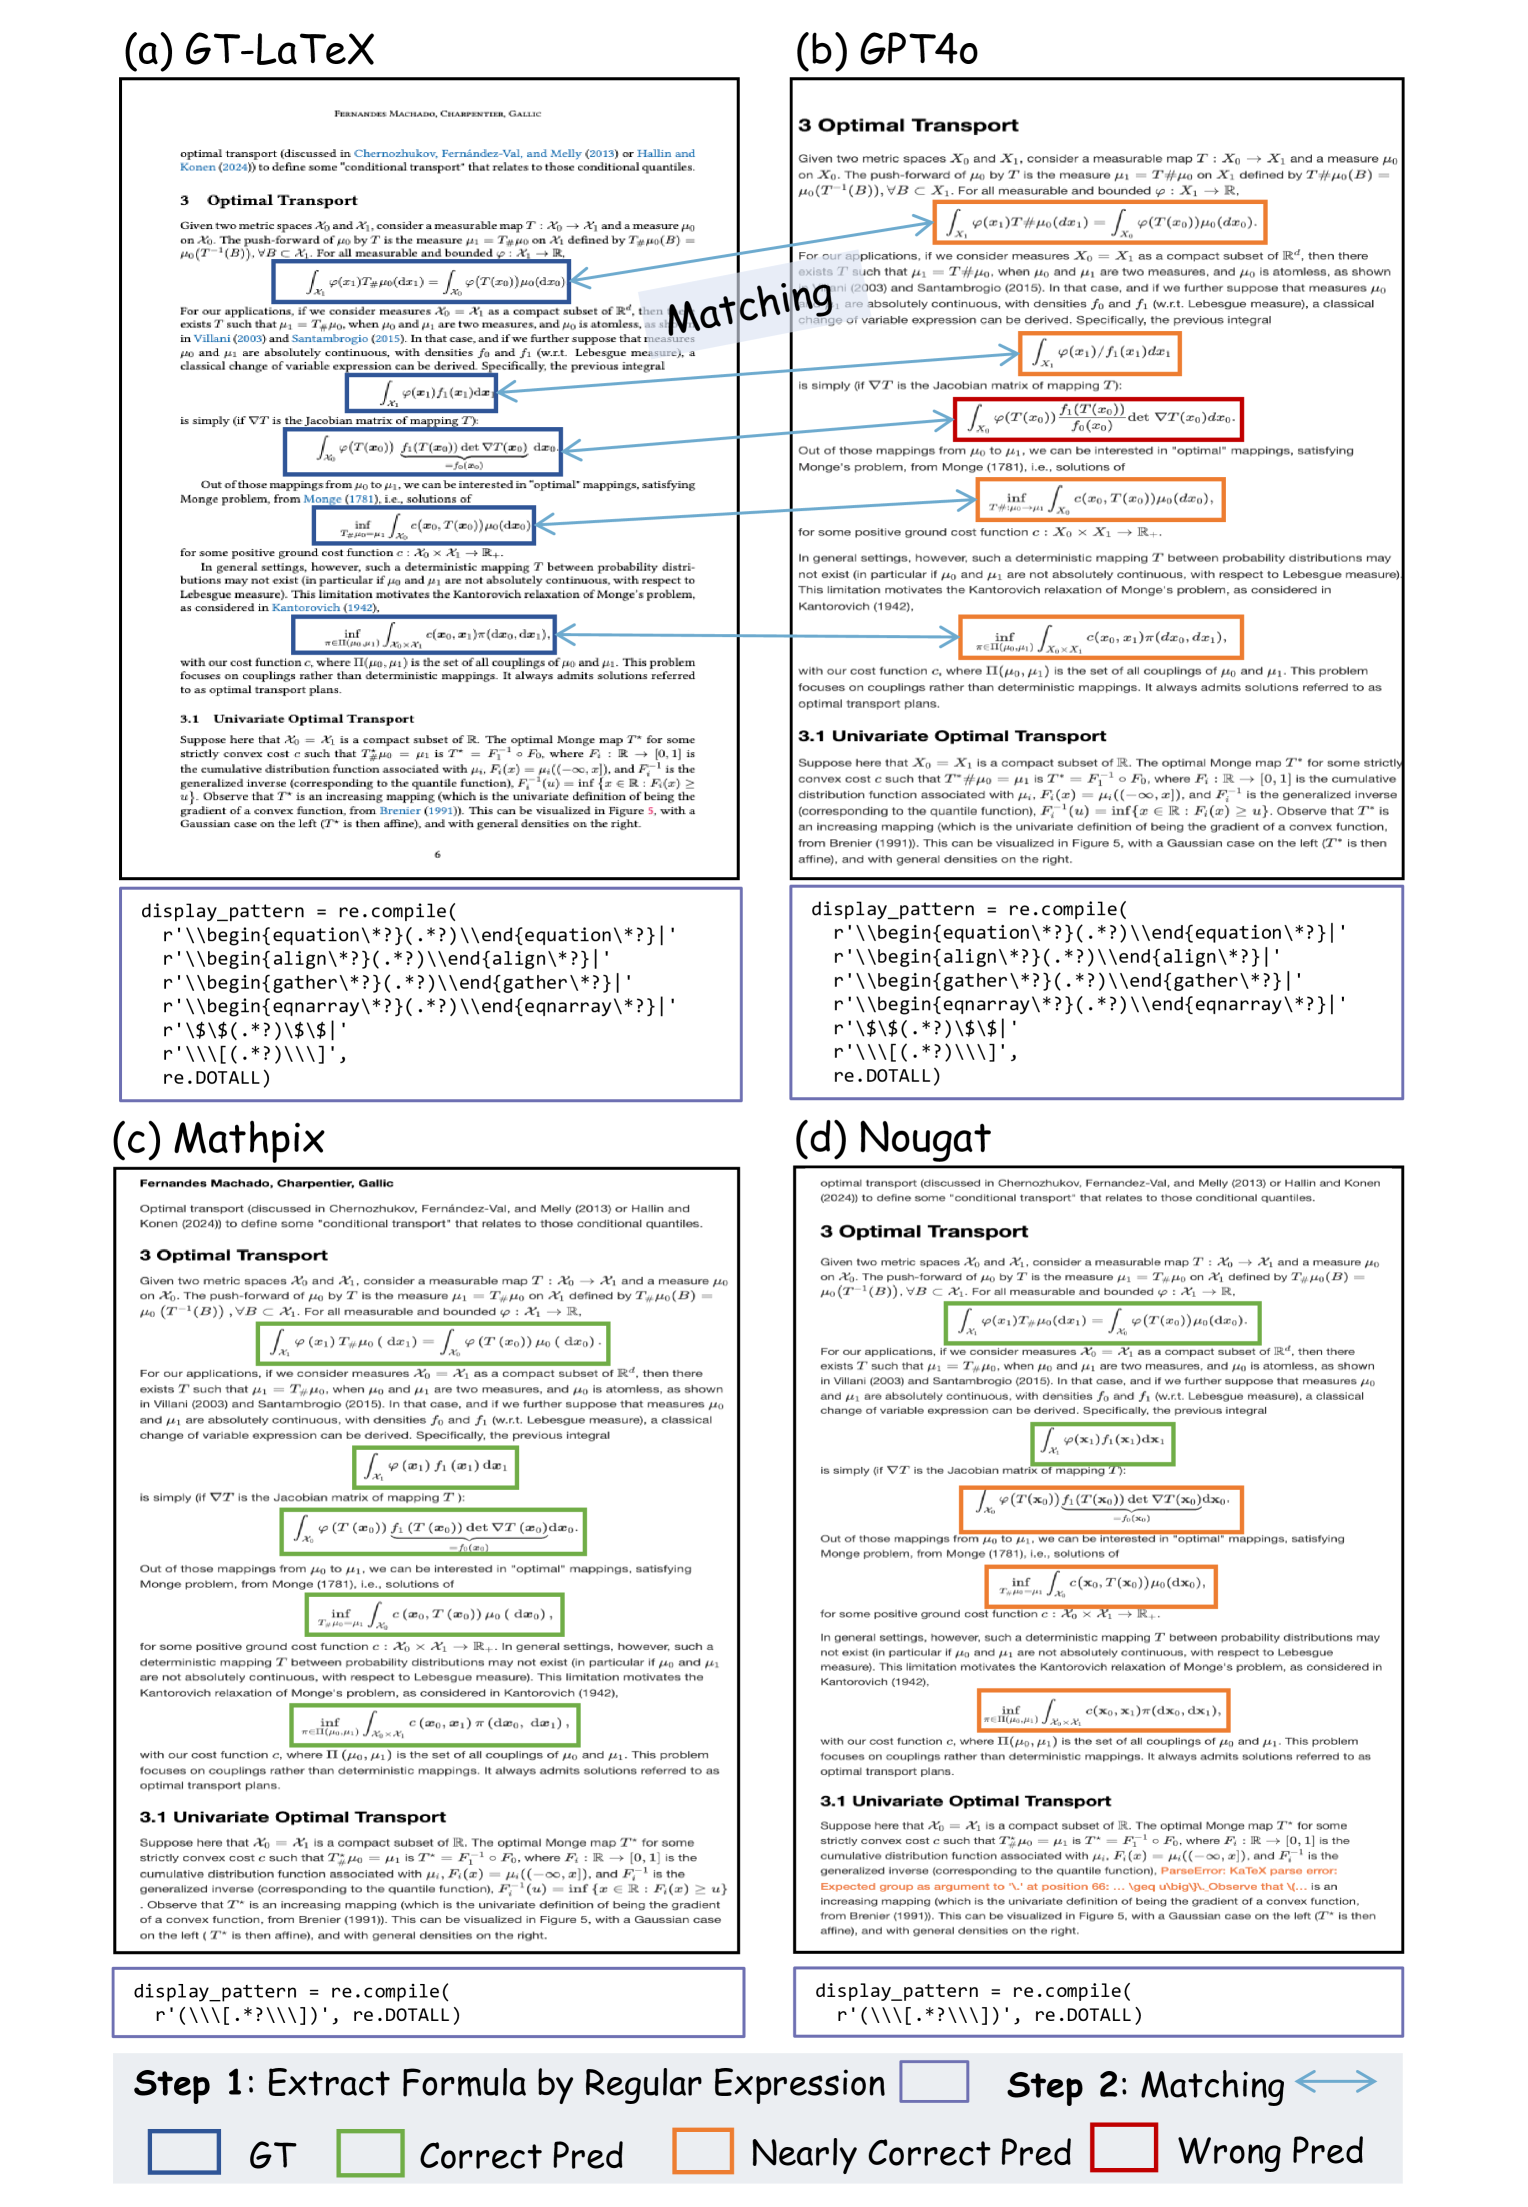
Once the evaluation dataset is constructed, we extract mathematical formulas from the LaTeX source code. Since LaTeX sources may contain custom commands and comments from authors, we apply a series of preprocessing steps to ensure accurate extraction. First, we remove comments from the LaTeX source using regular expressions (including "%", "\iffalse... \fi", and "\begin{comment}...\end{comment}"). Next, we convert aliases defined by commands such as "\newcommand{}{}", "\renewcommand{}{}", "\DeclareMathOperator{}{}", "\DeclareMathOperator*{}{}", "\def\...{}", and "\DeclareRobustCommand{}{}" to their original forms to ensure successful formula rendering. We then remove content before "\begin{document}" to avoid matching irrelevant information. After preprocessing, we extract displayed mathematical formulas from the LaTeX source using a series of regular expressions, as shown in Figure 7(a). For each paper, the matched mathematical formulas are written to a text file, one formula per line.
We render the extracted GT mathematical formulas to obtain formula-level GT images, which are then used as inputs for Mathpix, UniMerNet, pix2tex, and GPT-4o to generate corresponding predictions. Finally, we compute metrics such as BLEU and CDM after matching the predictions with the GTs.
B.3 Document-Level Evaluation Methodology
We convert PDF pages to images and use these images as inputs for Mathpix and GPT-4o to generate corresponding predictions, while Nougat takes the whole PDF as input. After obtaining the document-level predictions, we used extraction algorithms to extract displayed formulas from the predictions, and match them with the GT formulas obtained in the previous section to compute BLEU and CDM metrics.
Due to the different syntax formats of the outputs from different models, we use different regular expressions to extract formulas for each model, as shown in Figure 7(b), (c), and (d). Similarly, for each PDF, the matched mathematical formulas from each model’s predictions are written to a text file, one formula per line.
B.4 Matching and Metric Computation
After obtaining the GTs and predicted mathematical formulas, we match the GTs with the predicted formulas line by line to compute the final CDM metric. Given the high accuracy of displayed formula predictions, we use edit distance as the metric for matching formulas. To account for different math delimiters used by different models (e.g., "\begin{equation}...\end{equation}" vs. "\[...\]" ), we remove all math delimiters before matching, focusing solely on the content. Labels and tags are also removed from the formulas.
The matching process consists of two rounds. In the first round, we set a low edit distance threshold for precise matching. This means that only predictions with a high similarity to the ground truth formula will be matched. We iterate through the GT formulas, calculating the edit distance with all predicted results. The prediction with a minimum edit distance is recorded as matched only if the minimum edit distance was below the threshold. If not, we skip the line and mark both the GT and the prediction as unmatched. In the second round, we set a higher threshold to account for those matching cases where the edit distance might be large. We iterate through the unmatched GT formulas, calculate the edit distance with the remaining unmatched predicted formulas, and record matches if the distance is below the threshold. If any predicted formulas remain unmatched after the first two rounds, we mark them as incorrect or redundant predictions and append them to the end of the matched results.
Through practical implementation, we find that setting the first-round threshold to 0.4 and the second-round threshold to 0.8 provides the most reasonable matching. Although extreme cases might occur where the rendered results are identical but fail to match due to large edit distances, these instances are not common and have been manually corrected.
After matching the GTs and predicted formulas, we compute metrics such as BLEU and CDM.
B.5 Result Discussion
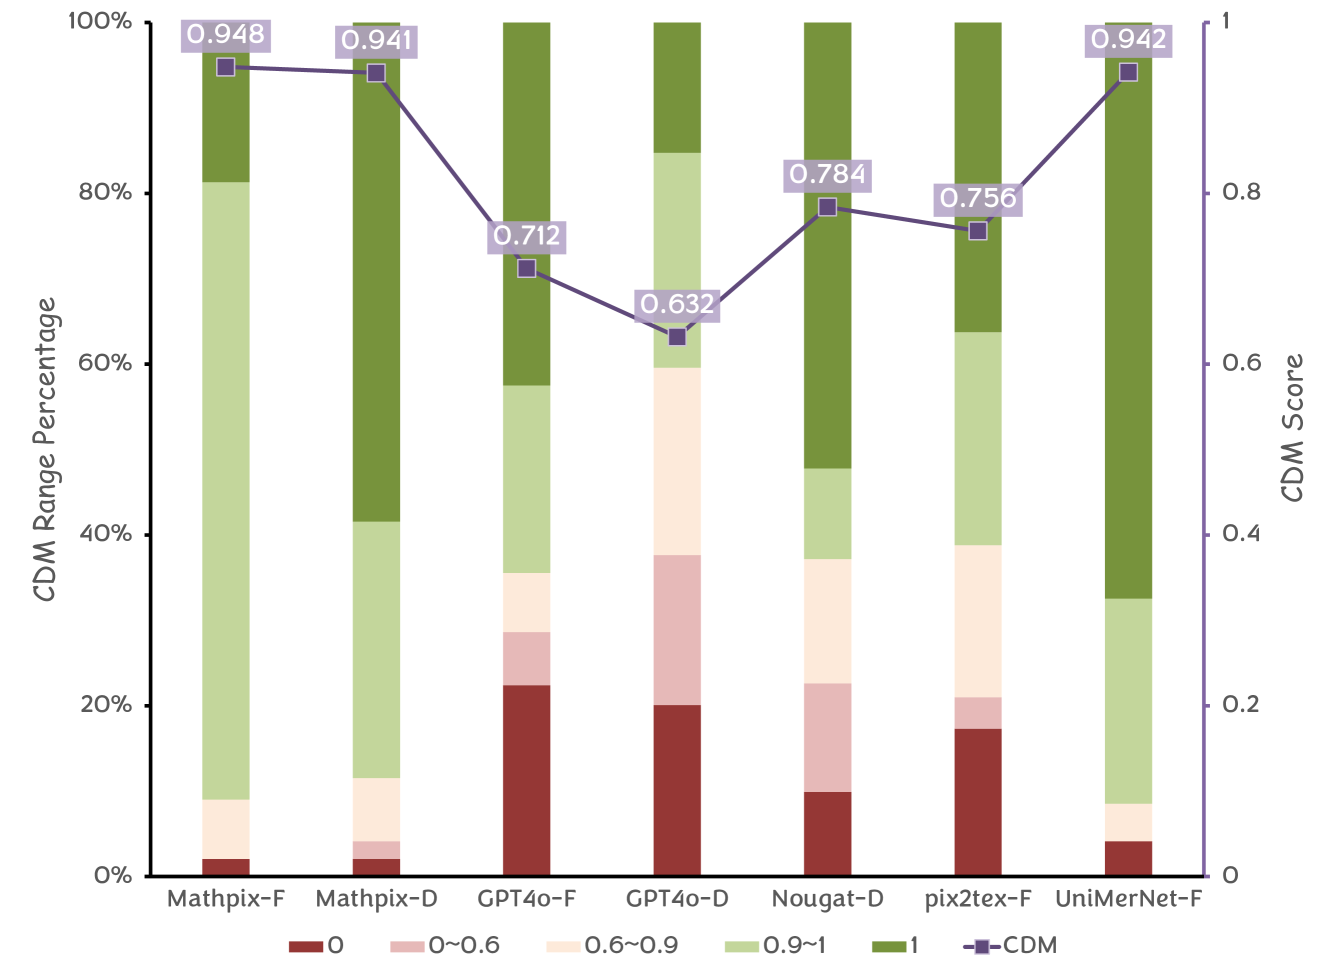
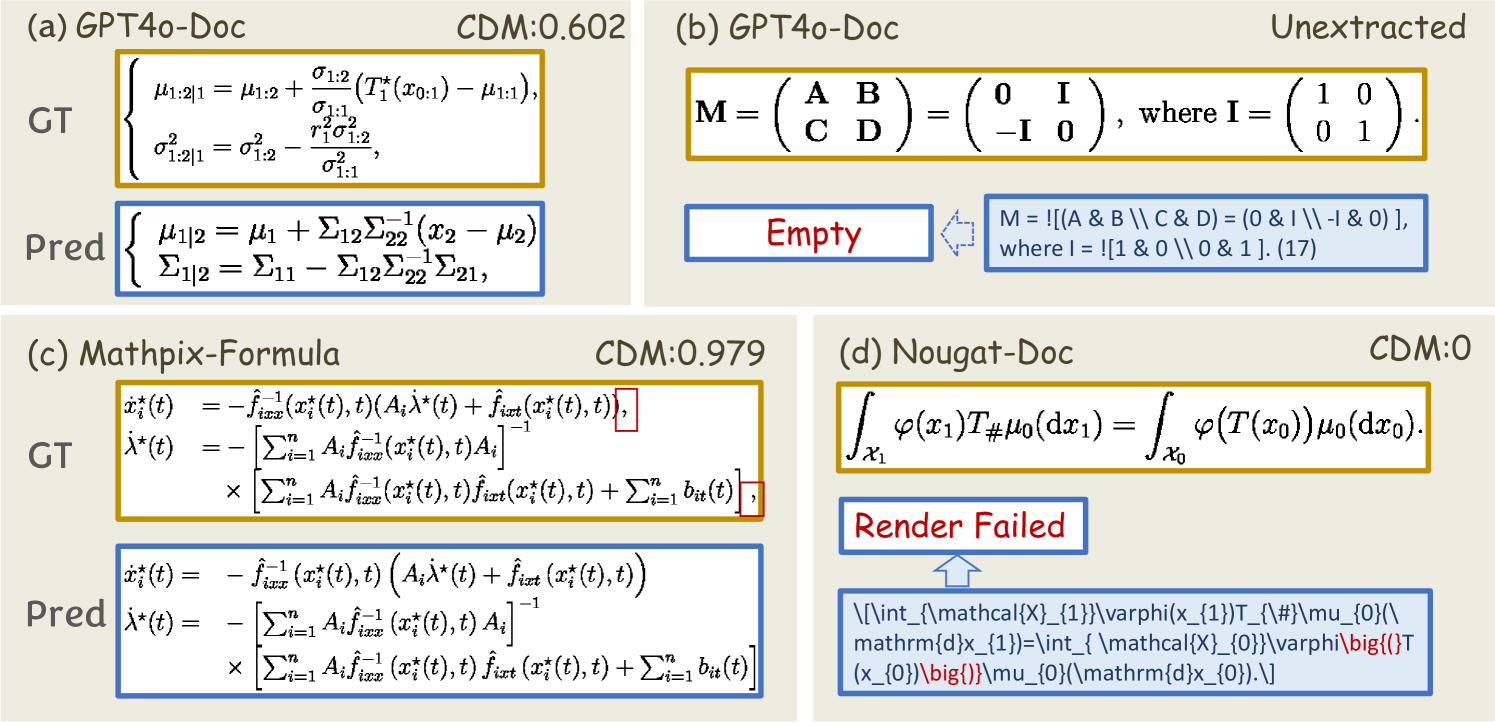
As shown in Figure 8, GPT-4o’s document-level predictions exhibited a significant number of CDM scores between 0.6 and 0.9, primarily due to hallucination phenomena in large models. For example, as shown in Figure 9(a), GPT-4o generates structurally similar but content-irrelevant results. Additionally, as shown in Figure 9(b), GPT-4o’s predictions often lack standardized formatting, i.e., frequently generating formulas without math delimiters, leading to extraction and rendering failures and resulting in many CDM=0 cases. For Mathpix, although the CDM between the document level and formula level is close, the proportion of CDM=1 predictions at the formula level is significantly lower. This is mainly due to the lack of commas in Mathpix’s single formula predictions, as shown in Figure 9(c). Nougat’s predictions often contain syntax errors, as shown in Figure 9(d), leading to rendering failures and CDM=0 cases. Moreover, Nougat’s predictions sometimes leave several pages in the middle of the PDF with no prediction results, resulting in missing formulas in the final output.

Appendix C Efficient Data Selection for Formula Recognition
Current formula recognition methods often overlook the importance of sample selection during training. We demonstrate that by utilizing the CDM metric for training data selection, it is possible to achieve performance comparable to using the entire dataset while only utilizing less than 20% of the data. We conduct the following experiment: First, we randomly split the UniMER-1M dataset into ten equal parts. We then train the model using 10%, 20%, up to 100% of the data and observe the model’s performance with varying amounts of training data. As shown by the blue points in Figure 10, the model’s performance generally improves as the amount of training data increases. Notably, with just 10% (106,179 samples) of the data, the model achieves satisfactory performance, accurately predicting most formulas. This suggests that the remaining 90% of the data may be largely redundant for training purposes.
To further investigate, we perform two rounds of hard case data selection. First, we use the model trained on 10% of the data to identify samples with CDM from the remaining 90%. We find 76,026 such samples, which is less than 8% of the remaining data, indicating that over 90% of the formulas can be accurately predicted. Combining these with the initial 10% random data, we have a total of 182,205 samples (17.16% of the UniMER-1M dataset). As shown in Figure 10, the model trained on this combined dataset performs comparably to the model trained on the full dataset, except for a slight underperformance on the SCE subset.
Next, we use this model to further select hard cases from the remaining data, identifying an additional 9,734 samples, representing about 1% of the remaining data. This brings the total to 191,939 samples (18.08% of the full dataset). The performance of this model shows a slight improvement over the previous round, achieving results comparable to or even exceeding those of the model trained on the full dataset across various subsets.
This experiment demonstrates the effectiveness of using CDM for hard case selection in formula recognition. Training based on hard case mining can serve as an efficient method to enhance model performance. This approach allows for the expansion of training data by selecting only the necessary samples, eliminating the need to use the entire dataset. Future formula recognition datasets can be expanded using this method, focusing on the most challenging samples to improve model accuracy and efficiency.
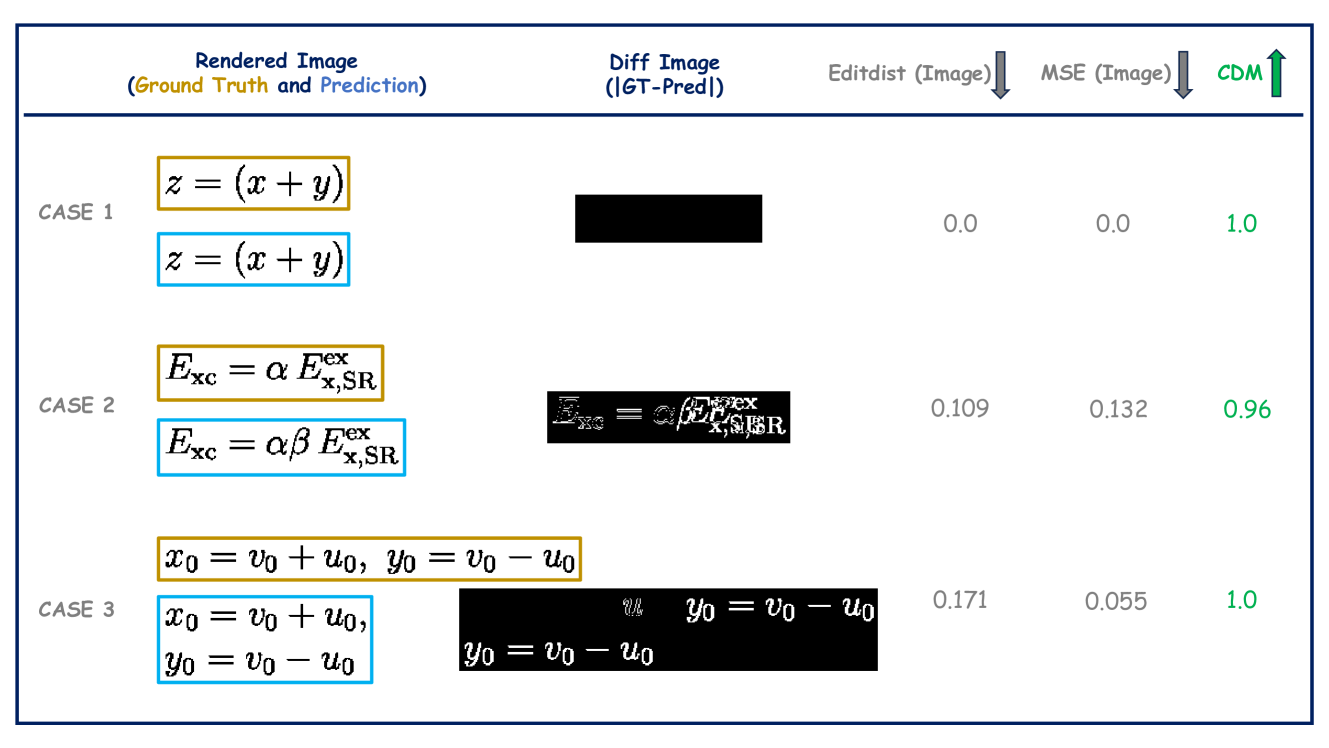
Appendix D Evaluation Method Based on Image Differences
Previous work Wang and Liu (2021) mentions using image-based difference methods for evaluating formula recognition results, but a thorough analysis of the limitations of this approach is needed. To further assess the effectiveness of these methods, we conduct experiments using both image edit distance (Editdist) and Mean Squared Error (MSE) of image differences. As shown in Figure 11, Case 1 demonstrates that when the model’s prediction is correct and the rendered output perfectly matches the ground truth (GT), both EditDist and MSE are zero, indicating an accurate formula. However, in Case 2, where the prediction misses the character , the image-based difference method flags all subsequent positions as mismatched, even though only one character is missing. A more severe example is illustrated in Case 3, where the predicted formula content is correct but an extra newline character is predicted, leading to a significant image difference. In this case, both EditDist and MSE are non-zero and fail to reflect the error accurately. This highlights the necessity of the proposed CDM metric.