|
Data Table |

  
|
|
Data Table |
|
General
The data table allows you to view the geometry and attribute values of a data object. The data table can be accessed from the General settings in the Settings dialog, or it can be launched by right-clicking on the data object in the Data Explorer, and selecting Spreadsheet... . Note: Map and Cross Section data objects do not have a data table.
|
|
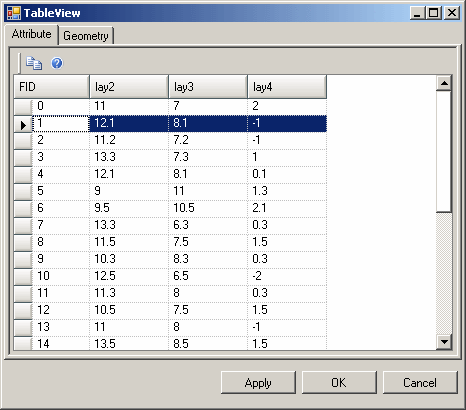
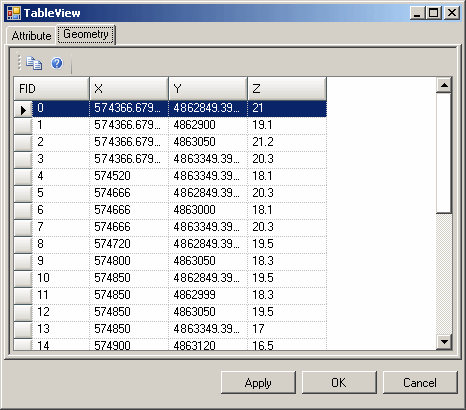
The Attribute tab contains the attribute data of the selected data object. Each column in the attribute tab represents an attribute. The Geometry tab contains the geometry (X,Y, Z) values of the data object. In both tabs, the FID column uniquely identifies each feature in the data object.
To copy data to the Windows clipboard, highlight the data to be copied, and then click the Copy button ![]() , or press CTRL+C on your keyboard.
, or press CTRL+C on your keyboard.
Tip! When a data object is shown in 2D Viewer and the viewer is set to Pick Mode, you can select a row from the attribute or geometry table, and the corresponding feature will be highlighted in the 2D Viewer.
Modifying Attribute and Geometry Data
Imported geometry and attribute data can be modified in the Data Table. To make changes to data, click the ![]() Begin Edit button to enter edit mode. Make the necessary changes to the data table and once finished, click the
Begin Edit button to enter edit mode. Make the necessary changes to the data table and once finished, click the ![]() End Edit button to save the changes. Please note that the data table only allows you to modify existing attribute and geometry data. Currently, VMOD Flex does not allow you to create new columns, i.e., new data object attributes. This can only be done during the data import process.
End Edit button to save the changes. Please note that the data table only allows you to modify existing attribute and geometry data. Currently, VMOD Flex does not allow you to create new columns, i.e., new data object attributes. This can only be done during the data import process.
For Wells data objects, the data table is different than that of other data objects. The Well data table is designed to allow you to add and/or modify wells and associated well data, e.g., pumping schedule, screen intervals, observation points, etc.
To access the well table, right-click on a Wells data object in the Data Explorer, and select Settings... . In the Settings dialog, click on the Table button.
In the Well Table, there are two tabs: Vertical and Horizontal. Each tab is described in the following sections.
Vertical Wells
The Vertical tab allows you to view and modify data for vertical wells.
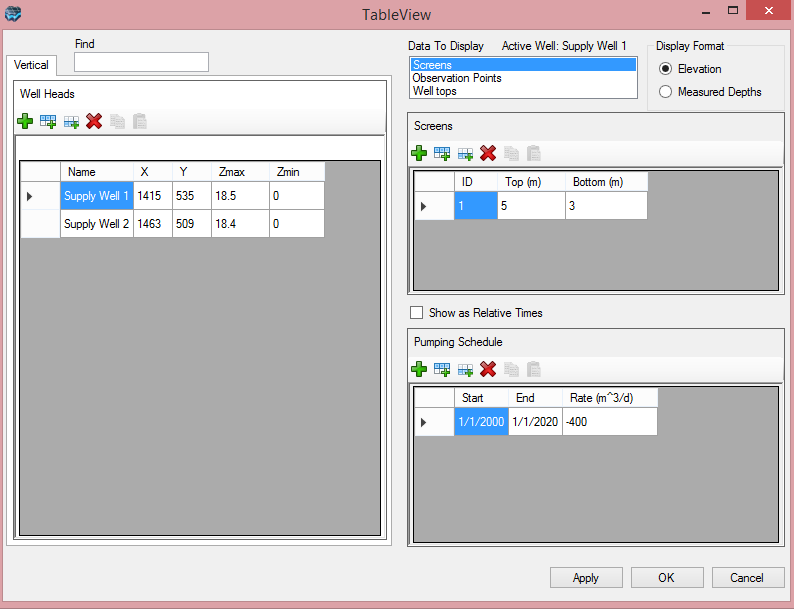
The Well Heads table contains a list of all the wells in the data object. The data stored in this table includes the Name, X-Y coordinates, Elevation and Depth for each well. When a well is selected, its corresponding attribute data is displayed in the adjacent data tables, e.g., Screens, Pumping Schedule. You can search for a well in the Well Heads table by entering the well name in the text box, located at the top of the window, and then clicking the [Find] button.
The Data to Display list box allows you to select which tables to display. For example, if Screens is selected (default), the Screens and Pumping Schedule tables will be shown. If Observations is selected, the Observation Points and Observation Data tables are shown. If Well Tops is selected, the Well Tops table will be shown.
The Display Format frame allows you express the Z values in the data tables as either an Elevation or a Measured Depth (with respect to the well head Zmax).
At the top of each table, there is a set of buttons that allow you to add, remove and modify the contents. The function of these buttons, in order from left to right, is described below:
| · | Add a row to the table |
| · | Insert a row above the active row |
| · | Insert a row below the active row |
| · | Remove the active row from the table |
Adding Well Head Data
To add an item to the Well Head table, follow the steps below:
| · | Click the Add Row button from the Well Head toolbar to add a new item to the table. |
| · | Enter an alphanumeric name in the Well Name column. Note: The well name must be unique and it may contain hyphens and spaces, but not the forward or backward slash characters. |
| · | Enter the X-Y coordinates of the well head in the X and Y fields, respectively. |
| · | Enter the elevation of the well head in the Zmax field. |
| · | Enter the depth of the well in the Zmin field. |
Adding Well Screens
To add an item to the Well Screen table, follow the steps below:
| · | Make sure the Screens option is selected from the Data to Display box. |
| · | Select a Well from the Well Head table |
| · | Click the Add Row button from the Screens toolbar to add a new item to the table. |
| · | Enter a screen identification number in the Screen ID field. |
| · | Enter a screen top elevation (or measured depth) in the Screen Top field. |
| · | Enter a screen bottom elevation (or measured depth) in the Screen Bottom field. |
Adding/Editing Pumping Well Schedule
The Pumping Schedule table is used to enter the well pumping rates for specified time periods. Negative pumping rate values are used for extraction wells, and positive pumping rates are used for injection wells.
Pumping well schedules are defined for the entire well, and therefore a screen must exist before a pumping schedule can be defined.
To add pumping schedule items to the pumping schedule table:
| · | Make sure the Screens option is selected from the Data to Display box. |
| · | Select a Well from the Well Head table, and a Screen from the Screen Table (if multiple screens exist) |
| · | Click the Add Row button from the Pumping Schedule toolbar to add a new item to the table. |
| · | Enter a Start time value and press the <Tab> key to advance to the End time field. |
| · | Enter an End time value and press the <Tab> key to advance to the Rate field. |
| · | Enter a pumping Rate value (remember to use a negative value for extraction wells) |
| · | Press the <Tab> key again to create a new schedule item. |
| · | The final time in the pumping schedule should have a pumping rate of 0 to indicate the stop time. |
Note: If the pumping schedule is not specified for the entire length of the transient simulation, then it will assume the well is shut off for the time where no information is available. For steady-state simulation, the pumping rate for the first time period will be used as the steady-state pumping rate.
The "Show as Relative Times", when selected will display time schedule data starting at 0, and relative to the start date defined in the Modeling Objectives; this is useful when you want to correlates the raw well data to MODFLOW time formats. When this option is not selected, then time schedule data will appear in "Absolute" (calendar) time formats.
Adding Observation Points
Observation Points are the elevations at which head or concentration observations are recorded. Although most monitoring or observation wells are installed with a well screen spanning a known interval of the aquifer, VMOD Flex requires a single observation point elevation to be defined instead of a well screen interval.
To add an observation point for a well:
| · | Select the Observations option from the Data to Display box. This will show the Observation Points table. |
| · | Select a well from the Well Heads table |
| · | Click the Add Row button from the Observation Points toolbar to add a new item to the table. |
| · | Enter an observation point ID in the ID field. |
| · | Enter an elevation value in the Elevation field. |
The MODFLOW simulator supports head and concentration observation wells with multiple observation points throughout the length of the well-bore. Repeat the steps above to add additional points.
The Observation Data table is used to enter the observed values at specified times, for the selected observation point.
To add observations to the Observation Data table, follow the steps below:
| · | Select Observations from the Data to Display box. |
| · | Select the well from the Well Heads table for which observation data will be added. |
| · | Select the desired observation point from the Observation Points table. |
| · | Click the Add Row button from the Observation Data toolbar to add a new item to the table. |
| · | Enter the time at which the head was observed in the Time field. |
| · | Enter the observed head values in the Head field. |
The "Show as Relative Times", when selected will display time related data starting at 0, and relative to the start date defined in the Modeling Objectives; this is useful when you want to correlates the raw well data to MODFLOW output time. When this option is not selected, then time related data will appear in "Absolute" (calendar) time formats.
Adding Well Tops
The Well tops table is used to enter the elevation points along the well path, where the well intersects with a horizon. Well top information can be used in VMOD Flex to create surfaces which can then be used to define conceptual model horizons. For more information on creating surfaces from well tops, please see "Converting Well Tops to Points Data Object" section.
To add well top information to the Well Top table, follow the steps below:
| · | Select Well Tops from the Data to Display box. |
| · | Select the well from the Well Heads table for which well top data will be added. |
| · | Click the Add Row button from the Well Tops toolbar to add a new item to the table. |
| · | Enter the location of the well top as a measured depth in the Depth field. |
| · | Enter the name of the formation, e.g., Clay, Sand etc., in the Formation field. |
Horizontal Wells
The Horizontal Well tab is used to store information on deviated (horizontal wells) and contains many of the features available in the Vertical Well tab, e g., add/modify screens, pumping schedule observation points etc. Please refer to the previous section for a description of these common features. The primary difference of the horizontal well tab is the ability to view and modify the deviated Well Paths.
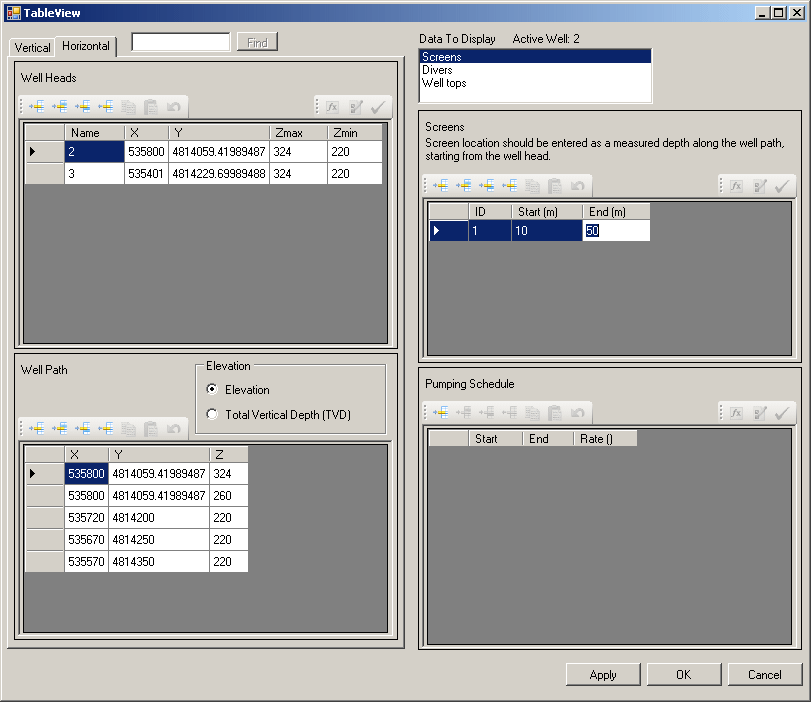
Well Path Table
The Well Path table is used to view, add and modify the well paths for horizontal wells. When a well is selected from the Well Heads table, its corresponding well path geometry data is displayed in the Well Path table.
Horizontal well paths consist of a series of points with known coordinates and elevation that represent nodes along the well path trajectory. VMOD Flex then creates the well path by connecting each node in the series.
The Elevation frame allows you specify the Z value of the well path nodes as either an Elevation or as a Total Vertical Depth (measured from ground surface).
Adding Well Path
To add a new well path node to the Well Path table:
| · | Select the Well from the Well Heads table for which the well path will be created. |
| · | Click the Add Row button from the Well Path toolbar to add a new item to the table. |
| · | Enter the X, Y and Z value of the well path node in the table. If this is the first row in the table, you would enter the X, Y and Z values of the well head, i.e., the top-most node in the well path. |
| · | Repeat above for additional nodes. |