仔细研究类别不平衡下的 AUROC 和 AUPRC
摘要
在机器学习 (ML) 中,一个广泛的说法是,对于具有类别不平衡的任务,精确回忆曲线下面积 (AUPRC) 是模型比较的优于接收者操作特征下面积 (AUROC) 的指标。 本文从两个方面反驳了这一观点。 首先,我们从理论上描述了 AUROC 和 AUPRC 在存在模型错误的情况下的行为,明确表明 AUPRC 在类别不平衡的情况下通常并不优越。 我们进一步表明,AUPRC 可能是一个有害的指标,因为它可能会过度有利于具有更频繁的正标签的子群体中的模型改进,从而加剧算法差异。 接下来,我们使用半合成和现实世界公平数据集上的实验来实证支持我们的理论。 在这些见解的推动下,我们对超过 150 万篇科学论文进行了审查,以了解这一无效主张的根源,发现该主张常常在没有引用的情况下提出,被错误地归因于没有论证这一点的论文,并且从来源处过度概括论据。 我们的研究结果具有双重贡献:在理解 AUROC 和 AUPRC 之间关系方面取得了重大技术进步,并对 ML 社区中未经检验的假设提出了严厉警告。
1简介
机器学习 (ML),尤其是在医疗保健等关键领域,需要仔细选择和应用评估指标,以指导适当的模型选择并了解性能细微差别(Hicks 等人,2022)。 模型评估可以在以下两种设置之一中进行:(1) 方法/模型比较设置,该设置发生在特定部署设置和目标模型使用工作流程、最佳决策之外阈值或具体的误报 (FP) 和误报 (FN) 成本通常是未知的,或者 (2) 应用程序/部署 设置(在相当具体的情况下)可以估算模型使用工作流程和 FP/FN 成本。 在这两种情况下,适当的评估指标选择至关重要——不适当的评估指标在用于模型比较时可能会阻碍创新,并可能在部署环境中导致巨大的现实成本(例如,医疗环境中的误诊)。
本研究重点关注在两种评估环境中广泛使用的二元分类任务的两个关键指标:精确召回曲线下面积 (AUPRC) 和接收器操作特性下面积 (AUROC)。 本文的核心是以下关键主张:
Claim 1。
令 为一个模型,该模型输出经过训练的连续概率预测,以解决二元分类任务,其中负标签的流行率显着高于正标签的流行率。 对于这个问题,AUPRC 将产生比 AUROC “更好”或“更准确”或“更公平”的 评估。
主张1在科学文献(Wagner等人,2023;Choi等人,2018;Hsu等人,2020;Gong等人,2021)和在流行的新闻来源中(Czakon,2022;Mazzanti,2023),并已通过多种理由得到证明(参见第 5 节文献综述中整理的来源)。 尽管如此,我们在这项工作中表明,这种说法实际上是错误,并且其许多理由都是无效或被误用机器学习设置。 更具体地说,我们展示以下内容:
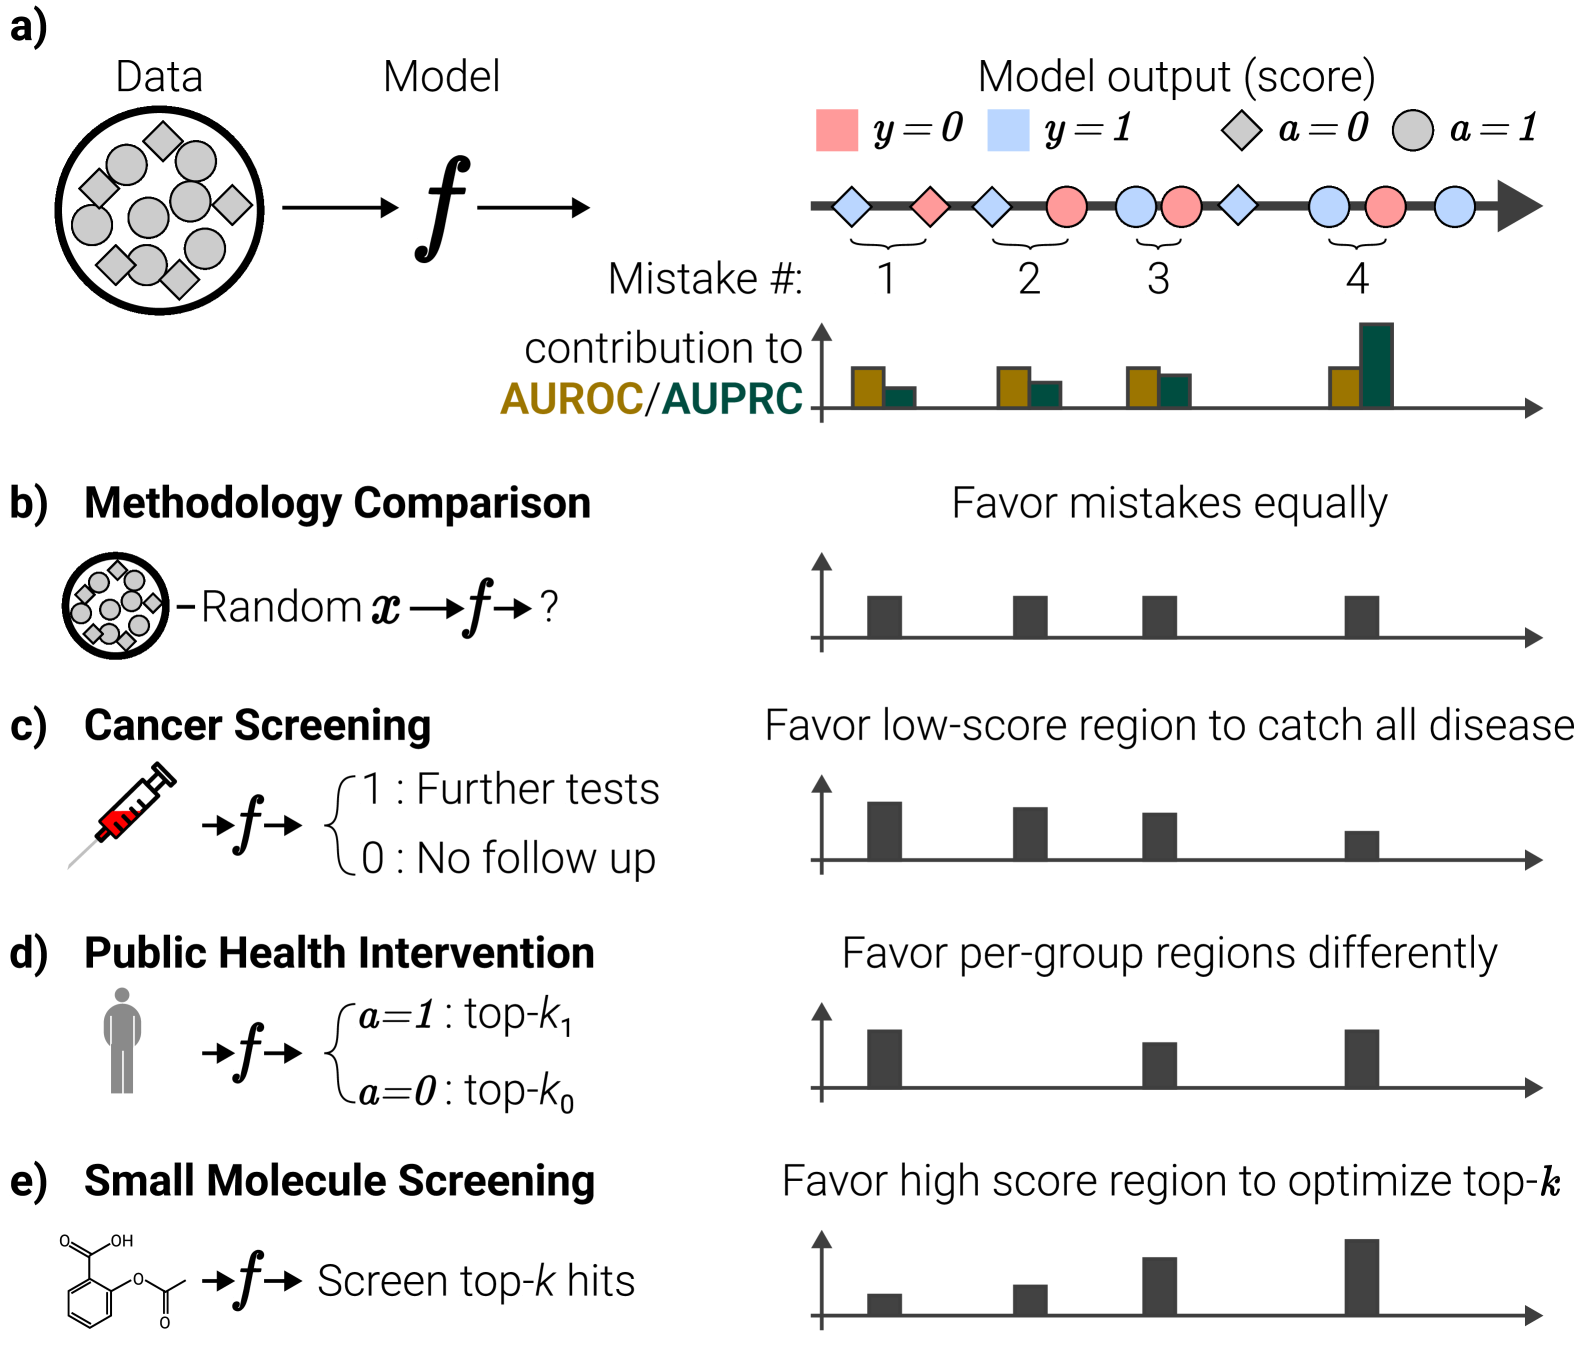
1) AUROC 和 AUPRC 仅在模型相关参数方面有所不同,因为 AUROC 对所有误报进行同等权重,而 AUPRC 在阈值 上对误报进行权重,并与模型输出的可能性成反比任何大于 的分数(定理 1)。 这个结果表明,我们可以根据我们是否更关心减少高于低阈值或高阈值的误报来推断 AUROC 与 AUPRC 优化或选择的适用性。 尤其,
2) AUROC 倾向于对所有正样本进行一致的模型改进,而 AUPRC 则倾向于对分配较高分数的样本进行改进(定理 2)。 这表明 区分 AUROC 或 AUPRC 作为评估指标的效用的关键因素根本不是类别不平衡,而是基于相关模型的目标用例。 请参阅图 1 以获取直观说明。 它还揭示了 AUPRC 可以放大算法偏差。 尤其,
3) AUPRC 可能会以牺牲低患病率子群体为代价,不适当地优先考虑对高患病率亚群体的改进,从而在任何多群体用例中引发严重的公平性问题(定理 3) 。
在这项工作中,我们将通过综合实验并在流行的公共公平数据集上进行现实验证,从理论上建立这三个主张。 我们还将通过对超过 150 万篇科学论文进行广泛的大型语言模型辅助文献审查来证明,声明 1 已被用来在高影响力领域中引发大量 AUPRC 相对于 AUROC 的不当使用例如一系列知名场所的医疗保健,包括 Cancer Cell、Nature Scientific Reports、AAAI 和 NeurIPS。 通过本文,我们希望更好地阐明适当评估的细微差别,并提供关键指导,以限制未来科学和机器学习社区中评估指标的滥用。
2 理论分析
2.1 AUROC与AUPRC之间的关系
本节我们介绍定理1,如下:
Theorem 1。
令 为模型输入 和标签 的数据分布 上的二元分类模型。 然后,
我们在附录C部分中提供了证明。两个关键的直觉是,对 TPR 进行积分相当于对正样本分数的诱导分布进行期望,并通过贝叶斯规则 进行期望。
尽管定理1很简单,但它具有深远的影响。 也就是说,它揭示了 AUROC 和 AUPRC 在模型相关参数方面的唯一区别(即忽略 AUPRC 对数据集固定流行率的依赖,这不是模型变化)是优化 AUROC 相当于最小化预期错误以未加权的方式计算所有阳性样本的阳性率(相当于对阳性样本分数分布的期望),而优化 AUPRC 等于最小化所有阳性样本的预期假阳性率,并按模型的“触发率”的倒数加权( )在给定的正样本分数上。 当我们研究 AUROC 与 AUPRC 如何优先纠正不可分割的模型改进单元(我们将在接下来讨论的“错误”)时,这种偏好就会具体化。
2.2 AUPRC优先考虑高分错误,AUROC平等对待所有错误
了解给定的评估指标如何优先纠正各种模型错误或错误,可以帮助您深入了解何时应将该指标用于优化或模型选择。 要检查 AUROC 和 AUPRC 的主题,请考虑模型“错误”的以下定义:
Definition 2.1。
令 为域 上的二元分类模型,该模型通过静态有限数据集 进行评估,对于 和 。 为了方便起见,我们假设 是单射映射,并且所有 都是不同的(即 )。
如果满足以下条件,我们称模型在样本 处犯了错误:
-
1.
和
-
2.
-
3.
使得。
本质上,定义2.1指出,当模型将相邻的概率分数分配给具有不一致标签的一对样本时,就会发生错误,如图1所示>。 考虑到这一点,我们可以引入定理 2,该定理指出,无论针对给定模型和数据集纠正了哪个错误,AUROC 都会提高一个恒定量,而当纠正的错误发生在某个时间点时,AUPRC 会提高更多。比发生在较低分数时更高的分数:
Theorem 2.
2.3 AUPRC 明显歧视高分人群
Theorem 3.
让和都按照定理2中的方式定义。 此外,假设在此设置中,域 现在包含一个定义两个子组 的属性,这样对于任何示例 、 表示该样本所属的子组。 让针对子组中的样本进行完美校准,使得。 让表示标签在子组上的流行度。 然后,
本质上,定理3(附录E中提供的证明)表明,对于任何感兴趣的模型,只要该模型经过校准,就存在足够严重的流行率差异,使得属于高流行率亚组以外的任何事物的最高分(将最大限度地提高 AUPRC)发生的错误的比例为零。 这表明,在足够严重的阶级不平衡的情况下,AUPRC 可以证明有利于较高患病率的亚人群。
请注意,一般来说,此属性不可取。 特别是,该属性表明,在数据中一组亚群之间的模型公平性很重要的情况下,AUPRC 不应用作评估指标,因为它可能会引入有利于最高患病率亚群的偏差。 我们在第 3 节中通过合成数据和真实数据验证了这一结果,证明定理 3 的重要性不仅限于分析好奇心,而且可以具有真实的意义。世界对实践中算法差异的影响。
此外,请注意,该定理并不表明 AUPRC 在区分相对于高风险亚群的低患病率(或低风险)亚群方面优于 AUROC,这一特性有时归因于 AUPRC在文献中。 相反,定理 3 表明,最大化 AUPRC 将更有可能仅在高风险子组内进行优化,而不是优化以区分不同子组,因为低风险子组样本只会出现在较低分数中阶级失衡严重的地区。
3实验验证
在本节中,我们通过综合和现实世界的实验确定,定理 3 不仅仅是一种分析效应,而且对通过 AUPRC 优化或执行模型选择的影响具有现实世界的影响。
3.1综合优化实验证明了 AUPRC 引起的差异
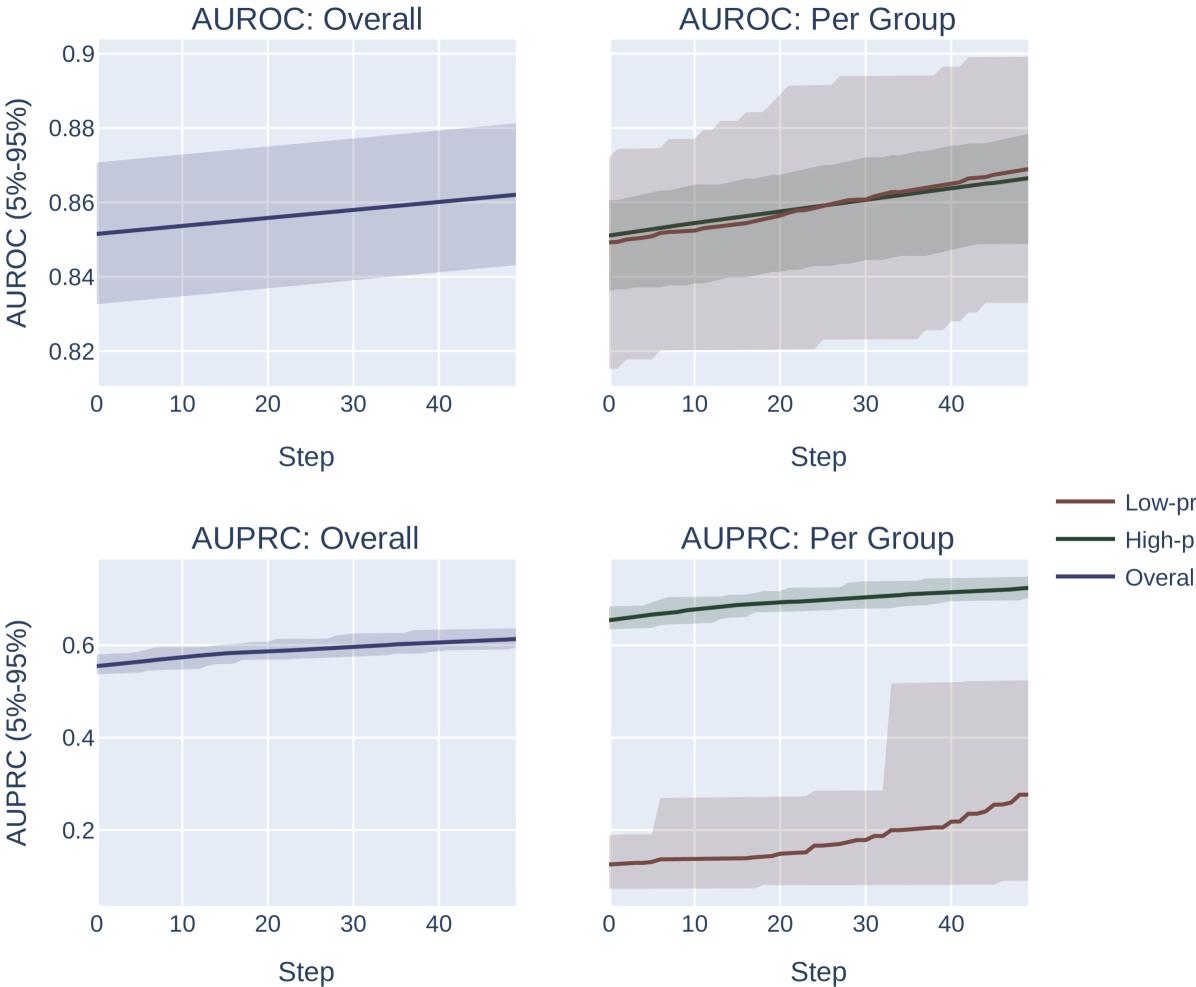
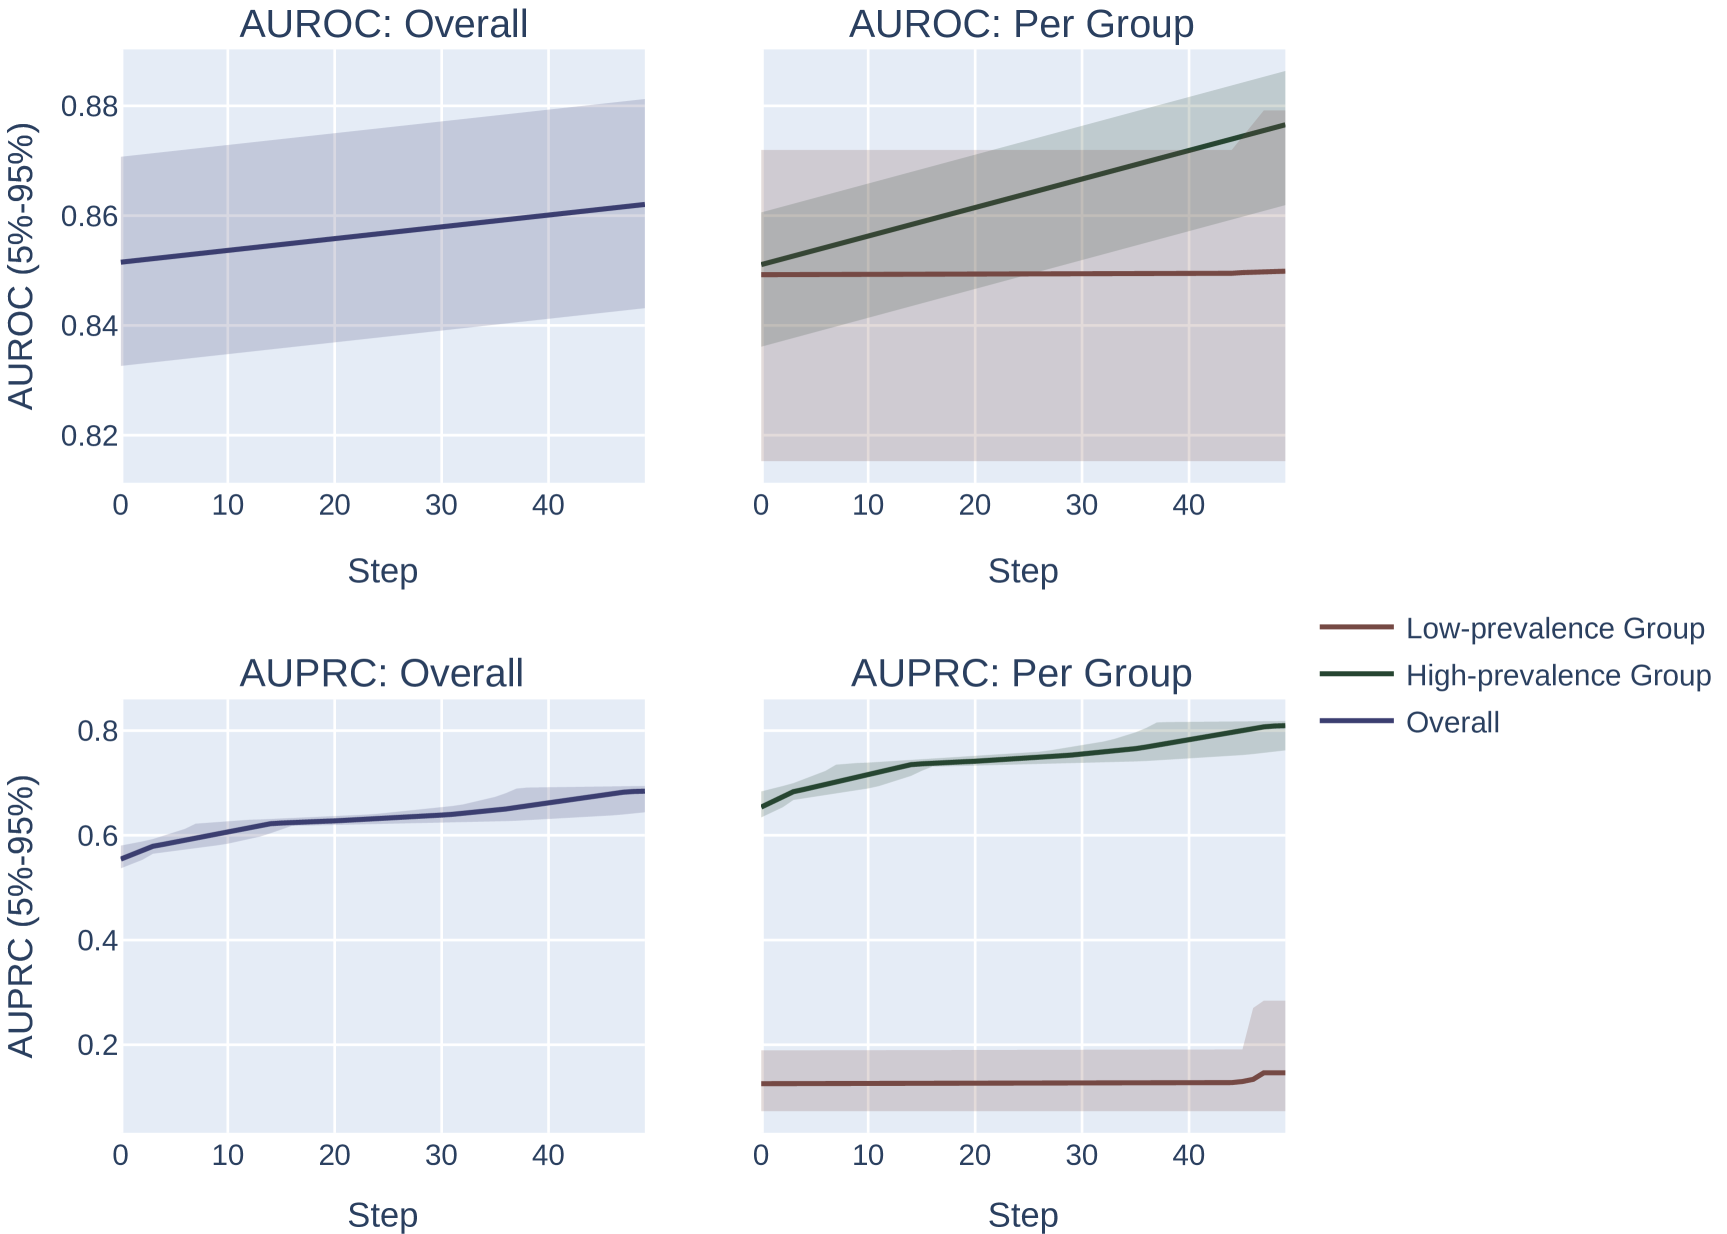
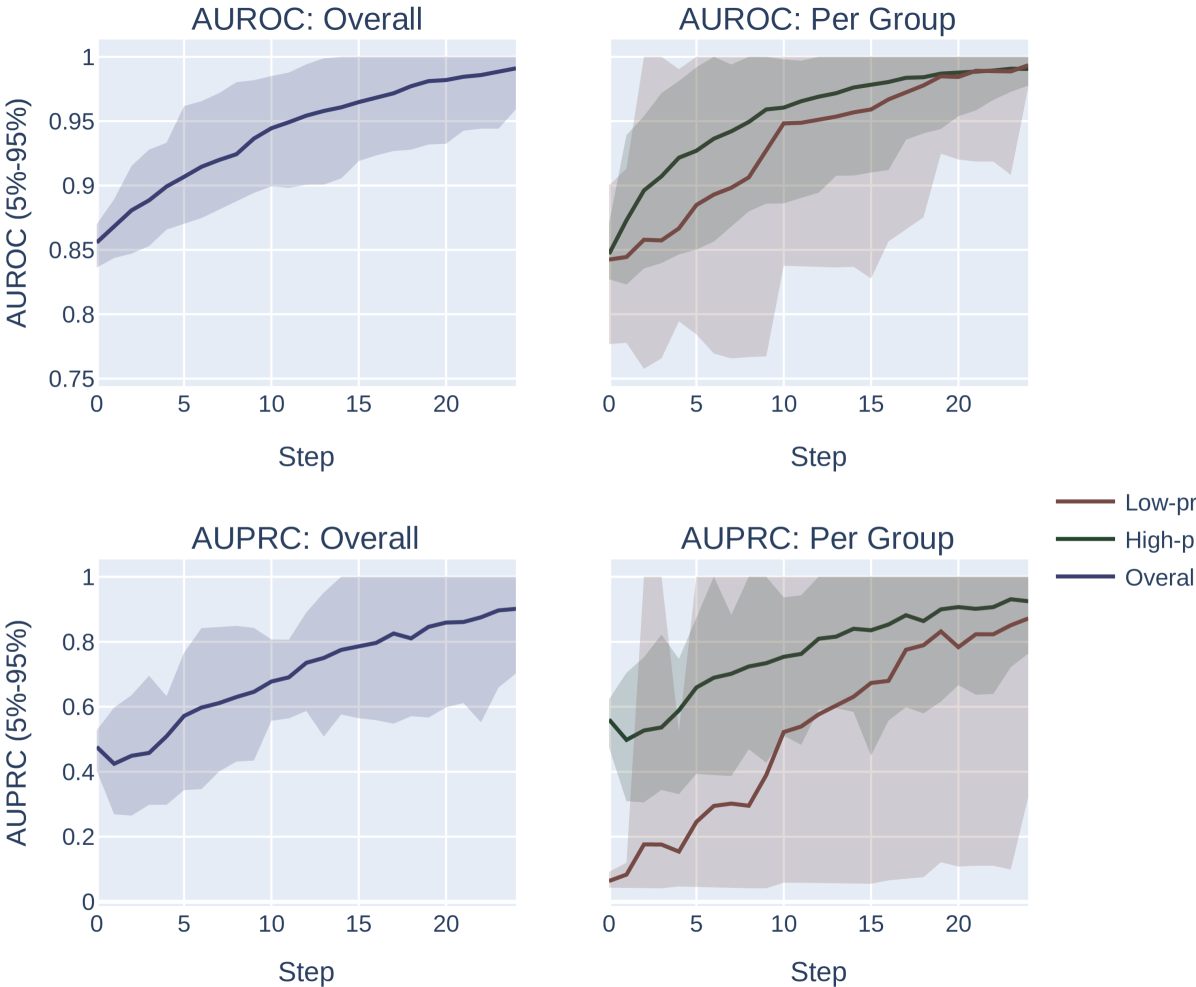
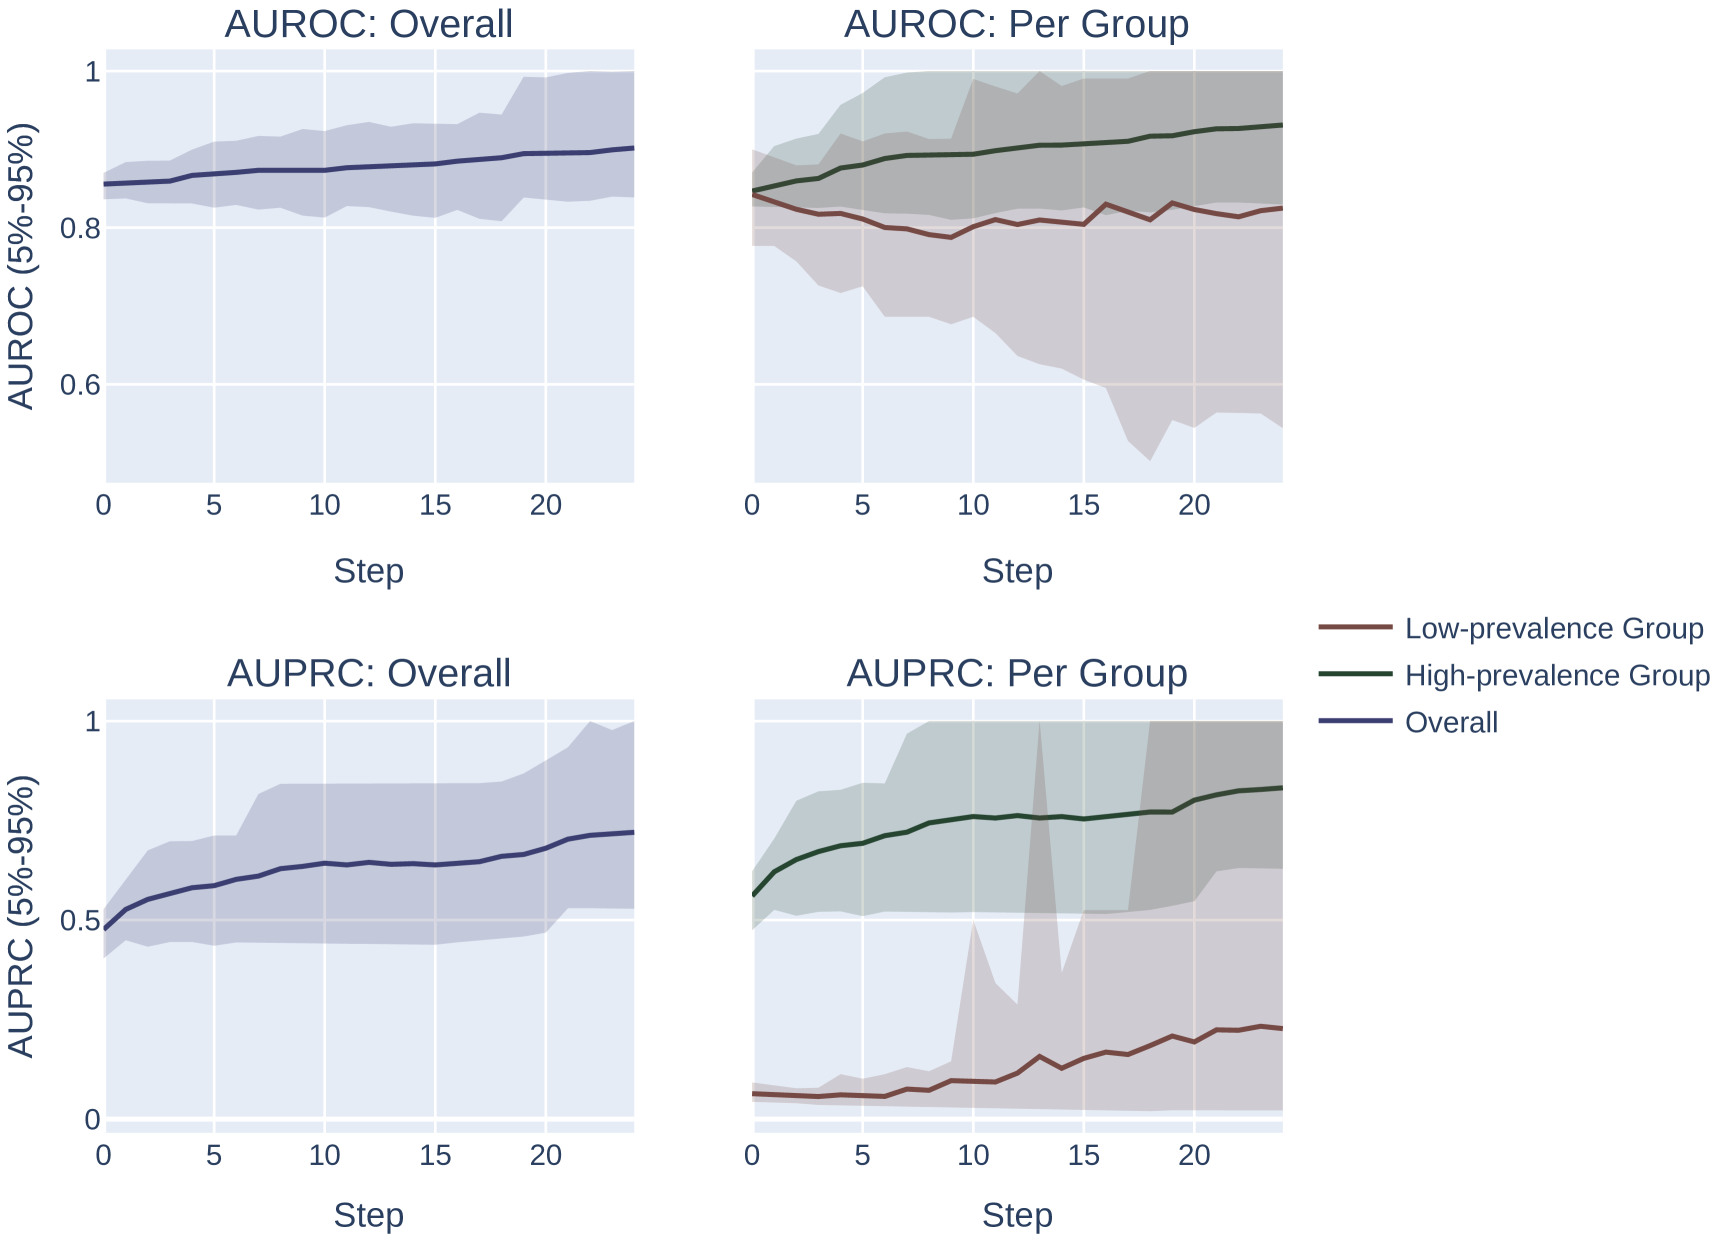
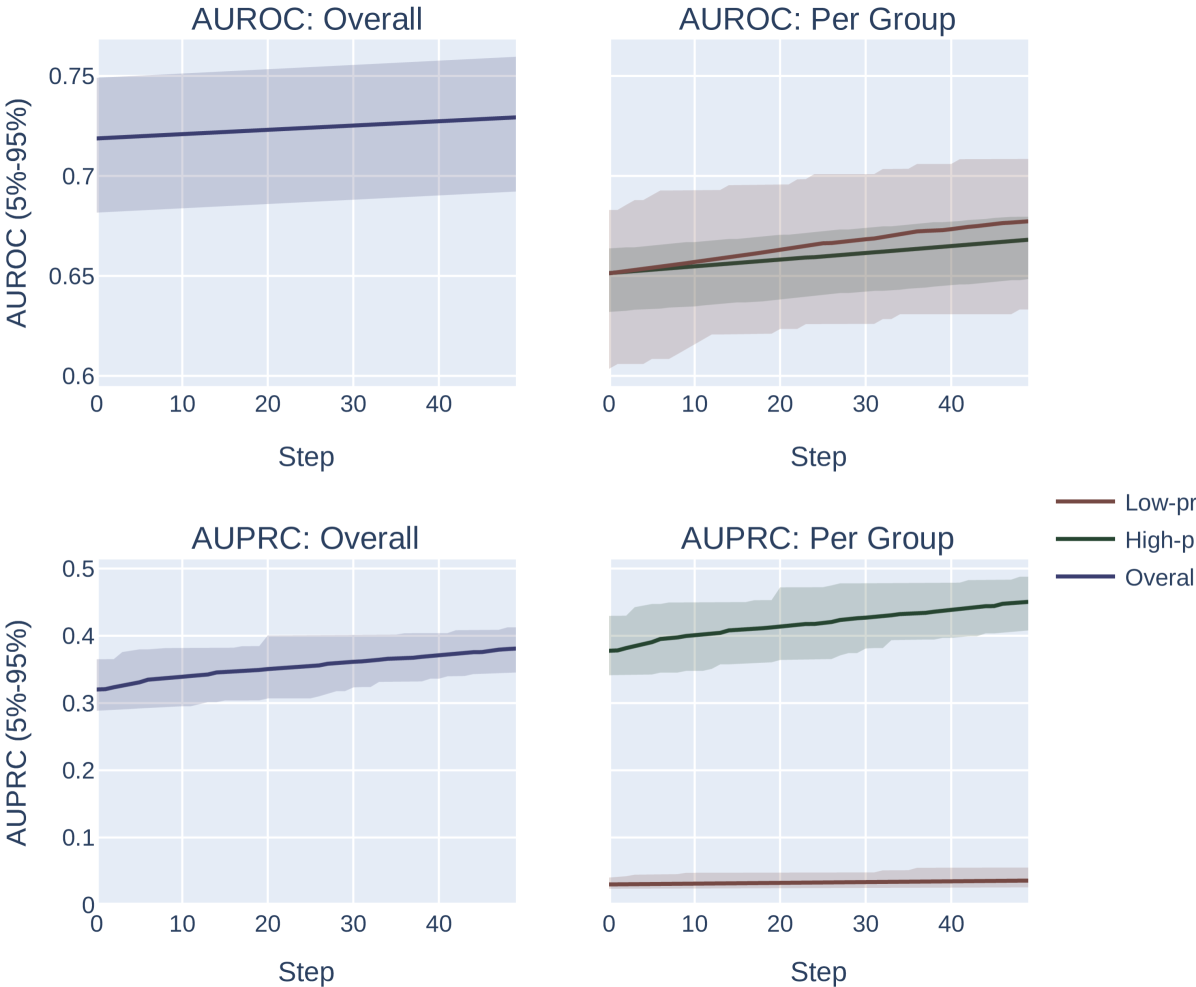
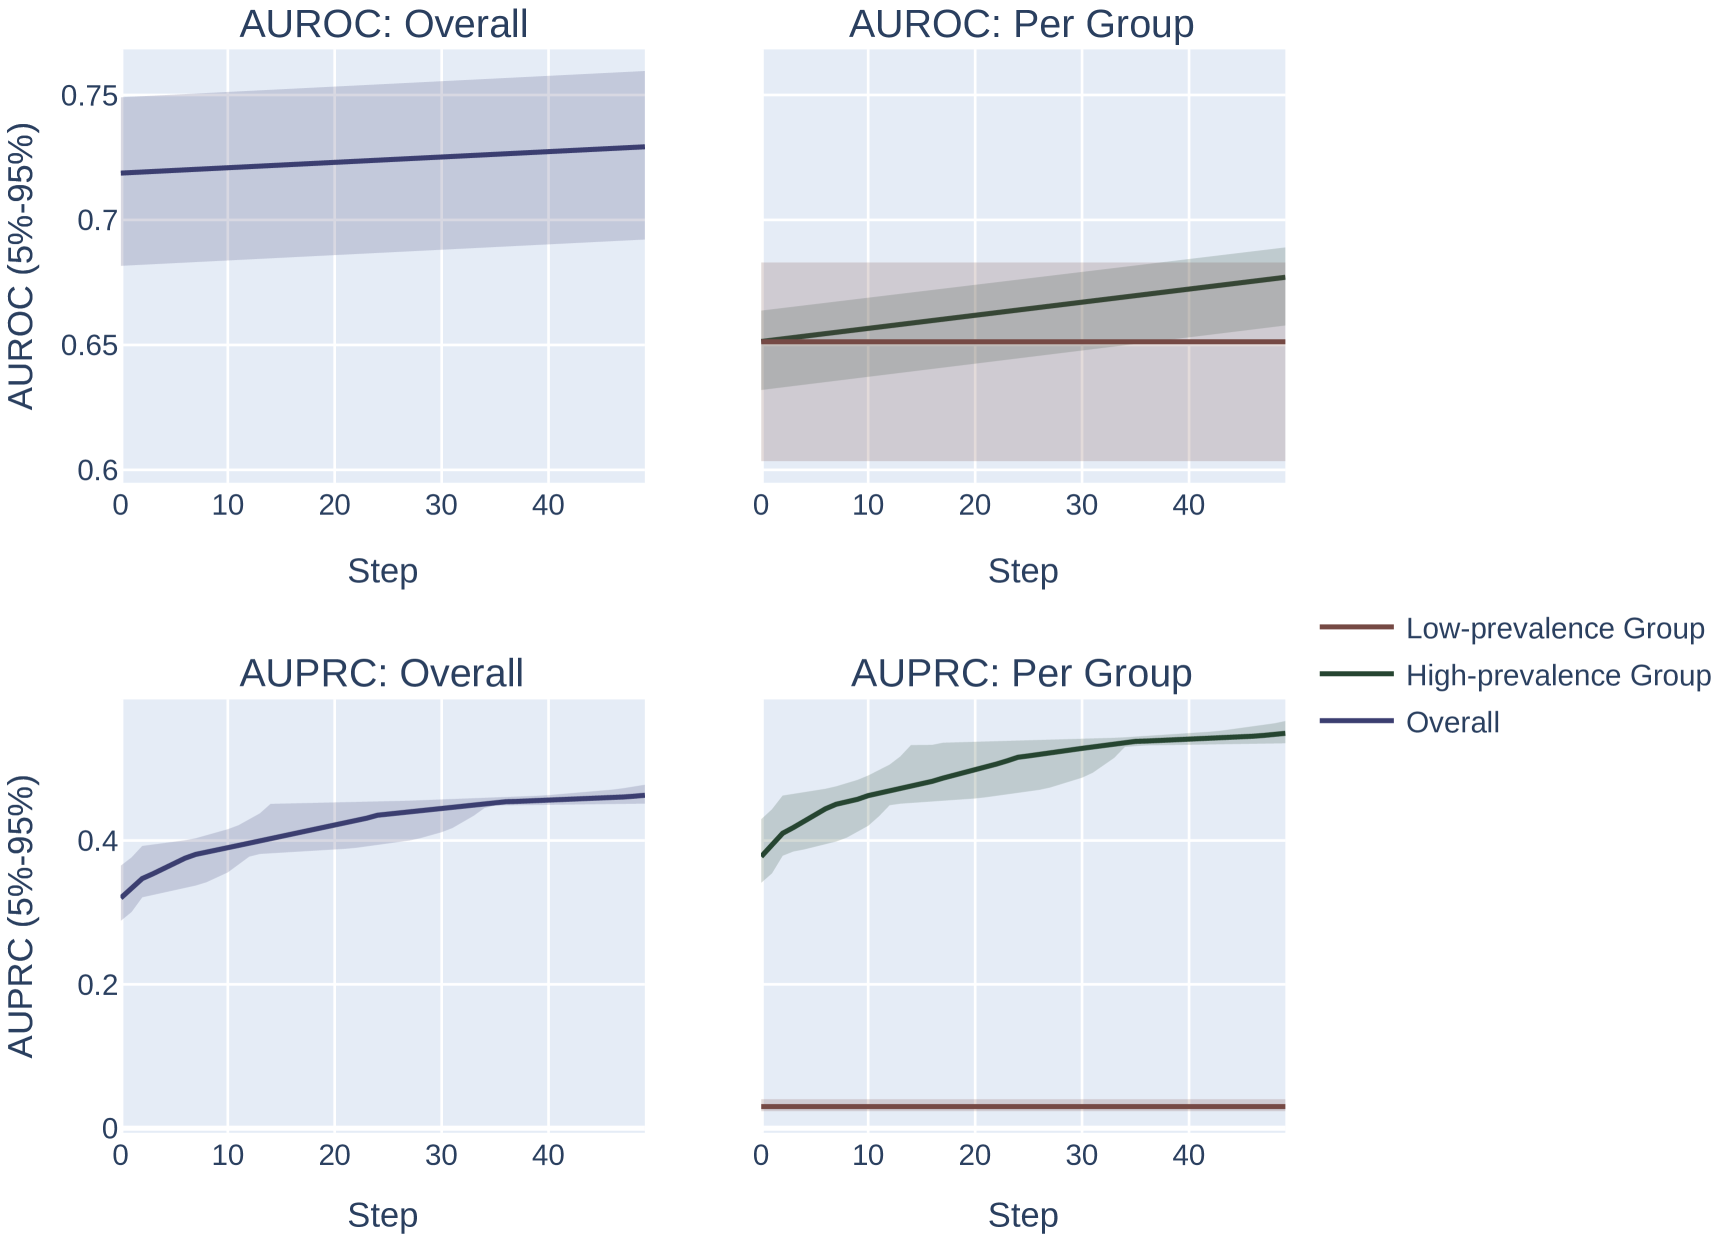
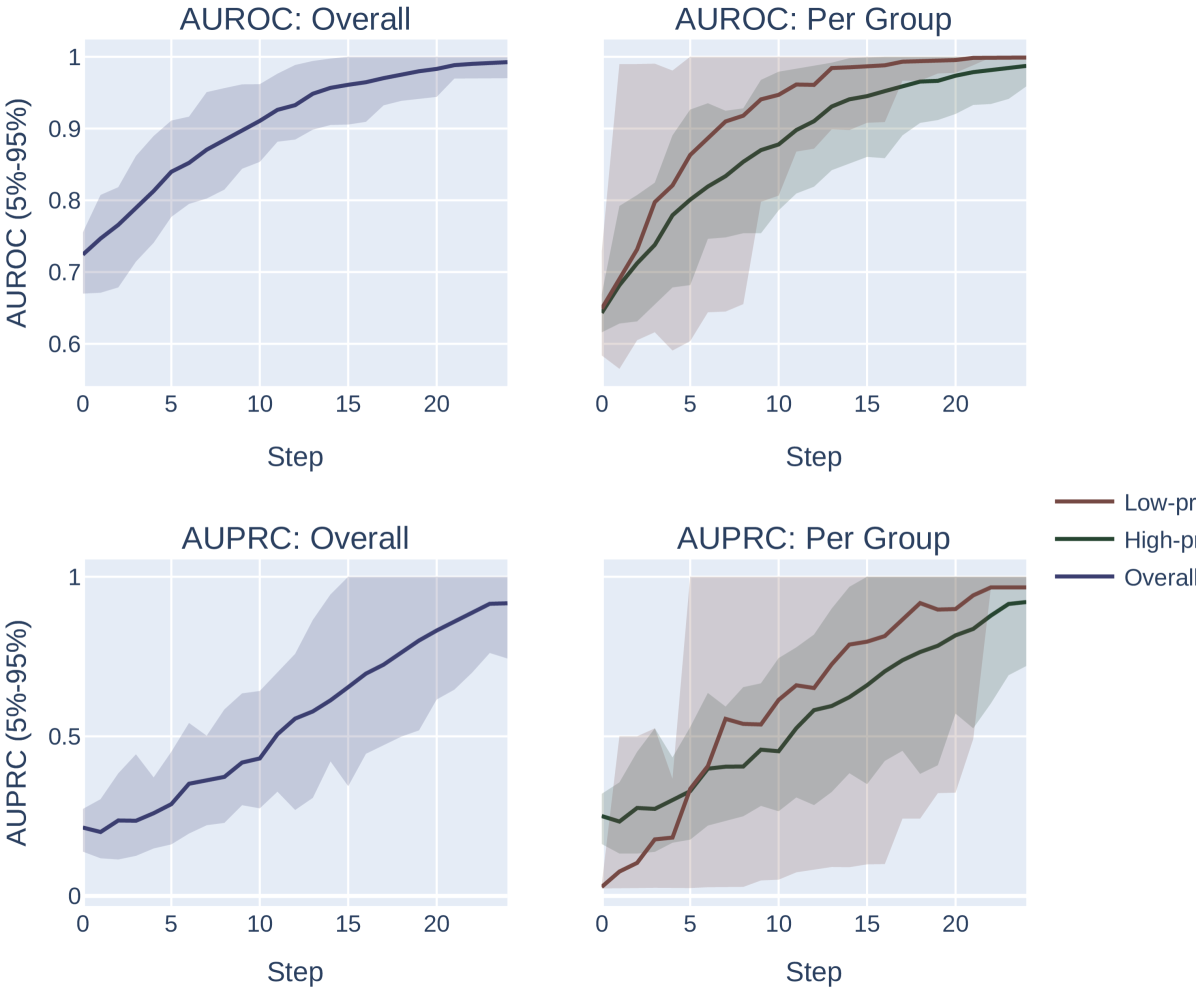
实验装置。
令 为二元标签, 为预测分数, 为子总体。 我们修复和。 我们对每个组的数据集进行采样,使得(附录图5中还描述了0.65的目标AUROC)。
我们的主要实验挑战是确定如何通过 AUROC 或 AUPRC 模拟“优化”或“选择”模型。 我们在这里探索两种方法。 首先,我们可以简单地纠正原子错误,从而在每次优化迭代中最大限度地提高 AUROC 或 AUPRC。 在我们的实验中,我们使用 并为此实验优化 步骤。 这是最容易分析的优化过程,但它是不现实的。 在实际的优化场景中,会立即进行较大的模型更改,模型将有机会降低某些区域的性能,以提高其他区域的性能。
接下来,我们描述了一个优化过程,该过程将所有(排序的)模型分数随机排列最多 3 个位置。 这具有随机调整所有模型分数的效果,并且可能会在某些随机排列下恶化模型性能,但会抵消低流行率亚组和高流行率亚组的完全相同的能力。 为了确保模型处于某种优化约束下(因此并不总能找到“完美”排列来同时最大化两个指标),我们允许模型在选择最佳选项之前仅对 15 种可能的排列进行采样。 这意味着系统将被迫进行优化权衡,其中的排列在其有限的集合中最有效地提高分数的正确区域。 我们使用 进行这些实验,并优化 总步骤。
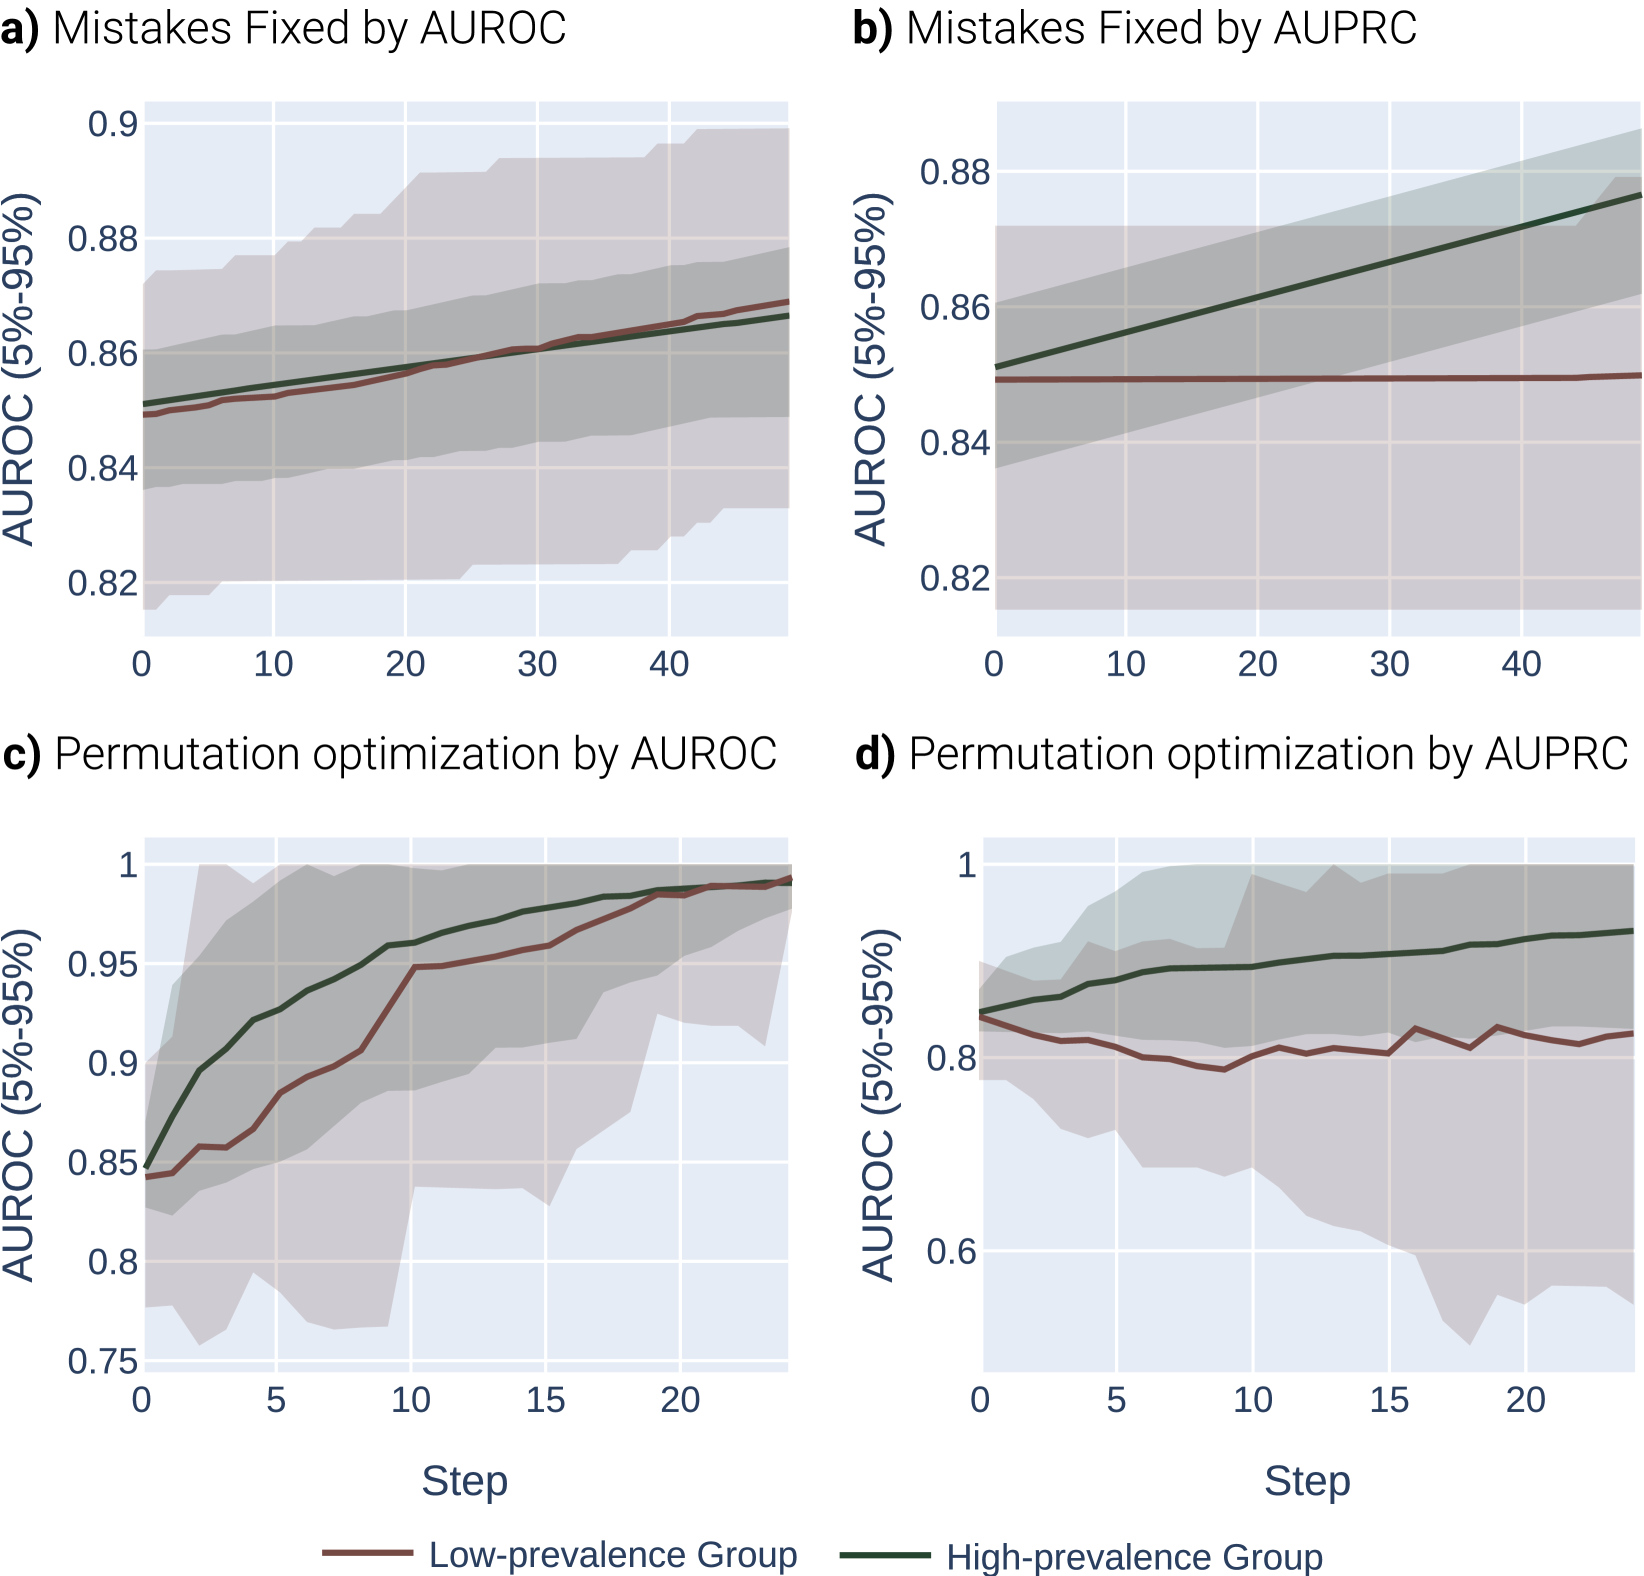
结果。
3.2现实世界的实验验证
为了证明我们的发现对现实世界的普遍性,我们在公平性文献 中的四个常见数据集上评估了由 AUROC 和 AUPRC 选择引起的公平性差距(Zhang 等人,2018;Fabris 等人,2022;Lahoti 等人, 2020)。
数据集。
我们使用以下四个表格二元分类数据集:adult (Asuncion & Newman, 2007)、compas (Angwin 等人, 2022 )、lsac (Wightman, 1998) 和 mimic (Johnson 等人, 2016) 。 在每个数据集中,我们将性别和种族视为敏感属性。 为了模仿我们定理的设置,我们在训练和测试期间通过敏感属性平衡每个数据集,通过对多数组进行随机二次采样。 有关每个数据集的更多详细信息以及预处理步骤,请参阅附录G。
实验装置。
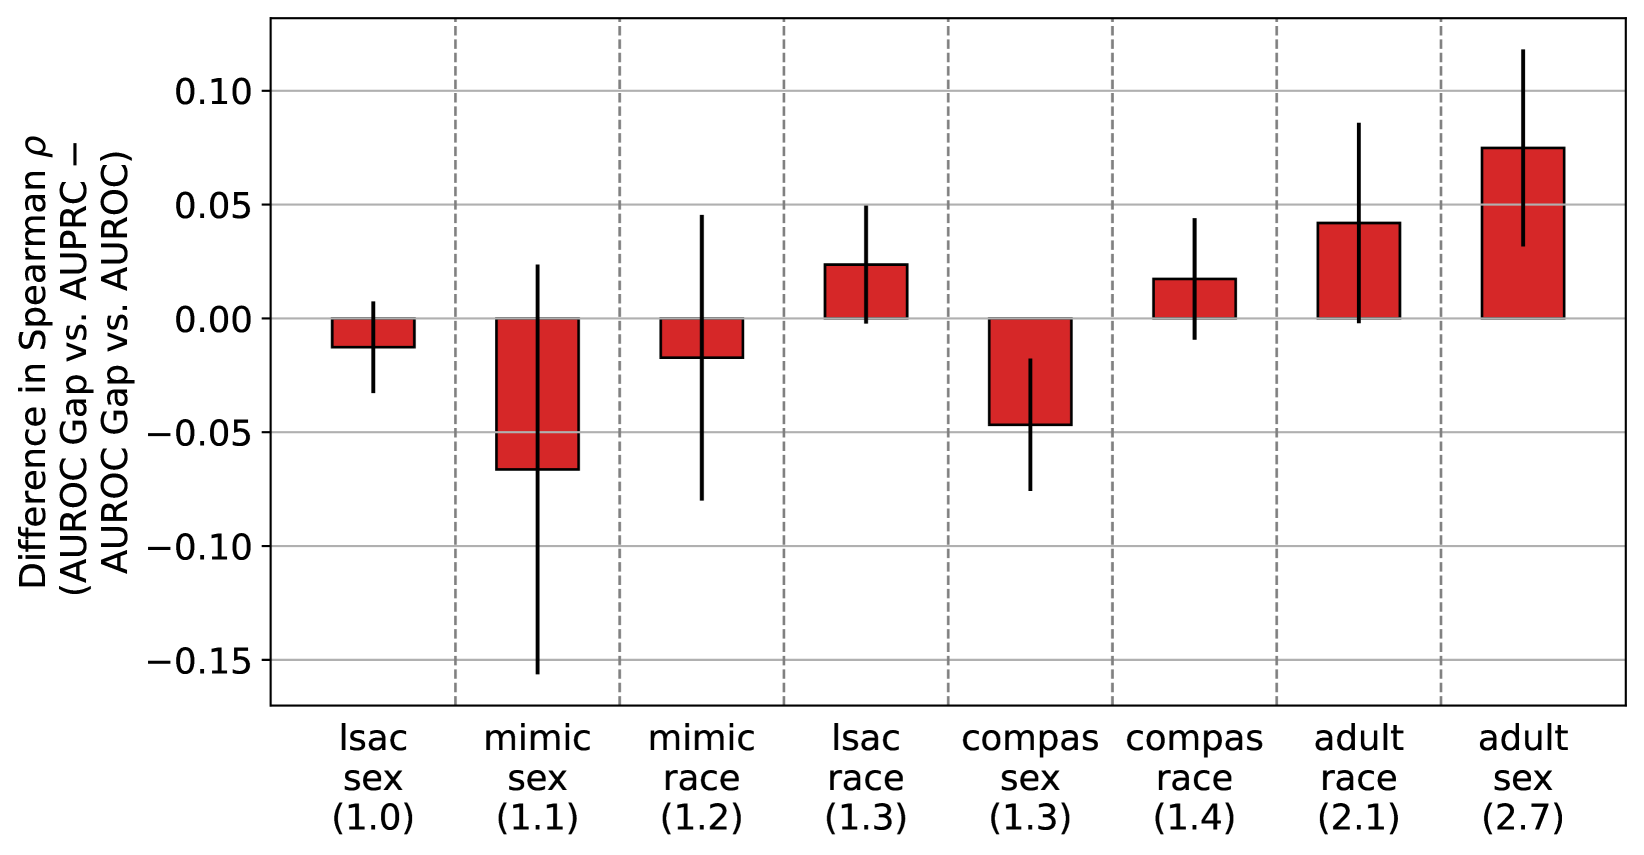
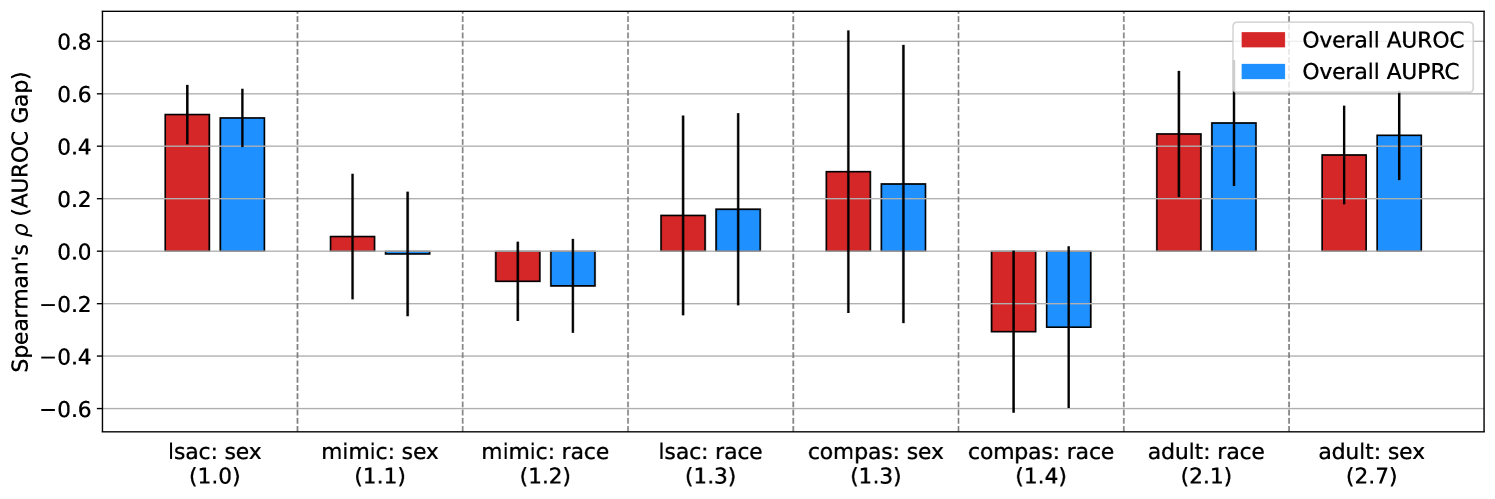
我们在每个数据集上训练 XGBoost 模型(Chen & Guestrin,2016)。 对于每项任务,我们迭代每组权重的网格,以创建一组有利于不同组的多样化模型。 对于每个任务设置和每组权重,我们进行 50 次运行的随机超参数搜索(Bergstra & Bengio,2012)。 我们评估验证集的整体 AUROC 和 AUPRC。 我们还评估了组间测试集 AUROC 差距和 AUPRC 差距,其中差距定义为较高患病率组的指标值减去较低患病率组的值。 根据我们的定理,我们的假设是,总体 AUPRC 与签名 AUROC 差距的相关性应该比总体 AUROC 更显着,这表明它更有利于患病率较高的群体,特别是当各组之间的患病率比率较高时。 为了检验这一假设,我们评估了这些量之间的斯皮尔曼相关系数。 我们使用不同的随机数据分割重复此实验 5 次,以获得 95% 的置信区间。
结果。
在图 3 中,我们绘制了 AUROC 差距与总体 AUPRC 以及 AUROC 差距与总体 AUROC 的 Spearman 相关系数的差异。 我们在患病率较低的数据集中观察到混合结果。 在患病率较高的数据集中,我们发现总体 AUPRC 与 AUROC 差距的正相关性高于总体 AUROC,表明 AUPRC 更偏向于较高患病率群体。 我们强调,在这些现实世界数据集中观察到的患病率远低于我们的合成实验中使用的 5 的比率,这可能是观察到的轻微影响的原因。 要查看这些实验的原始结果,请参阅附录图 7。
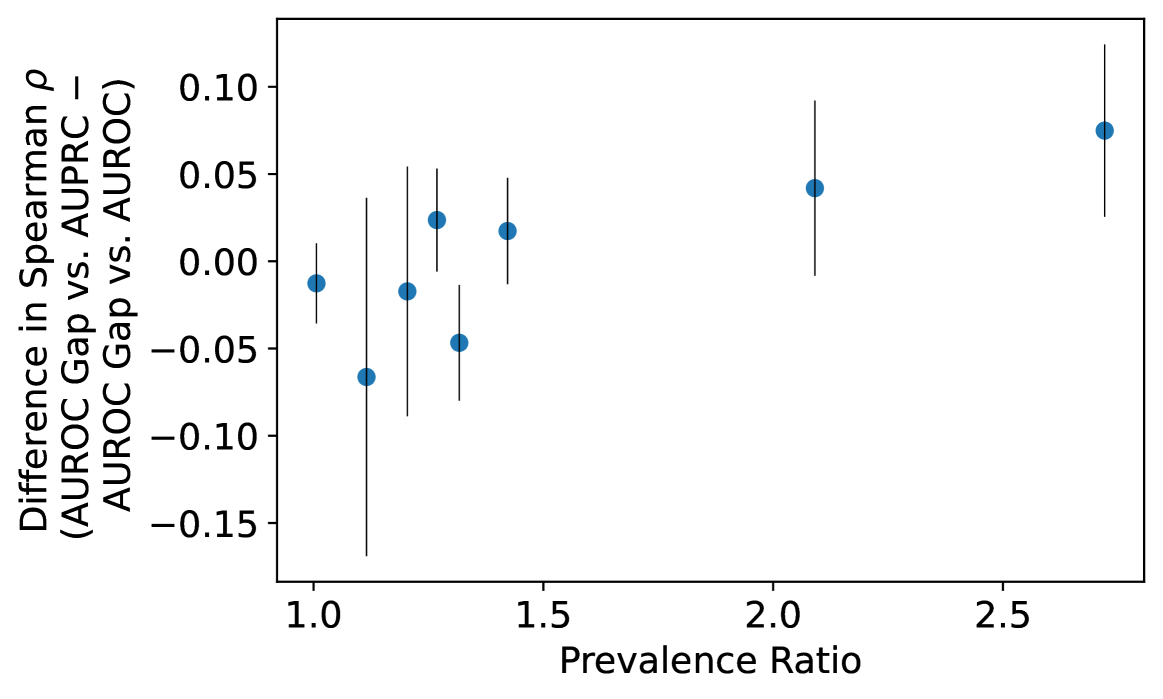
接下来,在附录图 8 中,我们绘制了 Spearman 的 与图 3 之间的差异与患病率差距。 我们发现两者之间存在统计上显着的相关性(Spearman 的 = 0.714,p = 0.047)。 因此,虽然由于这些数据集中的患病率差异有限,我们检测患病率介导的 AUPRC 偏差放大效应的能力受到限制,但我们仍然观察到低患病率组和高患病率组之间的患病率不匹配程度与数量之间存在很强的正相关性。与 AUROC 相比,AUPRC 更倾向于高患病率群体。 换句话说,我们的结果表明,在这些公平性数据集和属性中,随着患病率差异变得更加极端,我们观察到 AUPRC 引入算法偏差的程度在统计上显着相应增加,这完全符合定理 3 建议。
4 如果不是因为类别不平衡,那么什么时候应该我们使用AUPRC还是AUROC?
在第 2 和 3 节中,我们已经证明 AUPRC 在类别不平衡的情况下并不具有普遍优越性(相反,它只是优先优化高分区域而不是低分区域)地区),并且在亚组患病率不同的环境中,它还对模型的公平性构成严重风险。 有鉴于此,我们应该如何修改声明1以反映我们实际上何时应该使用AUPRC而不是AUROC,反之亦然?
在本节中,我们将探讨这个问题,并提供有关指标选择的实用指导。 我们以现有的理论结果为基础,认为使用 AUROC 或 AUPRC 作为评估二元分类模型的指标的决定与模型运行的特定环境密切相关,包括误报与漏报的相对影响以及部署设置中计划的模型工作流程。 为了证明这一点,我们回到图 1 中首先描述的四个示例问题:
对于上下文无关的模型评估,请使用 AUROC:
对于在特定部署环境之外进行的模型评估(其中错误的差异成本未定义),公正地评估整个模型输出空间的改进的指标的必要性变得至关重要。 如图1a所示,在此设置中,由于事先不知道感兴趣的样本将位于输出空间中的何处,也不知道特定的成本比率,因此应同等优先考虑纠正任何模型错误到任何其他人。 这种场景本质上有利于 AUROC,因为它能够统一考虑每次修正,从而提供对模型性能的全面评估,而不管决策阈值如何。
对于误报成本较高的部署场景,请使用 AUROC:
在假阴性后果特别严重的应用中,例如癌症等危重疾病的早期筛查(参见图1c),所使用模型的主要重点是确保尽可能少地漏掉阳性样本。 这相当于优先考虑模型召回。 在这种情况下,要纠正的最重要的错误实际上是在较低分数阈值下发生的错误,因为高分错误不会改变部署设置中遗漏的正样本,因为所选阈值可能较低。 此行为与 AUPRC 优先级相反,表明在这种情况下,AUROC 应优先于 AUPRC。 这种选择将更好地确保减少假阴性,从而提高模型检测所有可能疾病实例的能力。
对于大量人口中的道德资源分配,请使用 AUROC:
当面临在广大人群中道德地分配稀缺资源的挑战时,需要在亚群体之间进行公平的利益分配(如图1d所示),避免优先考虑有选择地有利于某一亚群体的模型改进至关重要。 由于 AUPRC 将选择性地针对高分区域,因此存在过度偏向高患病率亚人群的风险,如定理 3 以及图 2 和 3 所示。 尽管在这个资源分配问题中,高分区域与低分区域相比具有选择性重要性,但在这个问题中,我们必须对所有子群体进行同等优先级的事实意味着 AUPRC 的全局偏好是站不住脚的,因为它可能会引起偏差。 因此,如图 1d 所示,在这种情况下我们应该更喜欢 AUROC,因为它将确保各组之间的偏好一致,即使它会优先考虑每个组内的低分和高分区域。
为了减少高成本、单组干预优先级或信息检索设置中的误报,请使用 AUPRC:
在与假阳性相关的成本显着超过假阴性的情况下,不存在公平问题,例如从片段库中选择候选分子进行药物开发试验,只有最有希望的分子才会进行昂贵的实验验证(图1e)——选择的指标应该有助于减少高分误报。 这就需要重点纠正高分错误,而 AUROC 可能并不理想,因为它对整个分数范围内的错误进行统一处理,可能会掩盖关键高风险决策的改进。
5 如果在类别不平衡的情况下 AUPRC 并不比 AUROC 更好,我们为什么这么认为?
声明 1 指出“在类别不平衡的情况下,AUPRC 比 AUROC 更好”在文献中广泛存在。 通过手动文献检索和对超过 150 万篇 arXiv 论文的自动检索(有关方法,请参阅附录 H),我们观察到 128 篇出版物提出了这一主张。 我们分析这些论文来回答以下两个关键问题:(1)这种不正确的说法如何在机器学习中变得如此普遍;(2)这种说法是否导致了在高影响力环境中评估指标的不当使用?
5.1 结论 1:这种说法通常是在没有注明出处或出处不当的情况下提出的。
这种说法经常被提及而没有任何引用。
在我们发现的 128 篇论文中,有 31 篇没有相关引用(Liu 等人,2023;Randl 等人,2023;Tusfiqur 等人,2022;Piermarini 等人,2023;Zhang & Bondell,2018 ; Torfi 等人, 2022; Wu 等人, 2020; Navarro 等人, 2022; Wagner 等人, 2023; Herbach, 2021; Si & Roberts, 2021; Narayanan 等人, 2022; Rayhan 等人, 2017; Yang 等人, 2022a, b; Harer 等人, 2018; Lee 等人, 2020; Zavrtanik 等人, 2021; Rezvani 等人, 2021; Prapas 等人, 2023; Thambawita 等人, 2020; Vijayan 等人, 2017; Brophy & Lowd , 2020; Lyu 等人, 2021; Chakraborty 等人, 2023; Rajabi & He, 2021; Kim 等人, 2022; Kiran 等人, 2018; Mousavian 等人, 2016; Rohani & Eslahchi, 2019; Rao 等人, 2022 )。 这些论文发表在 arXiv、Nature Scientific Reports、ICCV、ECCV 和 Bioinformatics 等平台上。 这不仅反映了人们对这一主张的普遍信念,而且还表明,在今天的机器学习中,我们可能过于自在地做出看似“正确”的断言,而没有适当的归因。
这种说法经常被归因于没有提出这种说法的论文。
在引用该主张并引用该主张来源的 97 篇文章中,有 39 篇 没有引用任何首先提出该主张的论文 (Yang 等人,2015;Li 等人, 2020; Kyono 等人, 2018; Seo 等人, 2021; Hong 等人, 2019; Hagedoorn & Spanakis, 2017; Babaei 等人, 2021; Zou 等人, 2022; Mangolin 等人, 2022; Mosteiro 等人, 2021; Showalter & Wu, 2019; Cranmer & Desmarais, 2016; Bryan & Moriano, 2023; 张 等人, 2017; Domingues 等人, 2020; Shukla & Marlin, 2019; Blevins 等人, 2021; Hsu 等人, 2020; Smith 等人, 2023; Chu 等人, 2018; Deshwar 等人, 2015; Mongia 等人, 2021; Rubin 等人, 2012; Ahmed & Courville, 2020; Kong 等人, 2021; Shukla & Marlin, 2018; Ma 等人, 2022;雷巴等人,2015;Newby 等人,2022;Ando & Huang,2017;Stolman 等人,2022;Won 等人,2019;Stephenson 等人,2022;Srivastava 等人,2019;Karadzhov 等人,2022 ; Vens 等人, 2008; López 等人, 2013; Hall 等人, 2023; Goyal & Khiari, 2020)。 总共引用了 13 个来源,既没有引用也没有争论这一说法(Davis & Goadrich, 2006; Branco 等人, 2016; Provost & Fawcett, 1997; Sokolova & Lapalme, 2009; Wahid-Ul-Ashraf 等人, 2019; Ezzat 等人, 2017; Burez & Van den Poel, 2009; Flach 等人, 2011; Krawczyk, 2016; He & Garcia, 2009; LCT14558, 2017; Lobo 等人, 2008)。 最常见的是,论文错误地将这一说法归因于 Davis & Goadrich (2006),该说法被引用为该说法的来源 47 次。 虽然 Davis & Goadrich (2006) 对 ROC 和 PR 曲线提出了许多有趣且有意义的主张,并且 确实认为在类别不平衡的情况下,精确召回曲线比 ROC 提供更多信息它从未断言在类别不平衡的情况下,PR 曲线下的区域应优先于 ROC 下的区域。 它提到了在这种情况下使用 AUPRC 来代替 AUROC 或作为 AUROC 的补充,并在这些参考文献中引用了一篇后来被重新发表为 (Goadrich 等人,2006) 的论文,它确实提出了这一主张,但(Davis & Goadrich,2006)本身并没有声明是否应该以这种方式优先考虑 AUPRC,即使是通过代理那些先前的参考文献。 尽管如此,这一说法仍获得如此多的引用量,这一事实反映了我们今天在机器学习领域的科学论述的准确性。
与这一主张相关的论点经常过度概括该主张的适用性,或者由于度量优越性的出现而不是真正的度量效用而产生偏见。
如 4 节所述,在现实世界的设置中,AUPRC 比 AUROC 更符合现实世界的使用情况(例如,在单组中,top-检索设置)。 然而,声明 1 通常是关于所有具有类别不平衡的设置的声明。 考虑到这种过度概括,毫不奇怪的是,当在文献中使用权利要求1时,许多支持该主张的论点同样过度概括,超出了它们适当的情况。 例如,诸如“精确召回曲线可以提供更多部署指标信息”之类的说法经常被用来证明为什么 AUPRC 应该在所有类别不平衡的情况下使用,而不仅仅是在相关部署指标最直接相关的情况下使用与 PR 曲线。 支持声明 1 的另一类论点可以简化为这样的论点:在类别不平衡的情况下,指标 AUROC 很差,因为它产生的分数高得令人误解。 虽然这一论点可以反映 AUROC 通信价值的有意义的限制,但有关单例度量结果的评论(而不是通过度量值进行模型比较)本质上与模型评估的目标正交。 换句话说,对于模型评估而言,重要的不是给定指标有多高,而是该指标以正确的方式有意义地捕获模型的正确改进的程度。 有关我们在文献中观察到的论点及其来源的完整细分,请参阅附录表 2 和 3。
5.2 调查结果 2:声明 1 导致在各种高影响力环境和高影响力出版场所中不恰当地使用评估
我们发现,声明 1 已被用来证明在各种环境中使用 AUPRC 的合理性,其中 AUROC 实际上是一种优越的评估指标,在包括医疗保健和安全在内的高影响领域,跨高影响会议场地包括 NeurIPS、AAAI、Cancer Cell、Nature Scientific Reports、Briefings in Bioinformatics 和 Critical Care Medicine 等。 这里涉及的许多论文已被多次引用,进一步强调了这些来源中错误的度量选择可能产生的潜在负面影响。 这些来源包括以下作品:(Wagner 等人, 2023; Yuan 等人, 2015; Lim & van der Schaar, 2018; Leisman, 2018; Cho 等人, 2021; Kyono 等人, 2018; Yang 等人, 2022b; Meister 等人, 2022; Mosteiro 等人, 2021; Hashemi 等人, 2018; Ozyegen 等人, 2022; Thambawita 等人, 2020; Hsu 等人, 2020; Choi 等人, 2018; Tiulpin 等人, 2019 ; Lopez-Martinez 等人, 2022; 龚等人, 2021; Moor 等人, 2019; 丁等人, 2018).
这些作品的代表性示例是 Wagner 等人 (2023),其中作者使用 ML 方法从医学成像数据预测结直肠癌状态。 他们为他们的模型建议了以下工作流程“我们对该工作流程的预期临床用途如下……首先,患者前往诊所进行疑似 CRC 筛查或常规 CRC 筛查。 结肠镜检查显示可疑肿瘤,经过组织学评估后发现是腺癌……由于其高灵敏度,我们的算法可以作为过滤步骤,然后对 MSI 高预测病例进行肯定性测试。 应用基于人工智能的生物标志物预测将减少额外的测试负担,从而加快活检和高 MSI 状态的分子测定之间的步骤,从而在有需要时能够更早地进行免疫疗法治疗。”在此工作流程下,有两件事是明确的:(1) 在这种情况下,假阳性的成本相对低于假阴性,因为假阳性只会导致不必要的“MSI 高状态的分子测定”,而假阴性导致免疫疗法治疗的延迟,并且(2)出于这种成本比率的动机,该模型经过适当设计以实现(并实现)高灵敏度(又称为高灵敏度)。 记起)。
6 局限性和未来的工作
虽然我们的分析全面且令人信服,但仍有许多领域需要进一步改进和未来的工作。 首先,我们的理论发现可以改进并推广到限制较少的设置,考虑到目标任务的难度(子组之间可能有所不同)或不需要校准模型(在定理 3)。 此外,将我们的现实世界实验扩展到更公平的数据集,并确定更细致的方法来探讨度量选择对差异度量的影响,将显着加强这项工作。 最后,这些分析可以扩展到考虑其他指标,例如精确率-召回率-增益曲线下的面积(Flach&Kull,2015),净效益曲线下的面积( Talluri & Shete,2016;Pfohl 等人,2022),以及单阈值、以部署为中心的指标。
7结论
这项研究严格质疑了机器学习社区中普遍存在的假设,即在类别不平衡的环境中,AUPRC 是比 AUROC 更合适的评估指标。 我们的实证分析以及详尽的文献综述揭示了一些重要的发现,对这一信念提出了批判性的挑战。 特别是,我们表明,虽然优化 AUROC 相当于以无偏的方式最小化模型在正样本分数上的 FPR,但优化 AUPRC 相当于最小化 FPR,特别是模型输出较高分数相对于较低分数的区域。 我们进一步从理论和经验上证明,在合成和现实世界的公平数据集上,AUPRC 可以是一个明确的歧视性指标,因为它有利于患病率较高的子群体。
总之,我们的研究主张采用更加深思熟虑和情境感知的方法来选择机器学习中的评估指标。 这种范式转变有利于采取平衡和认真的衡量标准选择方法,对于推动该领域发展不仅技术上可靠而且公平公正的模型至关重要。
更广泛的影响和道德考虑
这篇研究论文挑战了关于 AUPRC 在类别不平衡的二元分类任务中优于 AUROC 的传统观点,并具有多种伦理含义和影响。
我们的分析表明,在某些机器学习应用中对 AUPRC 的偏好可能没有经验依据,并且可能会无意中放大算法偏差。 这就需要重新审视机器学习中的流行指标,尤其是在医疗保健、金融和刑事司法等高风险领域,在这些领域,有偏见的模型可能会产生深远的社会影响。 AUPRC 倾向于不成比例地偏爱正面标签流行率较高的模型,这可能会加剧现有的差异,强调对评估指标进行严格验证和审查的道德需要。
此外,我们使用大型语言模型进行文献分析,展示了一种审查和重新评估机器学习中长期存在的假设的新方法。 这种方法可以为该领域更全面、更稳健的科学研究开创先例,培养严谨的实证文化和道德意识。
我们工作的道德维度在于它对 ML 模型评估中指标选择的关注。 AUPRC 等指标有可能使模型性能偏向某些群体,这引发了人们对算法决策公平性的紧迫担忧。 当算法影响影响个人和社区的关键决策时,这一点尤其重要。
虽然我们在这项工作中使用 COMPAS 数据集进行累犯预测,但我们认识到累犯自动预测会带来许多社会问题(Dressel & Farid,2018)。 我们利用该数据集,因为它是公平性文献中常用的数据集,但不提倡以任何方式部署这些模型。
我们的研究有助于关于机器学习中度量行为的技术讨论,并作为针对不加批判地接受既定规范的警示故事。 它强调了仔细选择符合机器学习道德原则和公平目标的必要性,强调了这些选择在塑造社会成果和推进机器学习领域的深远影响。
参考
- Adler (2021) Adler, A. Using machine learning techniques to identify key risk factors for diabetes and undiagnosed diabetes, 2021.
- Afanasiev et al. (2021) Afanasiev, S., Smirnova, A., and Kotereva, D. Itsy bitsy spidernet: Fully connected residual network for fraud detection, 2021.
- Ahmed & Courville (2020) Ahmed, F. and Courville, A. Detecting semantic anomalies. Proceedings of the AAAI Conference on Artificial Intelligence, 34(04):3154–3162, Apr. 2020. doi: 10.1609/aaai.v34i04.5712. URL https://ojs.aaai.org/index.php/AAAI/article/view/5712.
- Albora & Zaccaria (2022) Albora, G. and Zaccaria, A. Machine learning to assess relatedness: the advantage of using firm-level data. Complexity, 2022, 2022.
- Alvarez et al. (2022) Alvarez, M., Verdier, J.-C., Nkashama, D. K., Frappier, M., Tardif, P.-M., and Kabanza, F. A revealing large-scale evaluation of unsupervised anomaly detection algorithms, 2022.
- Ando & Huang (2017) Ando, S. and Huang, C. Y. Deep over-sampling framework for classifying imbalanced data. In Machine Learning and Knowledge Discovery in Databases: European Conference, ECML PKDD 2017, Skopje, Macedonia, September 18–22, 2017, Proceedings, Part I 10, pp. 770–785. Springer, 2017.
- Angwin et al. (2022) Angwin, J., Larson, J., Mattu, S., and Kirchner, L. Machine bias. In Ethics of data and analytics, pp. 254–264. Auerbach Publications, 2022.
- Asuncion & Newman (2007) Asuncion, A. and Newman, D. Uci machine learning repository, 2007.
- Axelrod & Gomez-Bombarelli (2023) Axelrod, S. and Gomez-Bombarelli, R. Molecular machine learning with conformer ensembles. Machine Learning: Science and Technology, 4(3):035025, 2023.
- Babaei et al. (2021) Babaei, K., Chen, Z. Y., and Maul, T. Aegr: a simple approach to gradient reversal in autoencoders for network anomaly detection. Soft Computing, 25(24):15269–15280, 2021.
- Bach Nguyen et al. (2022) Bach Nguyen, V., Ghosh Dastidar, K., Granitzer, M., and Siblini, W. The importance of future information in credit card fraud detection. In Camps-Valls, G., Ruiz, F. J. R., and Valera, I. (eds.), Proceedings of The 25th International Conference on Artificial Intelligence and Statistics, volume 151 of Proceedings of Machine Learning Research, pp. 10067–10077. PMLR, 28–30 Mar 2022. URL https://proceedings.mlr.press/v151/bach-nguyen22a.html.
- Bergstra & Bengio (2012) Bergstra, J. and Bengio, Y. Random search for hyper-parameter optimization. Journal of machine learning research, 13(2), 2012.
- Bleakley et al. (2007) Bleakley, K., Biau, G., and Vert, J.-P. Supervised reconstruction of biological networks with local models. Bioinformatics, 23(13):i57–i65, 2007.
- Blevins et al. (2021) Blevins, D., Moriano, P., Bridges, R., Verma, M., Iannacone, M., and Hollifield, S. Time-based can intrusion detection benchmark. In Workshop on Automotive and Autonomous Vehicle Security (AutoSec), 2021.
- Boyd et al. (2013) Boyd, K., Eng, K. H., and Page, C. D. Area under the precision-recall curve: point estimates and confidence intervals. In Machine Learning and Knowledge Discovery in Databases: European Conference, ECML PKDD 2013, Prague, Czech Republic, September 23-27, 2013, Proceedings, Part III 13, pp. 451–466. Springer, 2013.
- Branco et al. (2016) Branco, P., Torgo, L., and Ribeiro, R. P. A survey of predictive modeling on imbalanced domains. ACM computing surveys (CSUR), 49(2):1–50, 2016.
- Brophy & Lowd (2020) Brophy, J. and Lowd, D. Eggs: A flexible approach to relational modeling of social network spam, 2020.
- Bryan & Moriano (2023) Bryan, J. and Moriano, P. Graph-based machine learning improves just-in-time defect prediction. Plos one, 18(4):e0284077, 2023.
- Budka et al. (2021) Budka, M., Ashraf, A. W. U., Bennett, M., Neville, S., and Mackrill, A. Deep multilabel cnn for forensic footwear impression descriptor identification. Applied Soft Computing, 109:107496, 2021.
- Burez & Van den Poel (2009) Burez, J. and Van den Poel, D. Handling class imbalance in customer churn prediction. Expert Systems with Applications, 36(3, Part 1):4626–4636, 2009. ISSN 0957-4174. doi: https://doi.org/10.1016/j.eswa.2008.05.027. URL https://www.sciencedirect.com/science/article/pii/S0957417408002121.
- Chakraborty et al. (2023) Chakraborty, N., Hasan, A., Liu, S., Ji, T., Liang, W., McPherson, D. L., and Driggs-Campbell, K. Structural attention-based recurrent variational autoencoder for highway vehicle anomaly detection. In Proceedings of the 2023 International Conference on Autonomous Agents and Multiagent Systems, AAMAS ’23, pp. 1125–1134, Richland, SC, 2023. International Foundation for Autonomous Agents and Multiagent Systems. ISBN 9781450394321.
- Chen & Guestrin (2016) Chen, T. and Guestrin, C. Xgboost: A scalable tree boosting system. In Proceedings of the 22nd acm sigkdd international conference on knowledge discovery and data mining, pp. 785–794, 2016.
- Cho et al. (2021) Cho, B. Y., Hermans, T., and Kuntz, A. Planning sensing sequences for subsurface 3d tumor mapping. In 2021 International Symposium on Medical Robotics (ISMR), pp. 1–7. IEEE, 2021.
- Choi et al. (2018) Choi, E., Xiao, C., Stewart, W. F., and Sun, J. Mime: Multilevel medical embedding of electronic health records for predictive healthcare. In Proceedings of the 32nd International Conference on Neural Information Processing Systems, NIPS’18, pp. 4552–4562, Red Hook, NY, USA, 2018. Curran Associates Inc.
- Chu et al. (2018) Chu, X., Lin, Y., Gao, J., Wang, J., Wang, Y., and Wang, L. Multi-label robust factorization autoencoder and its application in predicting drug-drug interactions, 2018.
- Cook & Ramadas (2020) Cook, J. and Ramadas, V. When to consult precision-recall curves. The Stata Journal, 20(1):131–148, 2020.
- Cranmer & Desmarais (2016) Cranmer, S. J. and Desmarais, B. A. What can we learn from predictive modeling?, 2016.
- Czakon (2022) Czakon, J. F1 Score vs ROC AUC vs Accuracy vs PR AUC: Which Evaluation Metric Should You Choose?, July 2022. URL https://neptune.ai/blog/f1-score-accuracy-roc-auc-pr-auc.
- Danesh Pazho et al. (2023) Danesh Pazho, A., Alinezhad Noghre, G., Rahimi Ardabili, B., Neff, C., and Tabkhi, H. CHAD: Charlotte Anomaly Dataset, pp. 50–66. Springer Nature Switzerland, 2023. ISBN 9783031314353. doi: 10.1007/978-3-031-31435-3˙4. URL http://dx.doi.org/10.1007/978-3-031-31435-3_4.
- Davis & Goadrich (2006) Davis, J. and Goadrich, M. The relationship between precision-recall and roc curves. In Proceedings of the 23rd International Conference on Machine Learning, ICML ’06, pp. 233–240, New York, NY, USA, 2006. Association for Computing Machinery. ISBN 1595933832. doi: 10.1145/1143844.1143874. URL https://doi.org/10.1145/1143844.1143874.
- Deng et al. (2023) Deng, J., Yang, Z., Wang, H., Ojima, I., Samaras, D., and Wang, F. Unraveling key elements underlying molecular property prediction: A systematic study, 2023.
- Deshwar et al. (2015) Deshwar, A. G., Vembu, S., Yung, C. K., Jang, G. H., Stein, L., and Morris, Q. Reconstructing subclonal composition and evolution from whole genome sequencing of tumors, 2015.
- Ding et al. (2018) Ding, D. Y., Simpson, C., Pfohl, S., Kale, D. C., Jung, K., and Shah, N. H. The effectiveness of multitask learning for phenotyping with electronic health records data. In BIOCOMPUTING 2019: Proceedings of the Pacific Symposium, pp. 18–29. World Scientific, 2018.
- Domingues et al. (2020) Domingues, R., Michiardi, P., Barlet, J., and Filippone, M. A comparative evaluation of novelty detection algorithms for discrete sequences. Artificial Intelligence Review, 53:3787–3812, 2020.
- Dressel & Farid (2018) Dressel, J. and Farid, H. The accuracy, fairness, and limits of predicting recidivism. Science advances, 4(1):eaao5580, 2018.
- Ezzat et al. (2017) Ezzat, A., Zhao, P., Wu, M., Li, X.-L., and Kwoh, C.-K. Drug-target interaction prediction with graph regularized matrix factorization. IEEE/ACM Transactions on Computational Biology and Bioinformatics, 14(3):646–656, 2017. doi: 10.1109/TCBB.2016.2530062.
- Fabris et al. (2022) Fabris, A., Messina, S., Silvello, G., and Susto, G. A. Algorithmic fairness datasets: the story so far. Data Mining and Knowledge Discovery, 36(6):2074–2152, 2022.
- Flach & Kull (2015) Flach, P. and Kull, M. Precision-recall-gain curves: Pr analysis done right. Advances in neural information processing systems, 28, 2015.
- Flach et al. (2011) Flach, P., Hernández-Orallo, J., and Ferri, C. A coherent interpretation of auc as a measure of aggregated classification performance. In Proceedings of the 28th International Conference on International Conference on Machine Learning, ICML’11, pp. 657–664, Madison, WI, USA, 2011. Omnipress. ISBN 9781450306195.
- Fu et al. (2021) Fu, Y., Wu, X.-B., Yang, Q., Brown, A. G., Feng, X., Ma, Q., and Li, S. Finding quasars behind the galactic plane. i. candidate selections with transfer learning. The Astrophysical Journal Supplement Series, 254(1):6, 2021.
- Garcin & Stéphan (2021) Garcin, M. and Stéphan, S. Credit scoring using neural networks and sure posterior probability calibration, 2021.
- Gaudreault et al. (2021) Gaudreault, J.-G., Branco, P., and Gama, J. An analysis of performance metrics for imbalanced classification. In International Conference on Discovery Science, pp. 67–77. Springer, 2021.
- Goadrich et al. (2006) Goadrich, M., Oliphant, L., and Shavlik, J. Gleaner: Creating ensembles of first-order clauses to improve recall-precision curves. Machine Learning, 64:231–261, 2006.
- Gong et al. (2021) Gong, H., Valido, A., Ingram, K. M., Fanti, G., Bhat, S., and Espelage, D. L. Abusive language detection in heterogeneous contexts: Dataset collection and the role of supervised attention. In Proceedings of the AAAI Conference on Artificial Intelligence, volume 35(17), pp. 14804–14812, 2021.
- Goyal & Khiari (2020) Goyal, A. and Khiari, J. Diversity-aware weighted majority vote classifier for imbalanced data. In 2020 International Joint Conference on Neural Networks (IJCNN), pp. 1–8, 2020. doi: 10.1109/IJCNN48605.2020.9207261.
- Hagedoorn & Spanakis (2017) Hagedoorn, T. R. and Spanakis, G. Massive open online courses temporal profiling for dropout prediction. In 2017 IEEE 29th International Conference on Tools with Artificial Intelligence (ICTAI), pp. 231–238. IEEE, 2017.
- Hall et al. (2023) Hall, M., Chern, B., Gustafson, L., Ventura, D., Kulkarni, H., Ross, C., and Usunier, N. Towards reliable assessments of demographic disparities in multi-label image classifiers, 2023.
- Harer et al. (2018) Harer, J. A., Kim, L. Y., Russell, R. L., Ozdemir, O., Kosta, L. R., Rangamani, A., Hamilton, L. H., Centeno, G. I., Key, J. R., Ellingwood, P. M., Antelman, E., Mackay, A., McConley, M. W., Opper, J. M., Chin, P., and Lazovich, T. Automated software vulnerability detection with machine learning, 2018.
- Harutyunyan et al. (2019) Harutyunyan, H., Khachatrian, H., Kale, D. C., Ver Steeg, G., and Galstyan, A. Multitask learning and benchmarking with clinical time series data. Scientific data, 6(1):96, 2019.
- Hashemi et al. (2018) Hashemi, S. R., Salehi, S. S. M., Erdogmus, D., Prabhu, S. P., Warfield, S. K., and Gholipour, A. Asymmetric loss functions and deep densely-connected networks for highly-imbalanced medical image segmentation: Application to multiple sclerosis lesion detection. IEEE Access, 7:1721–1735, 2018.
- He & Garcia (2009) He, H. and Garcia, E. A. Learning from imbalanced data. IEEE Transactions on Knowledge and Data Engineering, 21(9):1263–1284, 2009. doi: 10.1109/TKDE.2008.239.
- Herbach (2021) Herbach, U. Gene regulatory network inference from single-cell data using a self-consistent proteomic field, 2021.
- Hibshman & Weninger (2023) Hibshman, J. I. and Weninger, T. Inherent limits on topology-based link prediction, 2023.
- Hicks et al. (2022) Hicks, S. A., Strümke, I., Thambawita, V., Hammou, M., Riegler, M. A., Halvorsen, P., and Parasa, S. On evaluation metrics for medical applications of artificial intelligence. Scientific reports, 12(1):5979, 2022.
- Hiri et al. (2022) Hiri, K. D., Hren, M., and Curk, T. Nlp-based classification of software tools for metagenomics sequencing data analysis into edam semantic annotation, 2022.
- Hong et al. (2019) Hong, S., Xiao, C., Hoang, T. N., Ma, T., Li, H., and Sun, J. Rdpd: Rich data helps poor data via imitation. In 28th International Joint Conference on Artificial Intelligence, IJCAI 2019, pp. 5895–5901. International Joint Conferences on Artificial Intelligence, 2019.
- Hsu et al. (2020) Hsu, C.-C., Karnwal, S., Mullainathan, S., Obermeyer, Z., and Tan, C. Characterizing the value of information in medical notes. In Cohn, T., He, Y., and Liu, Y. (eds.), Findings of the Association for Computational Linguistics: EMNLP 2020, pp. 2062–2072, Online, November 2020. Association for Computational Linguistics. doi: 10.18653/v1/2020.findings-emnlp.187. URL https://aclanthology.org/2020.findings-emnlp.187.
- Isupova et al. (2017) Isupova, O., Kuzin, D., and Mihaylova, L. Learning methods for dynamic topic modeling in automated behavior analysis. IEEE transactions on neural networks and learning systems, 29(9):3980–3993, 2017.
- Johnson et al. (2016) Johnson, A. E., Pollard, T. J., Shen, L., Lehman, L.-w. H., Feng, M., Ghassemi, M., Moody, B., Szolovits, P., Anthony Celi, L., and Mark, R. G. Mimic-iii, a freely accessible critical care database. Scientific data, 3(1):1–9, 2016.
- Ju et al. (2018) Ju, C., Li, J., Wasti, B., and Guo, S. Semisupervised learning on heterogeneous graphs and its applications to facebook news feed, 2018.
- Karadzhov et al. (2022) Karadzhov, G., Stafford, T., and Vlachos, A. What makes you change your mind? an empirical investigation in online group decision-making conversations, 2022.
- Kim et al. (2022) Kim, M., Kim, J., Yu, J., and Choi, J. K. Unsupervised deep one-class classification with adaptive threshold based on training dynamics. In 2022 IEEE International Conference on Data Mining Workshops (ICDMW), pp. 39–46, 2022. doi: 10.1109/ICDMW58026.2022.00014.
- Kiran et al. (2018) Kiran, B. R., Thomas, D. M., and Parakkal, R. An overview of deep learning based methods for unsupervised and semi-supervised anomaly detection in videos. Journal of Imaging, 4(2), 2018. ISSN 2313-433X. doi: 10.3390/jimaging4020036. URL https://www.mdpi.com/2313-433X/4/2/36.
- Krawczyk (2016) Krawczyk, B. Learning from imbalanced data: open challenges and future directions. Progress in Artificial Intelligence, 5(4):221–232, 2016.
- Kulkarni et al. (2021) Kulkarni, V., Gawali, M., and Kharat, A. Key technology considerations in developing and deploying machine learning models in clinical radiology practice. JMIR Med Inform, 9(9):e28776, Sep 2021. ISSN 2291-9694. doi: 10.2196/28776. URL https://medinform.jmir.org/2021/9/e28776.
- Kyono et al. (2018) Kyono, T., Gilbert, F. J., and van der Schaar, M. Mammo: A deep learning solution for facilitating radiologist-machine collaboration in breast cancer diagnosis, 2018.
- Lahoti et al. (2020) Lahoti, P., Beutel, A., Chen, J., Lee, K., Prost, F., Thain, N., Wang, X., and Chi, E. Fairness without demographics through adversarially reweighted learning. Advances in neural information processing systems, 33:728–740, 2020.
- LCT14558 (2017) LCT14558. Imbalanced data & why you should NOT use ROC curve, March 2017. URL https://kaggle.com/code/lct14558/imbalanced-data-why-you-should-not-use-roc-curve.
- Lee et al. (2013) Lee, C., Nick, B., Brandes, U., and Cunningham, P. Link prediction with social vector clocks. In Proceedings of the 19th ACM SIGKDD international conference on Knowledge discovery and data mining, pp. 784–792, 2013.
- Lee et al. (2020) Lee, I.-T., Marwah, M., and Arlitt, M. Attention-based self-supervised feature learning for security data, 2020.
- Lei Ba et al. (2015) Lei Ba, J., Swersky, K., Fidler, S., et al. Predicting deep zero-shot convolutional neural networks using textual descriptions. In Proceedings of the IEEE international conference on computer vision, pp. 4247–4255, 2015.
- Leisman (2018) Leisman, D. E. Rare events in the icu: an emerging challenge in classification and prediction. Critical care medicine, 46(3):418–424, 2018.
- Li et al. (2022) Li, Q., Zhang, Y., Qiu, D., He, Y., Cao, L., and Woodland, P. C. Improving confidence estimation on out-of-domain data for end-to-end speech recognition. In ICASSP 2022-2022 IEEE International Conference on Acoustics, Speech and Signal Processing (ICASSP), pp. 6537–6541. IEEE, 2022.
- Li et al. (2020) Li, X., Al-Zaidy, R., Zhang, A., Baral, S., Bao, L., and Giles, C. L. Automating document classification with distant supervision to increase the efficiency of systematic reviews, 2020.
- Lichtnwalter & Chawla (2012) Lichtnwalter, R. and Chawla, N. V. Link prediction: fair and effective evaluation. In 2012 IEEE/ACM International Conference on Advances in Social Networks Analysis and Mining, pp. 376–383. IEEE, 2012.
- Lim & van der Schaar (2018) Lim, B. and van der Schaar, M. Disease-atlas: Navigating disease trajectories using deep learning. In Machine Learning for Healthcare Conference, pp. 137–160. PMLR, 2018.
- Liu et al. (2023) Liu, Y., Yang, D., Wang, Y., Liu, J., Liu, J., Boukerche, A., Sun, P., and Song, L. Generalized video anomaly event detection: Systematic taxonomy and comparison of deep models, 2023.
- Lobo et al. (2008) Lobo, J. M., Jiménez-Valverde, A., and Real, R. Auc: a misleading measure of the performance of predictive distribution models. Global Ecology and Biogeography, 17(2):145–151, 2008. doi: https://doi.org/10.1111/j.1466-8238.2007.00358.x. URL https://onlinelibrary.wiley.com/doi/abs/10.1111/j.1466-8238.2007.00358.x.
- Lopez-Martinez et al. (2022) Lopez-Martinez, D., Yakubovich, A., Seneviratne, M., Lelkes, A. D., Tyagi, A., Kemp, J., Steinberg, E., Downing, N. L., Li, R. C., Morse, K. E., Shah, N. H., and Chen, M.-J. Instability in clinical risk stratification models using deep learning. In Parziale, A., Agrawal, M., Joshi, S., Chen, I. Y., Tang, S., Oala, L., and Subbaswamy, A. (eds.), Proceedings of the 2nd Machine Learning for Health symposium, volume 193 of Proceedings of Machine Learning Research, pp. 552–565. PMLR, 28 Nov 2022. URL https://proceedings.mlr.press/v193/lopez-martinez22a.html.
- Lund et al. (2019) Lund, J., Armstrong, P., Fearn, W., Cowley, S., Hales, E., and Seppi, K. Cross-referencing using fine-grained topic modeling. In Burstein, J., Doran, C., and Solorio, T. (eds.), Proceedings of the 2019 Conference of the North American Chapter of the Association for Computational Linguistics: Human Language Technologies, Volume 1 (Long and Short Papers), pp. 3978–3987, Minneapolis, Minnesota, June 2019. Association for Computational Linguistics. doi: 10.18653/v1/N19-1399. URL https://aclanthology.org/N19-1399.
- Lyu et al. (2021) Lyu, Y., Rajbahadur, G. K., Lin, D., Chen, B., and Jiang, Z. M. J. Towards a consistent interpretation of aiops models. ACM Trans. Softw. Eng. Methodol., 31(1), nov 2021. ISSN 1049-331X. doi: 10.1145/3488269. URL https://doi.org/10.1145/3488269.
- López et al. (2013) López, V., Fernández, A., García, S., Palade, V., and Herrera, F. An insight into classification with imbalanced data: Empirical results and current trends on using data intrinsic characteristics. Information Sciences, 250:113–141, 2013. ISSN 0020-0255. doi: https://doi.org/10.1016/j.ins.2013.07.007. URL https://www.sciencedirect.com/science/article/pii/S0020025513005124.
- Ma et al. (2020) Ma, L., Zhang, C., Wang, Y., Ruan, W., Wang, J., Tang, W., Ma, X., Gao, X., and Gao, J. Concare: Personalized clinical feature embedding via capturing the healthcare context. In Proceedings of the AAAI Conference on Artificial Intelligence, volume 34(01), pp. 833–840, 2020.
- Ma et al. (2022) Ma, X., Chu, X., Wang, Y., Yu, H., Ma, L., Tang, W., and Zhao, J. Medfact: Modeling medical feature correlations in patient health representation learning via feature clustering, 2022.
- Mangolin et al. (2022) Mangolin, R. B., Pereira, R. M., Britto Jr, A. S., Silla Jr, C. N., Feltrim, V. D., Bertolini, D., and Costa, Y. M. A multimodal approach for multi-label movie genre classification. Multimedia Tools and Applications, 81(14):19071–19096, 2022.
- Markdahl et al. (2017) Markdahl, J., Colombo, N., Thunberg, J., and Gonçalves, J. Experimental design trade-offs for gene regulatory network inference: An in silico study of the yeast saccharomyces cerevisiae cell cycle. In 2017 IEEE 56th Annual Conference on Decision and Control (CDC), pp. 423–428. IEEE, 2017.
- Mayaki & Riveill (2022) Mayaki, M. Z. A. and Riveill, M. Multiple inputs neural networks for fraud detection. In 2022 International Conference on Machine Learning, Control, and Robotics (MLCR), pp. 8–13, 2022. doi: 10.1109/MLCR57210.2022.00011.
- Mazzanti (2023) Mazzanti, S. Why you should stop using the ROC curve, September 2023. URL https://towardsdatascience.com/why-you-should-stop-using-the-roc-curve-a46a9adc728.
- Mehboudi et al. (2022) Mehboudi, A., Singhal, S., and Sreenivasan, S. V. Squeeze flow of micro-droplets: convolutional neural network with trainable and tunable refinement, 2022.
- Meister et al. (2022) Meister, J. A., Nguyen, K. A., and Luo, Z. Audio feature ranking for sound-based covid-19 patient detection. In EPIA Conference on Artificial Intelligence, pp. 146–158. Springer, 2022.
- Miao & Zhu (2022) Miao, J. and Zhu, W. Precision–recall curve (prc) classification trees. Evolutionary intelligence, 15(3):1545–1569, 2022.
- Mongia et al. (2021) Mongia, A., Saha, S. K., Chouzenoux, E., and Majumdar, A. A computational approach to aid clinicians in selecting anti-viral drugs for covid-19 trials. Scientific reports, 11(1):9047, 2021.
- Moor et al. (2019) Moor, M., Horn, M., Rieck, B., Roqueiro, D., and Borgwardt, K. Early recognition of sepsis with gaussian process temporal convolutional networks and dynamic time warping. In Doshi-Velez, F., Fackler, J., Jung, K., Kale, D., Ranganath, R., Wallace, B., and Wiens, J. (eds.), Proceedings of the 4th Machine Learning for Healthcare Conference, volume 106 of Proceedings of Machine Learning Research, pp. 2–26. PMLR, 09–10 Aug 2019. URL https://proceedings.mlr.press/v106/moor19a.html.
- Mosquera et al. (2022) Mosquera, C., Ferrer, L., Milone, D., Luna, D., and Ferrante, E. Impact of class imbalance on chest x-ray classifiers: towards better evaluation practices for discrimination and calibration performance, 2022.
- Mosteiro et al. (2021) Mosteiro, P., Rijcken, E., Zervanou, K., Kaymak, U., Scheepers, F., and Spruit, M. Machine learning for violence risk assessment using dutch clinical notes. Journal of Artificial Intelligence for Medical Sciences, 2(1-2):44–54, 2021.
- Mousavian et al. (2016) Mousavian, Z., Khakabimamaghani, S., Kavousi, K., and Masoudi-Nejad, A. Drug–target interaction prediction from pssm based evolutionary information. Journal of pharmacological and toxicological methods, 78:42–51, 2016.
- Muthukrishna et al. (2019) Muthukrishna, D., Narayan, G., Mandel, K. S., Biswas, R., and Hložek, R. Rapid: early classification of explosive transients using deep learning. Publications of the Astronomical Society of the Pacific, 131(1005):118002, 2019.
- Narayanan et al. (2022) Narayanan, S., Maple, C., and Hooper, M. A point process model for rare event detection, 2022.
- Navarro et al. (2022) Navarro, J. M., Huet, A., and Rossi, D. Human readable network troubleshooting based on anomaly detection and feature scoring. Computer Networks, 219:109447, 2022.
- Newby et al. (2022) Newby, E., Tejeda Zañudo, J. G., and Albert, R. Structure-based approach to identifying small sets of driver nodes in biological networks. Chaos: An Interdisciplinary Journal of Nonlinear Science, 32(6):063102, 06 2022. ISSN 1054-1500. doi: 10.1063/5.0080843. URL https://doi.org/10.1063/5.0080843.
- Ntroumpogiannis et al. (2023) Ntroumpogiannis, A., Giannoulis, M., Myrtakis, N., Christophides, V., Simon, E., and Tsamardinos, I. A meta-level analysis of online anomaly detectors. The VLDB Journal, pp. 1–42, 2023.
- Ozenne et al. (2015) Ozenne, B., Subtil, F., and Maucort-Boulch, D. The precision–recall curve overcame the optimism of the receiver operating characteristic curve in rare diseases. Journal of clinical epidemiology, 68(8):855–859, 2015.
- Ozyegen et al. (2022) Ozyegen, O., Kabe, D., and Cevik, M. Word-level text highlighting of medical texts for telehealth services. Artificial Intelligence in Medicine, 127:102284, 2022.
- Pang et al. (2023) Pang, G., Shen, C., Jin, H., and van den Hengel, A. Deep weakly-supervised anomaly detection. In Proceedings of the 29th ACM SIGKDD Conference on Knowledge Discovery and Data Mining, KDD ’23, pp. 1795–1807, New York, NY, USA, 2023. Association for Computing Machinery. ISBN 9798400701030. doi: 10.1145/3580305.3599302. URL https://doi.org/10.1145/3580305.3599302.
- Pashchenko et al. (2018) Pashchenko, I. N., Sokolovsky, K. V., and Gavras, P. Machine learning search for variable stars. Monthly Notices of the Royal Astronomical Society, 475(2):2326–2343, 2018.
- Pfohl et al. (2022) Pfohl, S., Xu, Y., Foryciarz, A., Ignatiadis, N., Genkins, J., and Shah, N. Net benefit, calibration, threshold selection, and training objectives for algorithmic fairness in healthcare. In Proceedings of the 2022 ACM Conference on Fairness, Accountability, and Transparency, pp. 1039–1052, 2022.
- Piermarini et al. (2023) Piermarini, D., Sudoso, A. M., and Piccialli, V. Predicting municipalities in financial distress: a machine learning approach enhanced by domain expertise, 2023.
- Prapas et al. (2023) Prapas, I., Ahuja, A., Kondylatos, S., Karasante, I., Panagiotou, E., Alonso, L., Davalas, C., Michail, D., Carvalhais, N., and Papoutsis, I. Deep learning for global wildfire forecasting, 2023.
- Provost & Fawcett (1997) Provost, F. and Fawcett, T. Analysis and visualization of classifier performance with nonuniform class and cost distributions. In Proceedings of AAAI-97 Workshop on AI Approaches to Fraud Detection & Risk Management, pp. 57–63, 1997.
- Rajabi & He (2021) Rajabi, F. and He, J. S. Click-through rate prediction using graph neural networks and online learning, 2021.
- Randl et al. (2023) Randl, K., Armengol, N. L., Mondrejevski, L., and Miliou, I. Early prediction of the risk of icu mortality with deep federated learning. In 2023 IEEE 36th International Symposium on Computer-Based Medical Systems (CBMS), pp. 706–711. IEEE, 2023.
- Rao et al. (2022) Rao, S. X., Lanfranchi, C., Zhang, S., Han, Z., Zhang, Z., Min, W., Cheng, M., Shan, Y., Zhao, Y., and Zhang, C. Modelling graph dynamics in fraud detection with ”attention”, 2022.
- Rayhan et al. (2017) Rayhan, F., Ahmed, S., Shatabda, S., Farid, D. M., Mousavian, Z., Dehzangi, A., and Rahman, M. S. idti-esboost: identification of drug target interaction using evolutionary and structural features with boosting. Scientific reports, 7(1):17731, 2017.
- Rayhan et al. (2020) Rayhan, F., Ahmed, S., Mousavian, Z., Farid, D. M., and Shatabda, S. Frnet-dti: Deep convolutional neural network for drug-target interaction prediction. Heliyon, 6(3), 2020.
- Rezvani et al. (2021) Rezvani, R., Kouchaki, S., Nilforooshan, R., Sharp, D. J., and Barnaghi, P. Semi-supervised learning for identifying the likelihood of agitation in people with dementia, 2021.
- Rohani & Eslahchi (2019) Rohani, N. and Eslahchi, C. Drug-drug interaction predicting by neural network using integrated similarity. Scientific reports, 9(1):13645, 2019.
- Romero et al. (2022) Romero, M., Ramírez, O., Finke, J., and Rocha, C. Feature extraction with spectral clustering for gene function prediction using hierarchical multi-label classification. Applied Network Science, 7(1):28, 2022.
- Rosenberg (2022) Rosenberg, D. Imbalanced Data? Stop Using ROC-AUC and Use AUPRC Instead, June 2022. URL https://towardsdatascience.com/imbalanced-data-stop-using-roc-auc-and-use-auprc-instead-46af4910a494.
- Rubin et al. (2012) Rubin, T. N., Chambers, A., Smyth, P., and Steyvers, M. Statistical topic models for multi-label document classification. Machine learning, 88:157–208, 2012.
- Ruff et al. (2021) Ruff, L., Kauffmann, J. R., Vandermeulen, R. A., Montavon, G., Samek, W., Kloft, M., Dietterich, T. G., and Müller, K.-R. A unifying review of deep and shallow anomaly detection. Proceedings of the IEEE, 109(5):756–795, 2021. doi: 10.1109/JPROC.2021.3052449.
- Sahiner et al. (2017) Sahiner, B., Chen, W., Pezeshk, A., and Petrick, N. Comparison of two classifiers when the data sets are imbalanced: the power of the area under the precision-recall curve as the figure of merit versus the area under the ROC curve. In Kupinski, M. A. and Nishikawa, R. M. (eds.), Medical Imaging 2017: Image Perception, Observer Performance, and Technology Assessment, volume 10136, pp. 101360G. International Society for Optics and Photonics, SPIE, 2017. doi: 10.1117/12.2254742. URL https://doi.org/10.1117/12.2254742.
- Saito & Rehmsmeier (2015) Saito, T. and Rehmsmeier, M. The precision-recall plot is more informative than the roc plot when evaluating binary classifiers on imbalanced datasets. PloS one, 10(3):e0118432, 2015.
- Sarvari et al. (2021) Sarvari, H., Domeniconi, C., Prenkaj, B., and Stilo, G. Unsupervised boosting-based autoencoder ensembles for outlier detection. In Pacific-Asia Conference on Knowledge Discovery and Data Mining, pp. 91–103. Springer, 2021.
- Schwarz et al. (2021) Schwarz, K., Allam, A., Perez Gonzalez, N. A., and Krauthammer, M. Attentionddi: Siamese attention-based deep learning method for drug–drug interaction predictions. BMC bioinformatics, 22(1):1–19, 2021.
- Seo et al. (2021) Seo, E., Hutchinson, R. A., Fu, X., Li, C., Hallman, T. A., Kilbride, J., and Robinson, W. D. Stateconet: Statistical ecology neural networks for species distribution modeling. In Proceedings of the AAAI Conference on Artificial Intelligence, volume 35, pp. 513–521, 2021.
- Shen & Kursun (2021) Shen, H. and Kursun, E. Label augmentation via time-based knowledge distillation for financial anomaly detection, 2021.
- Showalter & Wu (2019) Showalter, S. and Wu, Z. Minimizing the societal cost of credit card fraud with limited and imbalanced data, 2019.
- Shukla & Marlin (2019) Shukla, S. N. and Marlin, B. Interpolation-prediction networks for irregularly sampled time series. In International Conference on Learning Representations, 2019. URL https://openreview.net/forum?id=r1efr3C9Ym.
- Shukla & Marlin (2018) Shukla, S. N. and Marlin, B. M. Modeling irregularly sampled clinical time series, 2018.
- Si & Roberts (2021) Si, Y. and Roberts, K. Three-level hierarchical transformer networks for long-sequence and multiple clinical documents classification, 2021.
- Silva et al. (2022) Silva, M. C. R., Siqueira, F. A., Tarrega, J. P. M., Beinotti, J. V. P., Nunes, A. S., de Mattos Gardini, M., da Silva, V. A. P., da Silva, N. F. F., and de Leon Ferreira de Carvalho, A. C. P. No pattern, no recognition: a survey about reproducibility and distortion issues of text clustering and topic modeling, 2022.
- Skarding et al. (2021) Skarding, J., Gabrys, B., and Musial, K. Foundations and modeling of dynamic networks using dynamic graph neural networks: A survey. IEEE Access, 9:79143–79168, 2021.
- Smith et al. (2023) Smith, A. L., Zheng, T., and Gelman, A. Prediction scoring of data-driven discoveries for reproducible research. Statistics and Computing, 33(1):11, 2023.
- Sokolova & Lapalme (2009) Sokolova, M. and Lapalme, G. A systematic analysis of performance measures for classification tasks. Information processing & management, 45(4):427–437, 2009.
- Srivastava et al. (2019) Srivastava, S., Namboodiri, V. P., and Prabhakar, T. V. Putworkbench: Analysing privacy in ai-intensive systems, 2019.
- Steinbuss & Böhm (2021) Steinbuss, G. and Böhm, K. Benchmarking unsupervised outlier detection with realistic synthetic data. ACM Trans. Knowl. Discov. Data, 15(4), apr 2021. ISSN 1556-4681. doi: 10.1145/3441453. URL https://doi.org/10.1145/3441453.
- Stephenson et al. (2022) Stephenson, O. L., Köhne, T., Zhan, E., Cahill, B. E., Yun, S.-H., Ross, Z. E., and Simons, M. Deep learning-based damage mapping with insar coherence time series. IEEE Transactions on Geoscience and Remote Sensing, 60:1–17, 2022. doi: 10.1109/TGRS.2021.3084209.
- Stolman et al. (2022) Stolman, A., Levy, C., Seshadhri, C., and Sharma, A. Classic graph structural features outperform factorization-based graph embedding methods on community labeling. In Proceedings of the 2022 SIAM International Conference on Data Mining (SDM), pp. 388–396. SIAM, 2022.
- Talluri & Shete (2016) Talluri, R. and Shete, S. Using the weighted area under the net benefit curve for decision curve analysis. BMC medical informatics and decision making, 16:1–9, 2016.
- Thambawita et al. (2020) Thambawita, V., Jha, D., Hammer, H. L., Johansen, H. D., Johansen, D., Halvorsen, P., and Riegler, M. A. An extensive study on cross-dataset bias and evaluation metrics interpretation for machine learning applied to gastrointestinal tract abnormality classification. ACM Transactions on Computing for Healthcare, 1(3):1–29, 2020.
- Tiulpin et al. (2019) Tiulpin, A., Klein, S., Bierma-Zeinstra, S. M., Thevenot, J., Rahtu, E., Meurs, J. v., Oei, E. H., and Saarakkala, S. Multimodal machine learning-based knee osteoarthritis progression prediction from plain radiographs and clinical data. Scientific reports, 9(1):20038, 2019.
- Torfi et al. (2022) Torfi, A., Fox, E. A., and Reddy, C. K. Differentially private synthetic medical data generation using convolutional gans. Information Sciences, 586:485–500, 2022.
- Tusfiqur et al. (2022) Tusfiqur, H. M., Nguyen, D. M. H., Truong, M. T. N., Nguyen, T. A., Nguyen, B. T., Barz, M., Profitlich, H.-J., Than, N. T. T., Le, N., Xie, P., and Sonntag, D. Drg-net: Interactive joint learning of multi-lesion segmentation and classification for diabetic retinopathy grading, 2022.
- Vens et al. (2008) Vens, C., Struyf, J., Schietgat, L., Džeroski, S., and Blockeel, H. Decision trees for hierarchical multi-label classification. Machine learning, 73:185–214, 2008.
- Vijayan et al. (2017) Vijayan, V., Critchlow, D., and Milenković, T. Alignment of dynamic networks. Bioinformatics, 33(14):i180–i189, 07 2017. ISSN 1367-4803. doi: 10.1093/bioinformatics/btx246. URL https://doi.org/10.1093/bioinformatics/btx246.
- Wagner et al. (2023) Wagner, S. J., Reisenbüchler, D., West, N. P., Niehues, J. M., Zhu, J., Foersch, S., Veldhuizen, G. P., Quirke, P., Grabsch, H. I., Brandt, P. A. v. d., Hutchins, G. G. A., Richman, S. D., Yuan, T., Langer, R., Jenniskens, J. C. A., Offermans, K., Mueller, W., Gray, R., Gruber, S. B., Greenson, J. K., Rennert, G., Bonner, J. D., Schmolze, D., Jonnagaddala, J., Hawkins, N. J., Ward, R. L., Morton, D., Seymour, M., Magill, L., Nowak, M., Hay, J., Koelzer, V. H., Church, D. N., Church, D., Domingo, E., Edwards, J., Glimelius, B., Gogenur, I., Harkin, A., Hay, J., Iveson, T., Jaeger, E., Kelly, C., Kerr, R., Maka, N., Morgan, H., Oien, K., Orange, C., Palles, C., Roxburgh, C., Sansom, O., Saunders, M., Tomlinson, I., Matek, C., Geppert, C., Peng, C., Zhi, C., Ouyang, X., James, J. A., Loughrey, M. B., Salto-Tellez, M., Brenner, H., Hoffmeister, M., Truhn, D., Schnabel, J. A., Boxberg, M., Peng, T., and Kather, J. N. Transformer-based biomarker prediction from colorectal cancer histology: A large-scale multicentric study, September 2023. ISSN 1535-6108, 1878-3686. URL https://www.cell.com/cancer-cell/abstract/S1535-6108(23)00278-7. Publisher: Elsevier.
- Wahid-Ul-Ashraf et al. (2019) Wahid-Ul-Ashraf, A., Budka, M., and Musial, K. How to predict social relationships — physics-inspired approach to link prediction. Physica A: Statistical Mechanics and its Applications, 523:1110–1129, 2019. ISSN 0378-4371. doi: https://doi.org/10.1016/j.physa.2019.04.246. URL https://www.sciencedirect.com/science/article/pii/S0378437119306193.
- Weiss & Tonella (2021) Weiss, M. and Tonella, P. Fail-safe execution of deep learning based systems through uncertainty monitoring. In 2021 14th IEEE conference on software testing, verification and validation (ICST), pp. 24–35. IEEE, 2021.
- Weiss & Tonella (2023) Weiss, M. and Tonella, P. Uncertainty quantification for deep neural networks: An empirical comparison and usage guidelines. Software Testing, Verification and Reliability, 33(6):e1840, 2023. doi: https://doi.org/10.1002/stvr.1840. URL https://onlinelibrary.wiley.com/doi/abs/10.1002/stvr.1840.
- Wightman (1998) Wightman, L. F. Lsac national longitudinal bar passage study. lsac research report series. 1998.
- Won et al. (2019) Won, M., Chun, S., and Serra, X. Toward interpretable music tagging with self-attention, 2019.
- Wu et al. (2020) Wu, P., Liu, J., Shi, Y., Sun, Y., Shao, F., Wu, Z., and Yang, Z. Not only look, but also listen: Learning multimodal violence detection under weak supervision. In Computer Vision–ECCV 2020: 16th European Conference, Glasgow, UK, August 23–28, 2020, Proceedings, Part XXX 16, pp. 322–339. Springer, 2020.
- Yang (2021) Yang, T. Deep auc maximization for medical image classification: Challenges and opportunities, 2021.
- Yang et al. (2022a) Yang, X., Yang, G., and Chu, J. The computational drug repositioning without negative sampling. IEEE/ACM Transactions on Computational Biology and Bioinformatics, 20(2):1506–1517, 2022a.
- Yang et al. (2015) Yang, Y., Lichtenwalter, R. N., and Chawla, N. V. Evaluating link prediction methods. Knowledge and Information Systems, 45:751–782, 2015.
- Yang et al. (2022b) Yang, Z.-Y., Ye, Z.-F., Xiao, Y.-J., Hsieh, C.-Y., and Zhang, S.-Y. Spldextratrees: robust machine learning approach for predicting kinase inhibitor resistance. Briefings in Bioinformatics, 23(3):bbac050, 2022b.
- Yuan et al. (2015) Yuan, Y., Su, W., and Zhu, M. Threshold-free measures for assessing the performance of medical screening tests. Frontiers in public health, 3:57, 2015.
- Zavrtanik et al. (2021) Zavrtanik, V., Kristan, M., and Skočaj, D. Draem-a discriminatively trained reconstruction embedding for surface anomaly detection. In Proceedings of the IEEE/CVF International Conference on Computer Vision, pp. 8330–8339, 2021.
- Zhang et al. (2018) Zhang, B. H., Lemoine, B., and Mitchell, M. Mitigating unwanted biases with adversarial learning. In Proceedings of the 2018 AAAI/ACM Conference on AI, Ethics, and Society, pp. 335–340, 2018.
- Zhang et al. (2017) Zhang, D., Fu, H., Han, J., Borji, A., and Li, X. A review of co-saliency detection technique: Fundamentals, applications, and challenges, 2017.
- Zhang et al. (2021) Zhang, W., Hisano, R., Ohnishi, T., and Mizuno, T. Nondiagonal mixture of dirichlet network distributions for analyzing a stock ownership network. In Complex Networks & Their Applications IX: Volume 1, Proceedings of the Ninth International Conference on Complex Networks and Their Applications COMPLEX NETWORKS 2020, pp. 75–86. Springer, 2021.
- Zhang & Bondell (2018) Zhang, Y. and Bondell, H. D. Variable Selection via Penalized Credible Regions with Dirichlet–Laplace Global-Local Shrinkage Priors. Bayesian Analysis, 13(3):823 – 844, 2018. doi: 10.1214/17-BA1076. URL https://doi.org/10.1214/17-BA1076.
- Zhou et al. (2020) Zhou, Q. M., Lu, Z., Brooke, R. J., Hudson, M. M., and Yuan, Y. Is the new model better? one metric says yes, but the other says no. which metric do i use?, 2020.
- Zou et al. (2022) Zou, Y., Jeong, J., Pemula, L., Zhang, D., and Dabeer, O. Spot-the-difference self-supervised pre-training for anomaly detection and segmentation. In European Conference on Computer Vision, pp. 392–408. Springer, 2022.
附录 A代码可用性
附录 B符号
让 表示一个模型,其中 为二元分类任务的输入域, 为输出域。 让随机变量描述输入样本的分布,并将随机变量定义为模型输出的分数在输入样本上的分布,令 为描述基础学习任务标签 的随机变量。 在整篇论文中,如果从上下文中可以清楚地看出,则可以省略。 我们偶尔也会使用符号 和 来分别反映以标签为 1 或 0 为条件的模型输出的条件分布:
令 为具有正标签的数据点的数量, 为具有负标签的数据点的数量。 此外,给定阈值,定义
最后,回忆一下
附录C定理证明1
在这里,我们证明定理1,它指出
请参阅1
证明。
回想一下 AUROC 和 AUPRC 如下:
但是,我们可以利用 进一步澄清这些,如下所示:
所以, & 。 为了进一步简化,我们通过贝叶斯规则扩展:
因此,
如预期的。 ∎
定理 1 的综合验证也可以在我们的公共代码中找到。
附录D定理证明2
在这里,我们证明定理2,它指出
请参阅2
证明。
假设有一个给定的、非空的原子错误集,这样,在不失一般性的情况下,。 假设我们通过复制模型 分配的分数,将 和 对调(即纠正错误 ,因此 和 ),构建了一个具有经验分布 和 的新模型 。
对于从原始分布 中提取的哪些阈值,在同一阈值下 的误报数量与 的误报数量不同? 对于任何阈值,修复错误不会改变阈值的误报数量,因为和 高于 。 对于任何阈值 ,该数字同样不会改变,因为 和 均低于 。 唯一会产生影响的 是 (回想一下,这是针对包含 的经验分布 的,并且通过原子错误的定义,中没有分数在和之间的样本)。 在中,仍然具有负标签,这意味着将有一个误报对应于大于的样本 > 除了所有分数大于 的分数之外。 但是,对于 ,样本已经交换,因此 ,因此在 对应的正分数阈值上,没有与样本 相对应的假阳性。 因此,当错误被纠正时,误报数量只会在阈值内减少1。
由于AUROC对所有阳性样本的误报率进行同等加权,并且误报率与误报数量成正比,这表明无论修复哪个原子错误,AUROC都会得到恒定的改进。 相比之下,由于 AUPRC 与模型的触发率成反比地对误报进行加权,因此它将提高与模型触发率的倒数直接线性相关的量,这意味着它有利于分数较高的错误,而不利于分数较低的错误。 ∎
定理 2 的综合经验验证也可以在我们的公共代码中找到。
附录E定理证明3
Lemma 1.
让模型 得到完美校准,并生成来自 和 的正样本和负样本的分数分布。 然后
证明。
由于该模型经过完美校准,我们有
因此,如所期望。 ∎
Lemma 2.
让模型 得到完美校准,并得出来自 和 的正样本和负样本的分数分布,总体分布由 给出>。 然后对于所有,。
请参阅3
证明。
给定定理 2,经过纠正后,会导致 AUPRC 最大改进的原子错误是在最大分数时发生的错误(因为这最小化了发射率,这是权重中的分母) AUPRC 术语)。 假设在阈值处,在抽取个样本的子组中发生高于分数的错误的概率至少为。 由于当我们改变子组 2 的患病率时,子组 1 的参数是固定的,因此 可以被视为相对于我们所采用的限制的常数。
但是,根据引理 2 以及 针对子组 2 进行了完美校准的事实,我们知道 输出样本分数的概率2 无论其标签如何,超出 的上限都是 。 在 趋于零的极限下,在子组 2 中观察到大于 的任何概率的概率同样趋于零。
这意味着,虽然我们观察到子组 1 中的错误的概率至少保持固定为 ,但我们可以观察到涉及子组 2 中的任何样本的任何错误(跨组错误或纯粹的第 2 组错误)趋向于零,从而证实了该主张。 ∎
附录F合成实验详细信息
F.1 使用给定的 AUROC 对随机模型进行采样
我们综合实验的一个关键组成部分是能够随机采样一组具有目标 AUROC 的模型分数和标签。 为此,我们使用以下过程(以前可能知道也可能不知道;我们从头开始为这项工作推导它,但不声明其新颖性)。 令 为我们总体采样的点数, 为采样的正点数(由用户给定的流行度决定)。
-
1.
对 0 到 1 之间的正标签样本分数的随机集合进行均匀采样。
-
2.
在从 和 索引的每个(升序)模型正得分之间,我们可以统计得分小于此中任何值的正样本数量窗口 () 以及分数大于此窗口中任何值的数字(将是 )。
-
3.
由于目标 AUROC 是随机抽样的负分比随机抽样的正分排名靠前的概率,我们可以利用小于正分的分数 和大于正分的分数 的数量,通过二项分布计算随机抽样的负分在窗口 中的概率。
-
4.
现在,要对随机负样本进行采样,我们只需首先使用上面分配的概率对随机窗口 进行采样,然后在该窗口内均匀采样值 。 我们可以重复这个过程到负样本的目标数量以形成我们的最终分数集。
-
5.
如果需要,输出分数可以进一步缩放以达到数据集普遍性给出的期望,或者可以通过给定指定标签的校准方法进行调整。 这两个过程都可以在不影响 AUROC 的情况下完成。 请注意,由于任何校准模型都会具有由标签流行率给出的预期概率(参见附录F.2),因此前一种情况严格弱于后者。
F.2校准包括流行率匹配
令 为随机变量,描述模型在数据生成函数定义的输入分布上输出的概率。 如果模型经过校准,这意味着 — 给定点的标签为 1 的概率由该样本的模型输出概率精确给出。 考虑到这一点,我们有:
F.3优化流程详情
-
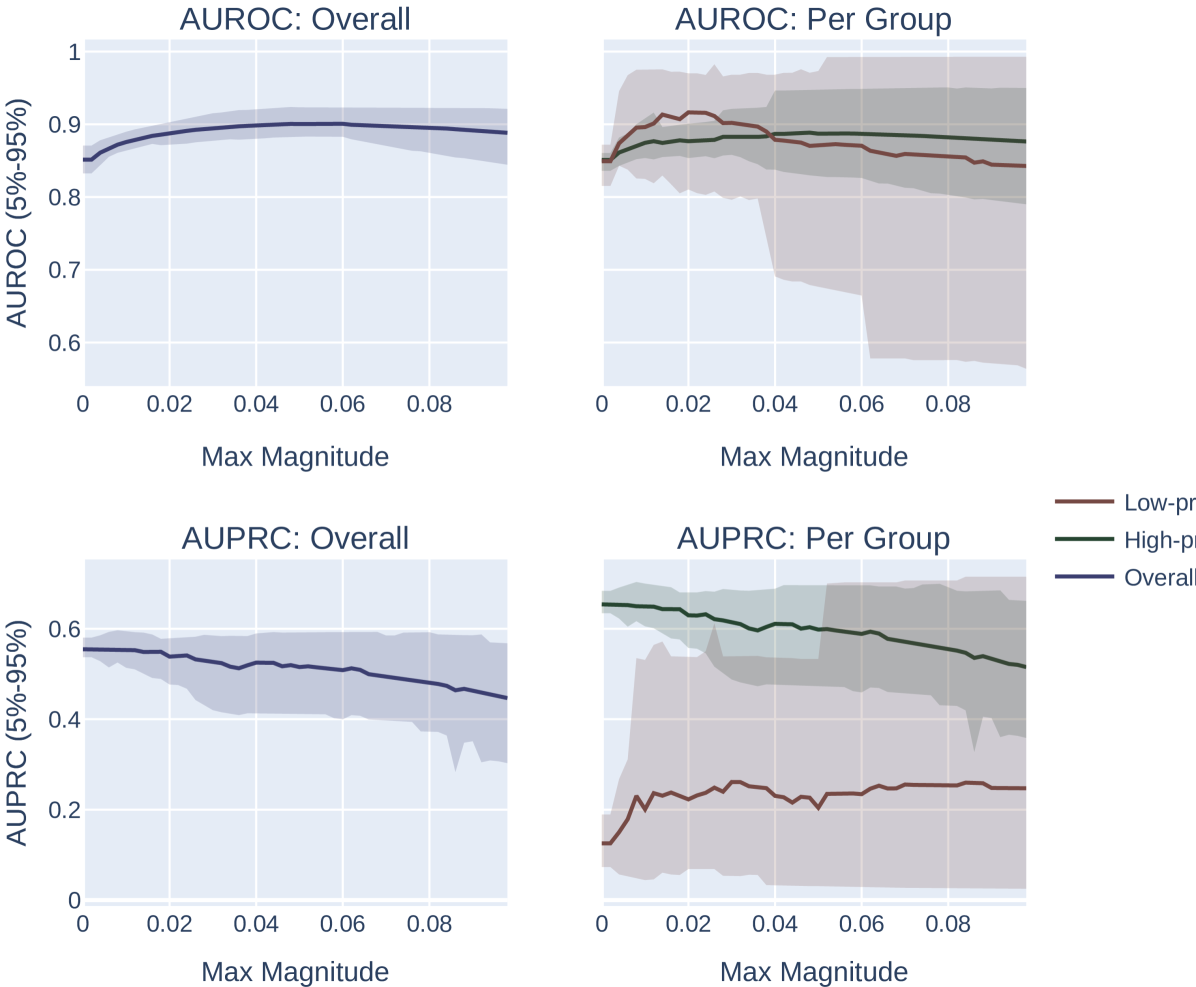
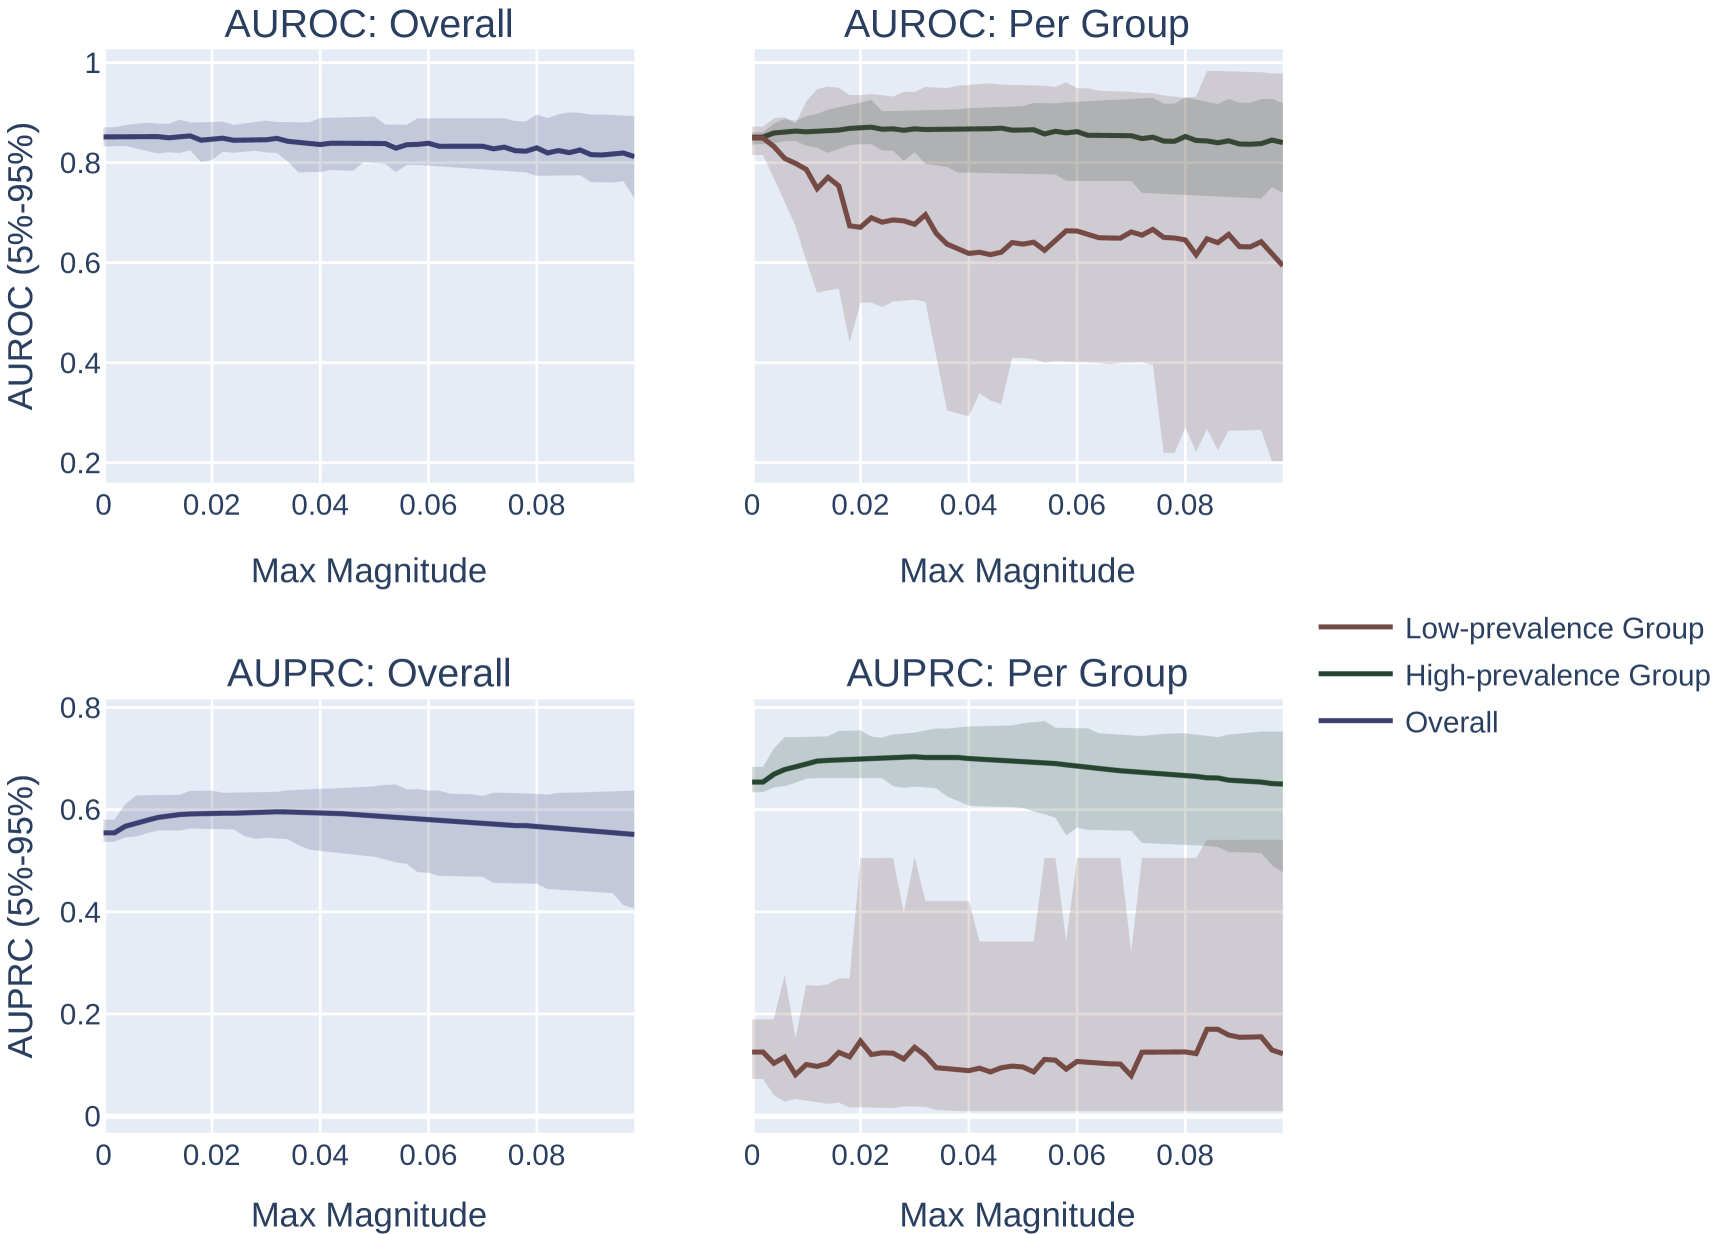
M1。
添加随机噪声。 我们对向量 进行采样,其中每个元素都是从 中统一抽取的。 我们计算 的选择指标。 我们重复此过程 100 次,并返回达到选择指标最大值的 。 我们改变网格中扰动的最大幅度。 此设置的结果如图 6 所示。
我们注意到,这种方法微妙地偏向于患病率较低的群体。 特别是,由于低流行率组的分数往往会被“压缩”到概率空间的较小区域,因此固定幅度的随机扰动将按比例在低流行率组中引起更多的分数排列组比高流行组,这为系统提供了更大的能力来改进低流行组的模型,而与 AUROC 或 AUPRC 的选择无关。
- M2。
- M3。

附录 G有关真实世界实验的其他详细信息
G.1 数据集详细信息
我们使用以下四个数据集。 在所有数据集中,我们使用性别和种族作为受保护的属性。
-
•
adult (Asuncion & Newman,2007):UCI 成人数据集,其目标是预测个人的收入是否。
-
•
compas (Angwin 等人, 2022):预测两年累犯的任务。 我们只选择属于“非裔美国人”和“白人”的样本,从而产生二元种族变量。
-
•
lsac (Wightman,1998):任务是预测法学院申请者是否会通过律师考试。 我们只选择属于白人和黑人申请人的样本。
-
•
mimic (Johnson 等人, 2016):我们使用 Harutyunyan 等人 (2019) 提出的院内死亡率任务,其中目标是根据患者住院后 48 小时内的实验室和生命体征来预测患者是否会在 ICU 中死亡。 我们只选择属于白人和黑人患者的样本。
在每个数据集中,我们通过对多数组进行二次采样来平衡各组。 然后,我们将每个数据集分为 50% 训练集、25% 验证集、25% 测试集,按组分层。 数据集统计信息见表1。
| Dataset | Attribute | # Features | Prevalence (Higher) | Prevalence (Lower) | |
|---|---|---|---|---|---|
| adult | Sex | 20,394 | 12 | 30.1% | 10.7% |
| adult | Race | 6,248 | 12 | 24.6% | 12.2% |
| compas | Sex | 2,438 | 6 | 52.0% | 39.4% |
| compas | Race | 4,908 | 6 | 55.4% | 42.3% |
| lsac | Sex | 15,906 | 8 | 96.0% | 95.0% |
| lsac | Race | 2,396 | 8 | 96.5% | 77.2% |
| mimic | Sex | 15,632 | 49 | 12.5% | 11.9% |
| mimic | Race | 4,030 | 49 | 13.9% | 9.3% |
G.2 超参数网格
我们使用以下超参数网格进行实验:
-
•
最大深度:{1, 2, …, 9}
-
•
学习率:[0,01,0.3]
-
•
估计器数量: [50, 1000]
-
•
最小儿童体重:{1, 2, …, 9}
-
•
使用受保护的属性作为输入特征:{是,否}
-
•
患病率较高组的组权重:{1, 2, 3, 4, 5, 10, 15, 20, 25, 50}
G.3 其他结果
附录H文献综述方法
H.1论文采集
我们全面文献检索的初始阶段涉及从 Arxiv 存储库和 NeurIPS 会议记录中获取数据集。 利用 Hugging Face 提供的 RedPajama 数据集获取 Arxiv 论文,以及 NeurIPS 论文的自定义抓取器,我们专门针对这些来源进行文献综述。 Arxiv 数据集大小约为 93.8 GB,包含超过 150 万条 JSONL 格式的文本。 对于 NeurIPS,我们开发了一个脚本来抓取 1987 年至 2019 年的会议论文(9680 篇文本),旨在丰富我们的搜索。
H.2 关键字驱动的过滤过程
-
1.
关键字列表开发: 我们开发了两个不同的关键词列表,以系统地识别与我们在初始筛选阶段的 AUROC(接收器操作特性下的区域)和 AUPRC(精确回忆曲线下的区域)研究相关的论文。 关键字列表可在此处访问 AUPRC 和此处访问 AUROC。
-
2.
基于脚本的自动搜索: 使用 Python 脚本来遍历 Arxiv 和 NeurIPS 数据集。 这些脚本检测到我们预定义关键字的出现,从而可以有效地解析来自两个来源的大量文本。
-
3.
双重提及选择标准: 我们重点关注讨论 AUROC 和 AUPRC 的论文。 该标准确保了论文与我们的研究问题的相关性。 通过这个过程,我们将 Arxiv 数据集中提到这两个关键词的文本范围从 16,022 条文本(包含任意一组关键词)缩小到 8,244 条。 在 NeurIPS 数据集中,在审查的 9,680 篇文本中,发现 78 篇包含来自 AUPRC 和 AUROC 的关键词。
H.3AI辅助筛选和细化
-
1.
GPT-3.5的简要知识分析: 我们利用 OpenAI 的 GPT-3.5 模型对 arXiv 数据集进行第一轮人工智能辅助分析。 该模型识别并提取了明确主张 AUPRC 与 AUROC 在类别不平衡情况下的比较有效性的论文,将我们的数据集从 Arxiv 减少到 2,728 篇论文。
-
2.
使用 GPT-4.0 Turbo 进一步细化: 为了进一步完善我们的数据集,我们采用了 GPT-4.0 Turbo 模型。 在使用该模型从 Arxiv 审查的 2,728 篇论文中,发现 201 篇是相关的。 对于 NeurIPS,我们使用 GPT-4 进行重点搜索,从包含与 AUPRC 和 AUROC 相关关键词的初始集合中识别出 2 篇与我们的论文特别相关的论文。
H.4手动审核
-
•
用于协作分析的共享文档: 我们将所有相关论文及其各自的 Arxiv ID 和 GPT-4.0 Turbo 识别的声明编译成共享的 Google 文档以供团队审查。 论文中提出的主张是手动找到的,并且突出显示了他们提出的主张的具体引用以及他们是否引用了该主张。
H.4.1 最终论文
经过人工审查,我们发现了 128 篇论文提出或引用了某种版本的主张,即“在类别不平衡的情况下,AUPRC 比 AUROC 更好”。 (Cook & Ramadas, 2020; Leisman, 2018; Yang 等人, 2015; Gaudreault 等人, 2021; Albora & Zaccaria, 2022; Lim & van der Schaar, 2018; Liu 等人, 2023; Randl 等人, 2023;Tusfiqur 等人, 2022;Piermarini 等人, 2023;Zhang & Bondell, 2018;Weiss & Tonella, 2021;Afanasiev 等人, 2021;Li 等人, 2022;Torfi 等人, 2022;Wu 等人, 2020; Miao & Zhu, 2022; Navarro 等人, 2022; Cho 等人, 2021; Wagner 等人, 2023; Isupova 等人, 2017; Sarvari 等人, 2021; Hiri 等人, 2022; Herbach, 2021; Si & Roberts, 2021; Narayanan 等人, 2022; Li 等人, 2020; Lee 等人, 2013; Rayhan 等人, 2017; Kyono 等人, 2018; Adler, 2021; Seo 等人, 2021; Hong 等人, 2019; Hagedoorn & Spanakis, 2017; Yang 等人, 2022a; Babaei 等人, 2021; Garcin & Stéphan, 2021; Mehboudi 等人, 2022; Yang 等人, 2022b; Shen & Kursun, 2021; Muthukrishna 等人, 2019; Deng 等人, 2023;Yang,2021;Harer 等人,2018;Meister 等人,2022;Skarding 等人,2021;Alvarez 等人,2022;Zou 等人,2022;Mangolin 等人,2022;Mosteiro 等人,2021;Hashemi 等人, 2018; Lee 等人, 2020; Zavrtanik 等人, 2021; Showalter & Wu, 2019; Cranmer & Desmarais, 2016; Bryan & Moriano, 2023;张等人,2017;多明格斯等人, 2020;马克达尔等人,2017;傅等人,2021;庞等人, 2023; Rezvani 等人, 2021; Ozyegen 等人, 2022; Prapas 等人, 2023; Rayhan 等人, 2020; Thambawita 等人, 2020;舒克拉和马林,2019; Blevins 等人, 2021; Vijayan 等人,2017; Budka 等人, 2021;许等人,2020;史密斯等人,2023;崔等人,2018;鞠等人,2018; Pashchenko等人,2018;楚等人,2018; Silva 等人, 2022; Bach Nguyen 等人,2022; Deshwar等人,2015;布罗菲和劳德,2020;玛亚基和里维尔,2022; Mongia 等人, 2021; Tiulpin 等人, 2019; Romero 等人, 2022; Rubin等人,2012;施瓦茨等人,2021;吕等人,2021;洛佩兹-马丁内斯等人,2022;艾哈迈德和考维尔,2020;龚等人,2021;张等人,2021;舒克拉和马林,2018;隆德等人,2019;马等人,2022; Ruff 等人,2021;雷霸等人,2015; Chakraborty 等人, 2023;拉贾比和他,2021;纽比等人,2022;阿克塞尔罗德和戈麦斯-邦巴雷利,2023; Kim 等人,2022;安藤&黄,2017; Stolman 等人, 2022;莫斯克拉等人, 2022;库尔卡尼等人,2021; 2019年荣获等人奖;斯蒂芬森等人,2022; Srivastava 等人, 2019; Moor等人,2019; Danesh Pazho 等人, 2023; Kiran 等人, 2018;斯坦巴斯和伯姆,2021;马等人,2020;卡拉佐夫等人,2022;丁等人,2018; Mousavian等人,2016; Rayhan等人,2017; Vens等人,2008;罗哈尼和伊斯拉奇,2019;洛佩斯等人,2013; Sahiner等人,2017;饶等人,2022;希布什曼和温宁格,2023; Ntroumpogiannis 等人, 2023;韦斯和托内拉,2023;霍尔等人,2023;戈亚尔和基亚里,2020; Boyd等人,2013)。
所有已确定的论文、手动筛选结果和提取的引文均可在此处找到:https://docs.google.com/spreadsheets/d/1NjDpwoj_8EkIwtGZzwM6w2nbst-LlGJPAqUcVINmPEk/edit?usp=sharing。
|
Claim |
References |
Commentary |
|---|---|---|
|
Precision-recall curves or other associated metrics may more appropriately reflect deployment objectives than the receiver operating characteristic. |
(Cook & Ramadas, 2020; Leisman, 2018; Yang et al., 2015; Muthukrishna et al., 2019; Deng et al., 2023; Harer et al., 2018; Ahmed & Courville, 2020) |
While this claim is true, the informativeness of the PR curve for target deployment metrics is not sufficient to conclude that the AUPRC is superior to the AUROC in all cases of class imbalance. Despite this, it is often taken to assert this more general claim without caveat. |
|
AUPRC does not depend on the number of true-negatives, so will be less optimistic than the AUROC |
(Leisman, 2018; Kyono et al., 2018; Adler, 2021; Meister et al., 2022; Mosteiro et al., 2021; Showalter & Wu, 2019; Cranmer & Desmarais, 2016; Domingues et al., 2020; Rezvani et al., 2021; Hsu et al., 2020; Ju et al., 2018; Pashchenko et al., 2018; Romero et al., 2022; Vens et al., 2008) |
As shown in Theorem 1, AUROC and AUPRC can both be naturally expressed as a function of the expectation of the model’s false positive rate. More generally, lack of dependence on one quadrant among the mutually dependent four quadrants of a confusion matrix is not an informative property for the AUROC and AUPRC metrics. |
|
AUPRC will often be significantly lower, farther from optimality, and/or will grow more non-linearly as model performance improves than AUROC for low-prevalence tasks |
(Leisman, 2018; Yang et al., 2015; Mehboudi et al., 2022; Cranmer & Desmarais, 2016) |
Metric utility for model comparison depends on how appropriately it prioritizes model improvements, and is therefore less about the raw magnitude of the metric and more about the situations in which the order of a set of models will differ under one metric vs. another. One could easily make AUROC yield smaller values or grow more quickly near optimality by simply exponentiating it, but this would not yield a better metric. |
|
AUPRC depends on prevalence, which is a desirable property |
(Navarro et al., 2022) |
This statement is too vague to be formally evaluated; whether or not this dependence on prevalence is desirable depends on the context. For model comparison in general, we argue it is not desirable in this form as it induces the biases inhere in AUPRC previously discussed. |
|
AUPRC better captures differentiating a positive sample with high score from a “hard” negative sample (“hard” meaning one also with high score) |
(Kiran et al., 2018) |
While this claim is true by Theorem 2, it is not clear why this would be desired in general; this implicitly favors comparing “hard” negatives against “easy” positives as opposed to “easy” negatives against “hard” positives. |
|
AUROC is otherwise “optimistic” in low-prevalence settings |
(Cook & Ramadas, 2020; Afanasiev et al., 2021; Wu et al., 2020; Miao & Zhu, 2022; Cho et al., 2021; Hagedoorn & Spanakis, 2017; Yang et al., 2022a; Mangolin et al., 2022; Silva et al., 2022; Lyu et al., 2021; Ahmed & Courville, 2020; Zhang et al., 2021; Lund et al., 2019; Ruff et al., 2021; Chakraborty et al., 2023; Rajabi & He, 2021; Ando & Huang, 2017; Kulkarni et al., 2021; Karadzhov et al., 2022; Hibshman & Weninger, 2023) |
This claim is underspecified, and un-true. AUROC always means the same thing, probabilistically, and that meaning independent from class imbalance. |
|
AUPRC focues more on the positive (minority) class |
(Tusfiqur et al., 2022; Wu et al., 2020; Si & Roberts, 2021; Narayanan et al., 2022; Babaei et al., 2021; Garcin & Stéphan, 2021; Deng et al., 2023; Alvarez et al., 2022; Mosteiro et al., 2021; Showalter & Wu, 2019; Pang et al., 2023; Ozyegen et al., 2022; Danesh Pazho et al., 2023; Kiran et al., 2018; López et al., 2013; Rao et al., 2022; Ntroumpogiannis et al., 2023) |
This is unfounded; both AUROC and AUPRC are weighted expectations over the model’s false positive rate—AUPRC cares more about samples in regions of low firing rate, not explicitly about positive or minority samples. |
|
AUROC can not appropriately detect models with poor recall |
(Navarro et al., 2022) |
This claim is unfounded; the AUROC clearly depends on the model’s recall. Besides, if recall is the measure of interest, then that should be measured explicitly. |
|
Claim |
References |
Valid? |
Commentary |
|---|---|---|---|
|
Precision-recall curves or other associated metrics may more appropriately reflect deployment objectives than the receiver operating characteristic. |
(Cook & Ramadas, 2020; Leisman, 2018; Saito & Rehmsmeier, 2015; Yuan et al., 2015; Bleakley et al., 2007; Ozenne et al., 2015; Rosenberg, 2022; Zhou et al., 2020; Lichtnwalter & Chawla, 2012; Yang et al., 2015) |
✓ |
While this claim is true, the informativeness of the PR curve for target deployment metrics is insufficient to conclude that the AUPRC is superior to the AUROC in all cases of class imbalance. Despite this, it is often taken to assert this more general claim without caveat. |
|
AUPRC does not depend on the number of true negatives, so will be less optimistic than the AUROC |
(Leisman, 2018; Goadrich et al., 2006; Cranmer & Desmarais, 2016) |
As shown in Theorem 1, AUROC and AUPRC can both be naturally expressed as a function of the expectation of the model’s false positive rate. More generally, the lack of dependence on one quadrant among the mutually dependent four quadrants of a confusion matrix is not an informative property for the AUROC and AUPRC metrics. |
|
|
AUPRC will often be significantly lower, farther from optimality, and/or will grow more non-linearly as model performance improves than AUROC for low-prevalence tasks |
(Leisman, 2018; Yuan et al., 2015; Goadrich et al., 2006; Mazzanti, 2023; Rosenberg, 2022; Zhou et al., 2020; Lichtnwalter & Chawla, 2012; Yang et al., 2015; Cranmer & Desmarais, 2016) |
✓ |
Metric utility for model comparison depends on how appropriately it prioritizes model improvements. Therefore, it is less about the raw magnitude of the metric and more about the situations in which the order of a set of models will differ under one metric vs. another. One could easily make AUROC yield smaller values or grow more quickly near optimality by simply exponentiating it, but this would not yield a better metric. |
|
AUPRC depends on prevalence, which is a desirable property |
(Saito & Rehmsmeier, 2015; Goadrich et al., 2006; Yuan et al., 2015) |
This statement is too vague to be formally evaluated; whether or not this dependence on prevalence is desirable depends on the context. For model comparison in general, we argue it is not desirable in this form as it induces the biases in AUPRC previously discussed. |
|
|
AUPRC better captures differentiating a positive sample with high score from a “hard” negative sample (“hard” meaning one also with high score) |
(Rosenberg, 2022) |
✓ |
While this claim is true by Theorem 2, it is not clear why this would be desired in general; this implicitly favors comparing “hard” negatives against “easy” positives as opposed to “easy” negatives against “hard” positives. |
H.5代码可用性
与文献综述搜索相关的所有代码都可以在以下 GitHub 存储库中找到:https://anonymous.4open.science/r/arxiv_neurips_search-3127/README.md