
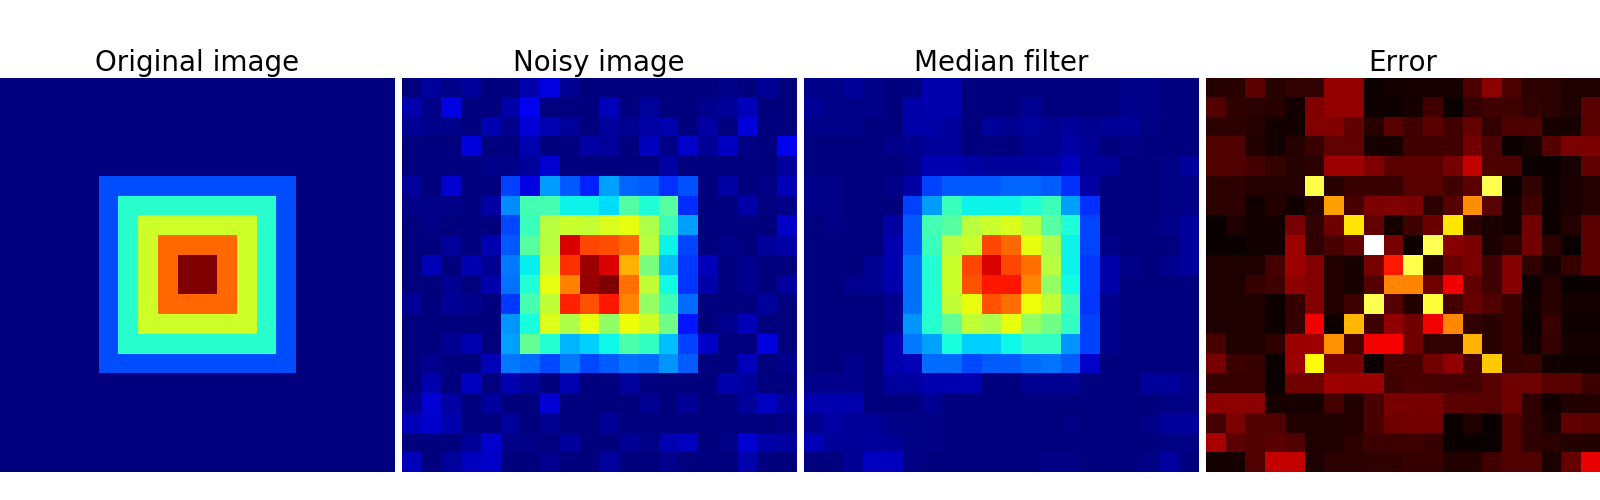
Denoising an image with the median filter
This example shows the original image, the noisy image, the denoised one (with the median filter) and the difference between the two.
Python source code: plot_denoising.py
import numpy as np
from scipy import ndimage
import matplotlib.pyplot as plt

im = np.zeros((20, 20))
im[5:-5, 5:-5] = 1
im = ndimage.distance_transform_bf(im)
im_noise = im + 0.2*np.random.randn(*im.shape)

im_med = ndimage.median_filter(im_noise, 3)

plt.figure(figsize=(16, 5))

plt.subplot(141)
plt.imshow(im, interpolation='nearest')
plt.axis('off')
plt.title('Original image', fontsize=20)
plt.subplot(142)
plt.imshow(im_noise, interpolation='nearest', vmin=0, vmax=5)
plt.axis('off')
plt.title('Noisy image', fontsize=20)
plt.subplot(143)
plt.imshow(im_med, interpolation='nearest', vmin=0, vmax=5)
plt.axis('off')
plt.title('Median filter', fontsize=20)
plt.subplot(144)
plt.imshow(np.abs(im - im_med), cmap=plt.cm.hot, interpolation='nearest')
plt.axis('off')
plt.title('Error', fontsize=20)


plt.subplots_adjust(wspace=0.02, hspace=0.02, top=0.9, bottom=0, left=0,
                    right=1)

plt.show()
Total running time of the example: 0.13 seconds ( 0 minutes 0.13 seconds)