
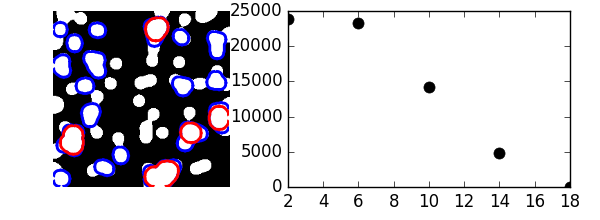
Granulometry
This example performs a simple granulometry analysis.
Python source code: plot_granulo.py
import numpy as np
from scipy import ndimage
import matplotlib.pyplot as plt

def disk_structure(n):
    struct = np.zeros((2 * n + 1, 2 * n + 1))
    x, y = np.indices((2 * n + 1, 2 * n + 1))
    mask = (x - n)**2 + (y - n)**2 <= n**2
    struct[mask] = 1
    return struct.astype(np.bool)


def granulometry(data, sizes=None):
    s = max(data.shape)
    if sizes == None:
        sizes = range(1, s/2, 2)
    granulo = [ndimage.binary_opening(data, \
            structure=disk_structure(n)).sum() for n in sizes]
    return granulo


np.random.seed(1)
n = 10
l = 256
im = np.zeros((l, l))
points = l*np.random.random((2, n**2))
im[(points[0]).astype(np.int), (points[1]).astype(np.int)] = 1
im = ndimage.gaussian_filter(im, sigma=l/(4.*n))

mask = im > im.mean()

granulo = granulometry(mask, sizes=np.arange(2, 19, 4))

plt.figure(figsize=(6, 2.2))

plt.subplot(121)
plt.imshow(mask, cmap=plt.cm.gray)
opened = ndimage.binary_opening(mask, structure=disk_structure(10))
opened_more = ndimage.binary_opening(mask, structure=disk_structure(14))
plt.contour(opened, [0.5], colors='b', linewidths=2)
plt.contour(opened_more, [0.5], colors='r', linewidths=2)
plt.axis('off')
plt.subplot(122)
plt.plot(np.arange(2, 19, 4), granulo, 'ok', ms=8)


plt.subplots_adjust(wspace=0.02, hspace=0.15, top=0.95, bottom=0.15, left=0, right=0.95)
plt.show()
Total running time of the example: 0.32 seconds ( 0 minutes 0.32 seconds)