
1.4.7.1.3. A simple, good-looking plot
Demoing some simple features of matplotlib
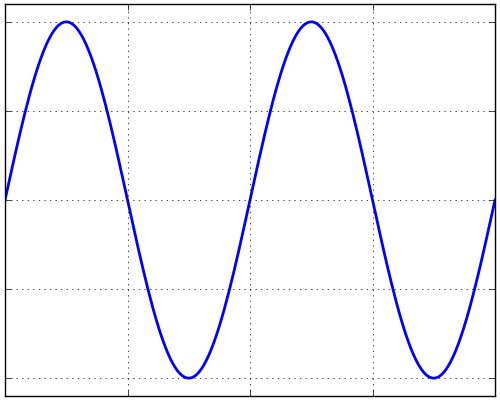
import numpy as np
import matplotlib
matplotlib.use('Agg')
import matplotlib.pyplot as plt

fig = plt.figure(figsize=(5, 4), dpi=72)
axes = fig.add_axes([0.01, 0.01, .98, 0.98])
X = np.linspace(0, 2, 200, endpoint=True)
Y = np.sin(2*np.pi*X)
plt.plot(X, Y, lw=2)
plt.ylim(-1.1, 1.1)
plt.grid()

plt.show()
Total running time of the script: ( 0 minutes 0.034 seconds)