
1.4.7.1.9. 3D plotting
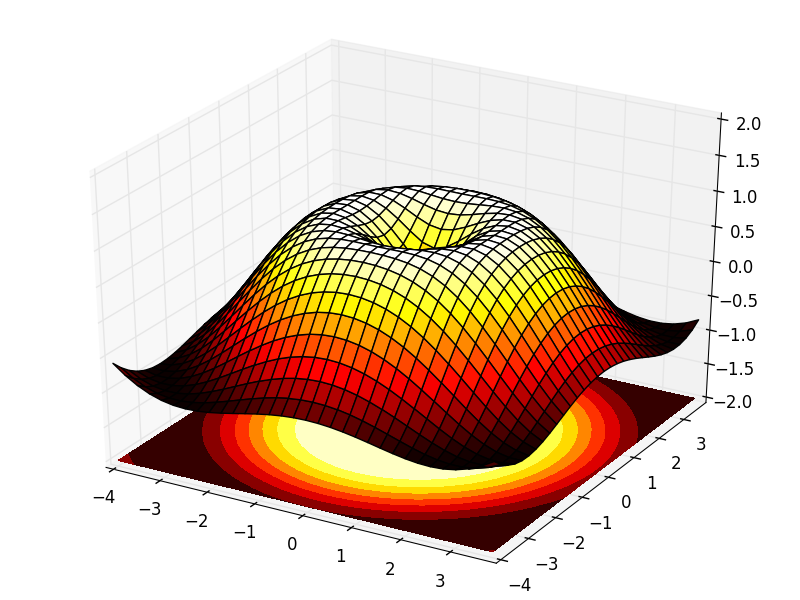
A simple example of 3D plotting.
import numpy as np
import matplotlib.pyplot as plt
from mpl_toolkits.mplot3d import Axes3D

fig = plt.figure()
ax = Axes3D(fig)
X = np.arange(-4, 4, 0.25)
Y = np.arange(-4, 4, 0.25)
X, Y = np.meshgrid(X, Y)
R = np.sqrt(X ** 2 + Y ** 2)
Z = np.sin(R)

ax.plot_surface(X, Y, Z, rstride=1, cstride=1, cmap=plt.cm.hot)
ax.contourf(X, Y, Z, zdir='z', offset=-2, cmap=plt.cm.hot)
ax.set_zlim(-2, 2)

plt.show()
Total running time of the script: ( 0 minutes 0.084 seconds)