
1.4.7.1.12. Plotting in polar coordinnates
A simple example showing how to plot in polar coordinnates with matplotlib.
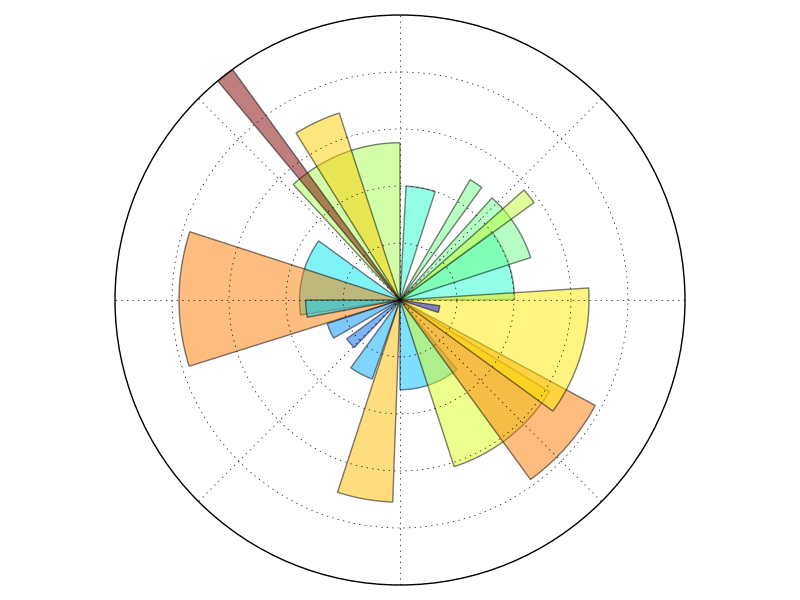
import numpy as np
import matplotlib.pyplot as plt

ax = plt.axes([0.025, 0.025, 0.95, 0.95], polar=True)

N = 20
theta = np.arange(0.0, 2 * np.pi, 2 * np.pi / N)
radii = 10 * np.random.rand(N)
width = np.pi / 4 * np.random.rand(N)
bars = plt.bar(theta, radii, width=width, bottom=0.0)

for r,bar in zip(radii, bars):
    bar.set_facecolor(plt.cm.jet(r/10.))
    bar.set_alpha(0.5)

ax.set_xticklabels([])
ax.set_yticklabels([])
plt.show()
Total running time of the script: ( 0 minutes 0.048 seconds)