
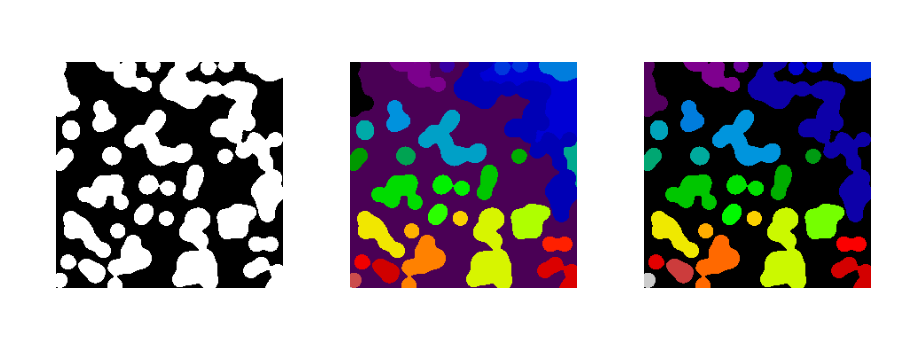
Labelling connected components of an image
This example shows how to label connected components of a binary image, using the dedicated skimage.measure.label function.
Python source code: plot_labels.py
from skimage import measure
try:
    from skimage import filters
except ImportError:
    from skimage import filter as filters
import matplotlib.pyplot as plt
import numpy as np

n = 12
l = 256
np.random.seed(1)
im = np.zeros((l, l))
points = l * np.random.random((2, n ** 2))
im[(points[0]).astype(np.int), (points[1]).astype(np.int)] = 1
im = filters.gaussian_filter(im, sigma= l / (4. * n))
blobs = im > 0.7 * im.mean()

all_labels = measure.label(blobs)
blobs_labels = measure.label(blobs, background=0)

plt.figure(figsize=(9, 3.5))
plt.subplot(131)
plt.imshow(blobs, cmap='gray')
plt.axis('off')
plt.subplot(132)
plt.imshow(all_labels, cmap='spectral')
plt.axis('off')
plt.subplot(133)
plt.imshow(blobs_labels, cmap='spectral')
plt.axis('off')

plt.tight_layout()
plt.show()
Total running time of the example: 0.31 seconds ( 0 minutes 0.31 seconds)