
Otsu thresholding
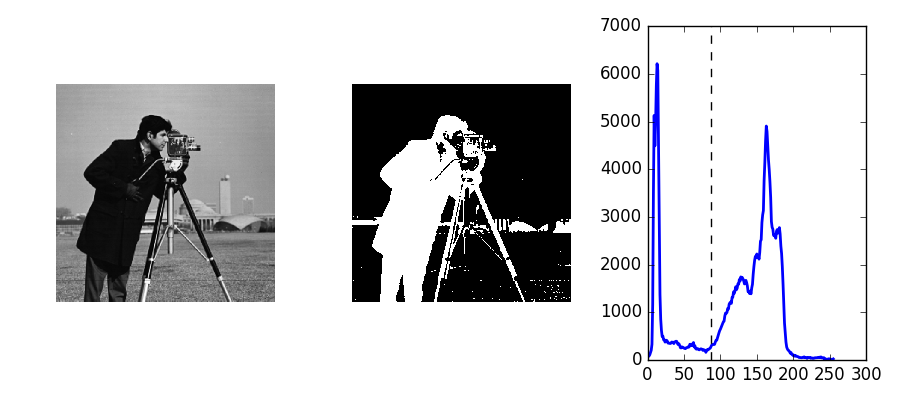
This example illustrates automatic Otsu thresholding.
Python source code: plot_threshold.py
import matplotlib.pyplot as plt
from skimage import data
try:
    from skimage import filters
except ImportError:
    from skimage import filter as filters
from skimage import exposure

camera = data.camera()
val = filters.threshold_otsu(camera)

hist, bins_center = exposure.histogram(camera)

plt.figure(figsize=(9, 4))
plt.subplot(131)
plt.imshow(camera, cmap='gray', interpolation='nearest')
plt.axis('off')
plt.subplot(132)
plt.imshow(camera < val, cmap='gray', interpolation='nearest')
plt.axis('off')
plt.subplot(133)
plt.plot(bins_center, hist, lw=2)
plt.axvline(val, color='k', ls='--')

plt.tight_layout()
plt.show()
Total running time of the example: 0.17 seconds ( 0 minutes 0.17 seconds)