
1.3.4. 高级操作
Section contents
1.3.4.1. Polynomials
NumPy还包含不同bases的多项式:
For example, 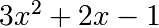 :
:
>>> p = np.poly1d([3, 2, -1])
>>> p(0)
-1
>>> p.roots
array([-1.        ,  0.33333333])
>>> p.order
2
>>> x = np.linspace(0, 1, 20)
>>> y = np.cos(x) + 0.3*np.random.rand(20)
>>> p = np.poly1d(np.polyfit(x, y, 3))

>>> t = np.linspace(0, 1, 200)
>>> plt.plot(x, y, 'o', t, p(t), '-')
[<matplotlib.lines.Line2D object at ...>, <matplotlib.lines.Line2D object at ...>]
[source code, hires.png, pdf]
See http://docs.scipy.org/doc/numpy/reference/routines.polynomials.poly1d.html for more.
1.3.4.1.1. 更多的多项式(具有更多的bases)
NumPy还有一个更复杂的多项式接口,它支持例如Chebyshev basis。
:
>>> p = np.polynomial.Polynomial([-1, 2, 3]) # coefs in different order!
>>> p(0)
-1.0
>>> p.roots()
array([-1.        ,  0.33333333])
>>> p.degree()  # In general polynomials do not always expose 'order'
2
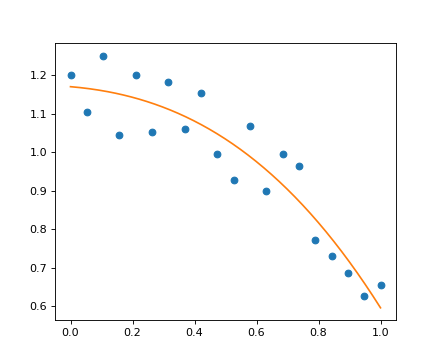
在Chebyshev basis中使用多项式的示例,多项式的范围为[-1, 1]:
>>> x = np.linspace(-1, 1, 2000)
>>> y = np.cos(x) + 0.3*np.random.rand(2000)
>>> p = np.polynomial.Chebyshev.fit(x, y, 90)

>>> t = np.linspace(-1, 1, 200)
>>> plt.plot(x, y, 'r.')
[<matplotlib.lines.Line2D object at ...>]
>>> plt.plot(t, p(t), 'k-', lw=3)
[<matplotlib.lines.Line2D object at ...>]
[source code, hires.png, pdf]
The Chebyshev polynomials have some advantages in interpolation.
1.3.4.2. Loading data files
1.3.4.2.1. 文本文件
Example: populations.txt:
# year  hare    lynx    carrot
1900    30e3    4e3     48300
1901    47.2e3  6.1e3   48200
1902    70.2e3  9.8e3   41500
1903    77.4e3  35.2e3  38200
>>> data = np.loadtxt('data/populations.txt')
>>> data
array([[  1900.,  30000.,   4000.,  48300.],
       [  1901.,  47200.,   6100.,  48200.],
       [  1902.,  70200.,   9800.,  41500.],
...
>>> np.savetxt('pop2.txt', data)
>>> data2 = np.loadtxt('pop2.txt')
Note
If you have a complicated text file, what you can try are:
np.genfromtxt- 使用Python的I/O函数和正则表达式解析(Python非常适合这个)
Reminder: Navigating the filesystem with IPython
In [1]: pwd      # show current directory
'/home/user/stuff/2011-numpy-tutorial'
In [2]: cd ex
'/home/user/stuff/2011-numpy-tutorial/ex'
In [3]: ls
populations.txt  species.txt
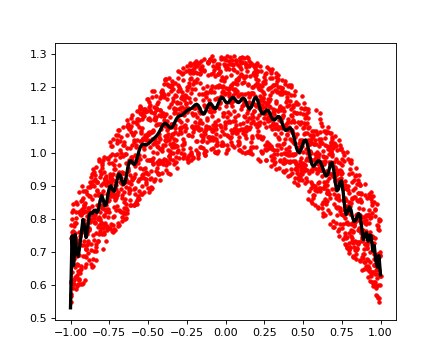
1.3.4.2.2. 图片
Using Matplotlib:
>>> img = plt.imread('data/elephant.png')
>>> img.shape, img.dtype
((200, 300, 3), dtype('float32'))
>>> plt.imshow(img)
<matplotlib.image.AxesImage object at ...>
>>> plt.savefig('plot.png')

>>> plt.imsave('red_elephant', img[:,:,0], cmap=plt.cm.gray)
This saved only one channel (of RGB):
>>> plt.imshow(plt.imread('red_elephant.png'))
<matplotlib.image.AxesImage object at ...>
其他库:
>>> from scipy.misc import imsave
>>> imsave('tiny_elephant.png', img[::6,::6])
>>> plt.imshow(plt.imread('tiny_elephant.png'), interpolation='nearest')
<matplotlib.image.AxesImage object at ...>
1.3.4.2.3. NumPy自己的格式
NumPy有自己的二进制格式,不可移植但具有高效的I/O:
>>> data = np.ones((3, 3))
>>> np.save('pop.npy', data)
>>> data3 = np.load('pop.npy')
1.3.4.2.4. 众所周知(和鲜为人知)的文件格式
- HDF5: h5py, PyTables
- NetCDF:
scipy.io.netcdf_file, netcdf4-python, ... - Matlab:
scipy.io.loadmat,scipy.io.savemat - MatrixMarket:
scipy.io.mmread,scipy.io.mmwrite - IDL:
scipy.io.readsav
... if somebody uses it, there’s probably also a Python library for it.
Exercise: Text data files
编写一个Python脚本,从populations.txt加载数据,并丢弃最后一列和前5行。Save the smaller dataset to pop2.txt.
NumPy internals
If you are interested in the NumPy internals, there is a good discussion in Advanced NumPy.