|
Main Menus and Toolbars |

  
|
|
Main Menus and Toolbars |
|
The following sections describe the various menu and toolbar options in VMOD Flex.
File Menu
The File menu provides access to standard operations such as open, save, close project. The Project Preferences can also be modified.
Tools Menu
The Tools menu provides the following options:
Free Memory: allows you to free up the memory usage if you have been running a number of high-demand, 3D visualization operations
Preferences: Allows you to adjust the 3D Viewer performance preferences.
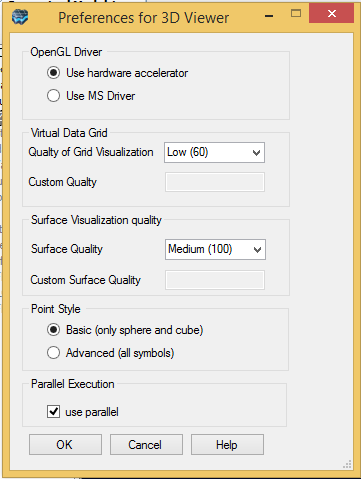
By default, VMOD Flex will attempt to use the vendor provided driver included with your graphics acceleration hardware. If problems are encountered with the vendor provided drivers, e.g., poor on-screen display/performance, then VMOD Flex provides the option to use the Microsoft Driver for OpenGL.
Depending on the size of your model, VMOD Flex may run very slowly during rotations or when 3D Numerical Gridded data objects are moved in the 3D Viewer (eg. MODFLOW Heads, Drawdown, Properties, or Transport Concentrations). In this situation, the virtual data grid option may be used to increase the speed of the data processing and image rendering. It can be used to set up a uniformly spaced grid with a specified number of rows and columns.
The virtual data grid option will interpolate the data from the model to the uniformly spaced virtual grid. This allows a smaller amount of information to be processed much faster. However, this also results in a loss of resolution of the data, and some local scale minimum and maximum values may be missed.
If you are experiencing performance issues, try choosing the "Low" option. The number presented in parentheses is the number of cells used along the X and Y axis for the virtual data grid.
Surface Visualization Quality
This parameter controls the visualization quality and speed of surface data objects for the 3D viewer. This parameter can be used when you want to display surfaces with a large grid size (eg. 500 * 500 or greater). Similar to the Virtual Data Grid option above, Surfaces will be re-sampled to the defined grid size (where the number in parentheses represents the uniform number of rows/columns).
|
The Surface Visualization Quality parameter will affect 3D visualization only; the resolution of the surface data object will not be adjusted, and will be honored when using this surface for Horizons or Property values in a numerical model.
Horizon quality is defined by quality of surface used for horizon. The maximum grid size for horizons is 1000 rows * 1000 columns. In case where you select a Surface that has a higher resolution than 1000*1000, VMOD Flex will coarsen that surface to a maximum horizon quality of 1000*1000. This grid size can be increased, however there will be a performance loss when doing Conceptual to Numerical conversion and 3D visualization of Horizons and Conceptual Model structural zones and property zones. For more details, please contact Technical Support. |
Point Style
This setting provides two options for displaying points in 3D Viewer: Basic and Advanced. If the Basic option is selected, 3D Viewer will render the point shapes in the 3D Viewer. On some computers this option may hinder the performance of the 3D Viewer. If the Advanced option is selected, 3D Viewer will use bitmap images to display the points. If you are experiencing performance issues display points in 3D Viewer, the Advanced option should be selected.
Note: The Basic option only supports cube and sphere symbols for displaying points.
Restore System Settings
Use this option to reset the factory style settings. If you open a project from Hydro GeoBuilder, some of the new display features may not immediately show up. Please select Tools / Restore System Settings. Then save the project, close, and reload and this should correct the problem.
VMOD Flex provides an option to use Project-wide Color Palettes. This is useful when you have multiple data objects that are rendering the same attribute (eg. heads from different model runs, conductivity distributions), and you want to make qualitative comparisons between these. This is challenging when each data object has its own min and max values and are colored based on this. However it becomes much easier when these data objects all read from a common color palette.
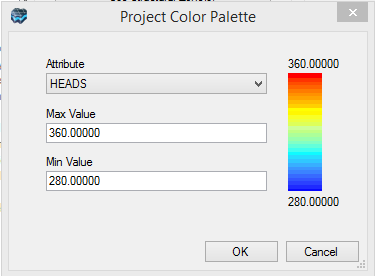
The Project Color Palette settings allow you to set the min/max values for various attributes; these can then be used for various data objects and viewers throughout the project.
To enable the Project Color Palette option for a specific data object, this must be enabled in the Color by Attribute page; see Color by Attribute for more details.
Workflow Menu
Allows to create a new Numerical Model workflow or Conceptual Model workflow.
When you select the appropriate item, a new workflow window will load.
Help Menu
Provides links to help topics, webhelp, and online resources. The Just In Time Help will display a small help panel below most steps in the workflow window.
Customer Feedback will allow you to submit bugs and suggestions using an online form on www.waterloohydrogeologic.com
The About screen will show the version and build you are using along with your registration details (name, company, serial number)
License / Request will load a form where you can request a license. Complete the form and submit this using the e-mail address provided.
License / Install will allow you to install a .LIC file that you have received from Technical support.
For more details on licensing, please refer to the Getting Started Guide.
Toolbars
Below the main menu, there are two toolbars:

The first row toolbar contains application/project level options; from left to right, these options are:
| · | New Project |
| · | Open Project |
| · | Save Project |
| · | Show/Hide the Model Explorer (and Data tab) |
| · | Show/Hide the Workflow Tree |
The second row toolbar contains options for adjusting the Data tab and Model Explorer; from left to right, these options are:
| · | Combine Data tab and Model Explorer into one view, separated by tabs |
| · | Separate the Data tab and Model Explorer into one frame above the other (factory default setting) |
| · | Collapse All (levels of the tree) |
| · | Collapse to Selected item on the Model Explorer |
| · | Dock Model Explorer to the left side of the window |
| · | Dock Model Explorer to the right side of the window |