
1.4.7.1.21. GridSpec
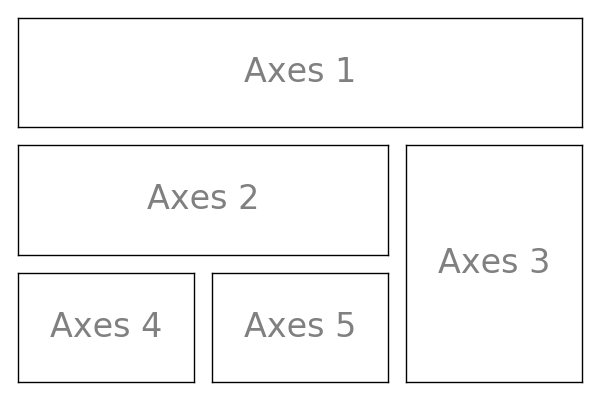
An example demoing gridspec
import matplotlib.pyplot as plt
import matplotlib.gridspec as gridspec

plt.figure(figsize=(6, 4))
G = gridspec.GridSpec(3, 3)

axes_1 = plt.subplot(G[0, :])
plt.xticks(())
plt.yticks(())
plt.text(0.5, 0.5, 'Axes 1', ha='center', va='center', size=24, alpha=.5)

axes_2 = plt.subplot(G[1, :-1])
plt.xticks(())
plt.yticks(())
plt.text(0.5, 0.5, 'Axes 2', ha='center', va='center', size=24, alpha=.5)

axes_3 = plt.subplot(G[1:, -1])
plt.xticks(())
plt.yticks(())
plt.text(0.5, 0.5, 'Axes 3', ha='center', va='center', size=24, alpha=.5)

axes_4 = plt.subplot(G[-1, 0])
plt.xticks(())
plt.yticks(())
plt.text(0.5, 0.5, 'Axes 4', ha='center', va='center', size=24, alpha=.5)

axes_5 = plt.subplot(G[-1, -2])
plt.xticks(())
plt.yticks(())
plt.text(0.5, 0.5, 'Axes 5', ha='center', va='center', size=24, alpha=.5)

plt.tight_layout()
plt.show()
Total running time of the script: ( 0 minutes 0.168 seconds)