
1.4.7.1.20. 3D plotting
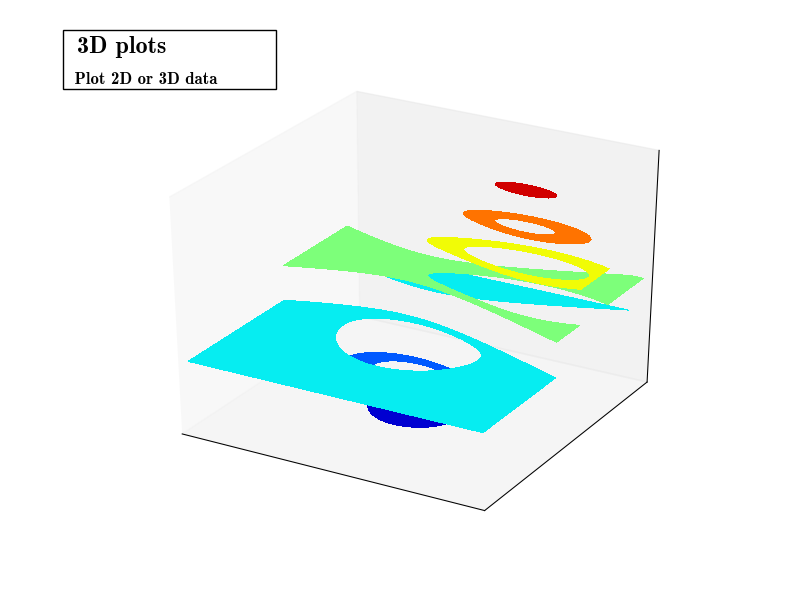
Demo 3D plotting with matplotlib and style the figure.
import matplotlib.pyplot as plt
from mpl_toolkits.mplot3d import axes3d

ax = plt.gca(projection='3d')
X, Y, Z = axes3d.get_test_data(0.05)
cset = ax.contourf(X, Y, Z)
ax.clabel(cset, fontsize=9, inline=1)

plt.xticks(())
plt.yticks(())
ax.set_zticks(())


ax.text2D(-0.05, 1.05, " 3D plots             \n",
          horizontalalignment='left',
          verticalalignment='top',
          bbox=dict(facecolor='white', alpha=1.0),
          family='Lint McCree Intl BB',
          size='x-large',
          transform=plt.gca().transAxes)

ax.text2D(-0.05, .975, " Plot 2D or 3D data",
          horizontalalignment='left',
          verticalalignment='top',
          family='Lint McCree Intl BB',
          size='medium',
          transform=plt.gca().transAxes)

plt.show()
Total running time of the script: ( 0 minutes 0.048 seconds)