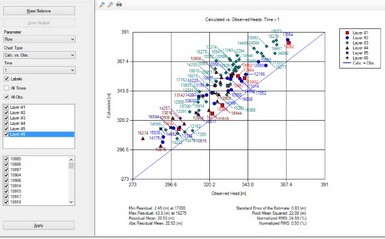
In VMOD Flex, you can view time series and calibration (observed vs. calculated) charts.
Click on View Charts from the workflow tree, and the following window will appear:
Flow
Calculated vs. Observed (Heads)

To the left of the chart window, you can choose what observation data to view; select individual wells, or see wells that belong to a specific group. After making a change to the well(s) selection, click on the [Apply] button to update the chart.
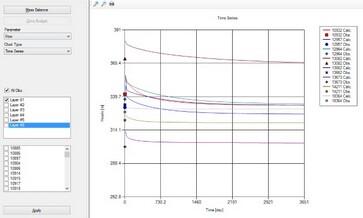
Time Series
| · | In the Charts toolbox, under Chart Type, select Time Series, and the following window will appear: |

Mass Balance
| · | Click on the Mass Balance button to launch Mass Balance charts |
| · | The features of the Mass Balance graphs are described in the VMOD Classic Interface documentation. Please see section 9.3.3 (Mass Balance Graphs) |
Zone Budget
| · | Click on the Zone Budget button to launch Zone Budget charts; this option is only available if you have run Zone Budget (see Select Engines for more details) |
| · | The features of the Zone Budget graphs are described in the VMOD Classic Interface documentation. Please see section 9.3.4 (Zone Budget Graphs) |
Transport
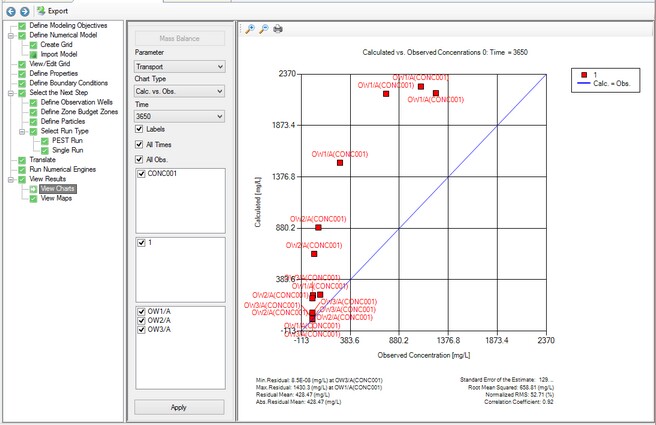
Calculated vs. Observed (Concentrations)
If your model included a transport run, you need to choose what chart types to view; at the top of the View Charts window, select "Transport" from the Parameter combo box.
To the left of the chart window, you can choose what observation data to view; select individual wells, or see wells that belong to a specific group. After making a change to the well(s) selection, click on the [Apply] button to update the chart.

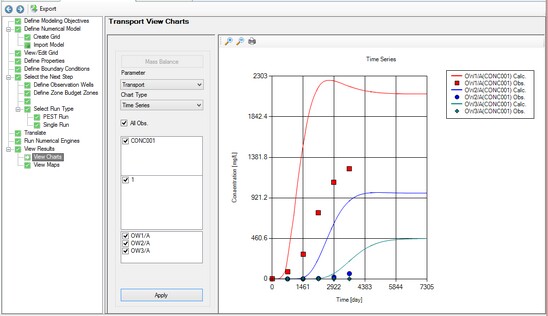
Time Series
To the left of the chart window, you can choose what observation data to view; select individual wells, or see wells that belong to a specific group. After making a change to the well(s) selection, click on the [Apply] button to update the chart.

Chart data can be exported to .CSV file, for further analysis (with Excel or other charting programs)
Just select the Export button from the toolbar when you are viewing either Calc. vs. Observed, or Time Series charts, for either Flow or Transport runs. All calibration data will be exported to the CSV file (not just the selections you have defined in the Chart toolbox).