|
View Results |

  
|
|
View Results |
|
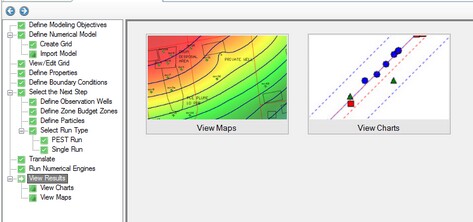
At the View Results step, you have the option to View Maps or View Charts.
Maps contains contours and color shading of heads and drawdown, and also contains MODPATH results if MODPATH was included with the model run.
Charts contains several chart types:
| · | Observed vs. Calculated Heads |
| · | Time Series |
| · | Zone Budget |
| · | Mass Balance. |