|
Surfaces |

  
|
|
Surfaces |
|
The following section describes the available style settings for Surface data objects.
To access the style settings, right-click on the surface data object in the Data Explorer, and select Settings... from the pop-up menu. Then, in the Settings dialog, expand the Style node to view the style settings.
Colors
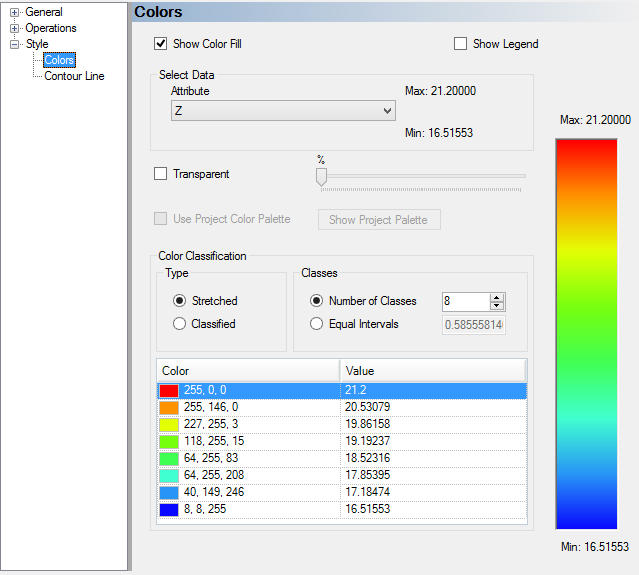
The Colors node provides options for coloring the surface layer by elevation value. The following options are available.
Show Color Fill : This option allows you to show or hide the color fill. If disabled, the surface will appear in the color defined in the General settings.
Transparency: This option allows you to make the surface appear transparent. When the Transparent checkbox is selected, use the adjacent slider bar to set the level of transparency.
Type: Select the type of gradient to use for coloring the surface. Select Stretched to use a continuous color gradient, or select Classified to use discrete color zones.
Classes: There are two options for defining the number of classes to be used: Number of Classes and Equal Intervals.
| · | Number of Classes : Specify the number of color classes in the text box. |
| · | Equal Intervals : Specify an interval spacing, and the number of classes will be determined from the range of the attribute data. For example if your data rage is 100, and you specify a 10 interval spacing, 10 classes will be created. |
As the number of intervals/classes is modified, rows are removed or added to the color table. The maximum value will always be Red and the minimum value will always be Blue, but the gradient between will change automatically depending on the specified number of classes.
Click the [Apply] button to view the changes in an active 2D- or 3D-Window.
Contour Lines

The Contour Lines node provides options for showing contour lines on the surface layer. The following options are available:
Show Contour Lines: Show/Hide the contour lines.
Show Contour Labels: Show/Hide the contour labels.
Number of Contours: Specify the number of contours to display on the surface.
Contour Interval: Set the contour increment value. When this option is used, VMOD Flex automatically calculates the number of contours used.
Line Style: Select the contour line style from the combo box. Choose between solid line or dashed line.
Line Width: Set the width (thickness) of the contour lines.
Label Spacing: Set the spacing between the contour line and the label.
Number of Decimals: Set the number of decimals to show in the contour labels.
Label Font: Select this button to specify the font settings for the contour labels.
Click the [Apply] button to view the changes in an active 2D or 3D Viewer.