|
View and Edit Boundary Conditions |

  
|
|
View and Edit Boundary Conditions |
|
With MODFLOW-USG boundary conditions are still defined at the cell-center, as with structured versions of MODFLOW. One of the biggest advantages of UnStructured grids is that the cell sizes can be much smaller around these boundary conditions, providing for a higher level of accuracy and better representation.
The other major differences lie in the way boundary condition cells are identified. With Structured MODFLOW (-2005, etc.), boundary condition cells are identified by row, column, layer, in their respective packages (.RIV, .WEL, .GHB, etc.). With MODFLOW-USG, cells are identified by a CellID; after that, the parameters remain the same as what you see for Structured MODFLOW.
|
|
The CellD label for boundary condition cells can be turned on as described below.
Display Settings
The display settings can be launched by right-clicking on the desired object in the model tree, and selecting Settings...
Boundary condition cells can be shown

The Setting window will load.
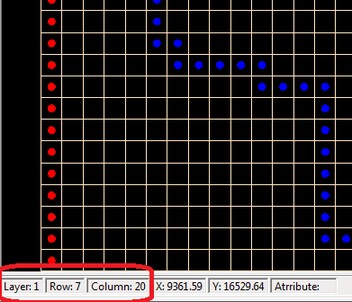
Boundary Condition cells can be drawn as Points (vertices) or following the cell geometry (Cells)
When selecting the Cells option, you will see the option "Show Cell ID labels"; turning this on will draw the Cell ID on top of the selected boundary condition cell type. This is useful if you wish to make edits to specific boundary condition attributes, as explained in the following section.
Edit Attributes
For a selected boundary condition parameter group, you can edit the parameter values in a .CSV file; this provides the ability to edit individual cells or an entire group of cells.
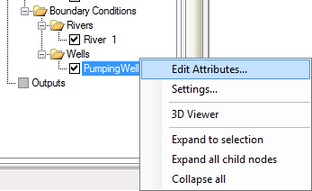
To load the list of parameter values for all cells, right-click on the desired Boundary Condition cell group from the model tree, and select "Edit Attributes...". The .CSV file will load using the default editor on your computer (for most cases, this will be Excel, but it may also include text editors). A .CSV file will load as shown below.
|
|
|
MS Excel has a limit of 1048576 rows by 16384 columns. If your model contains more than ~1 million cells, and/or more than 16384 stress periods, you will not be able to load the entire CSV file into Excel. Instead, you should do the editing in a text editor. |
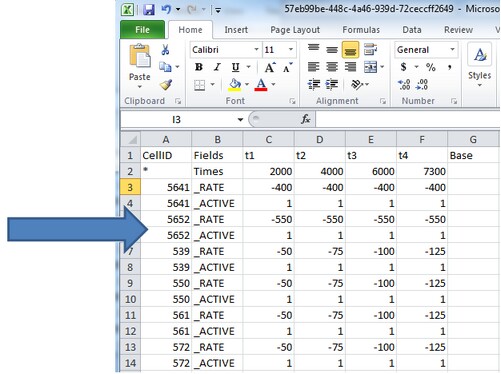
The format of this file is as follows:
| · | the first column contains the CellID |
| · | the second column contains the Fields for the selected boundary condition type; for example for the WEL package, the fields are _RATE (pumping rate) and _ACTIVE (set the boundary condition cell as active or inactive; use the value of 1 for active, and 0 for inactive |
| · | the third column contains the values for the fields for first stress period (t1, as shown in the column C header). The end time for the stress period is shown in row 2. |
| · | the fourth column contains the values for the second stress period (t2, as shown in the column D header). If the parameter values for boundary condition are constant (ie. for a steady-state model), then you will not see any additional columns. |
In the example above, there are 4 stress periods (indicated by t4); for a specific well cell (let's pick the first one, 5641), there are two rows in the .CSV file, since you can edit the _RATE field and _ACTIVE field for each stress period.
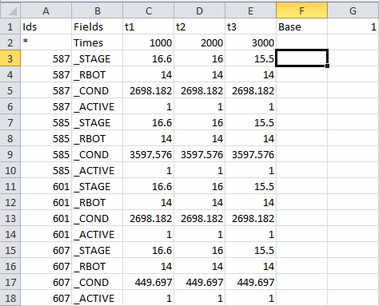
The number of fields in the file will change based on the selected boundary condition type. An example for River boundaries, with the fields _Stage, _Rbot, _Cond, is shown below:
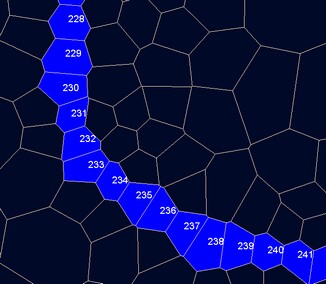
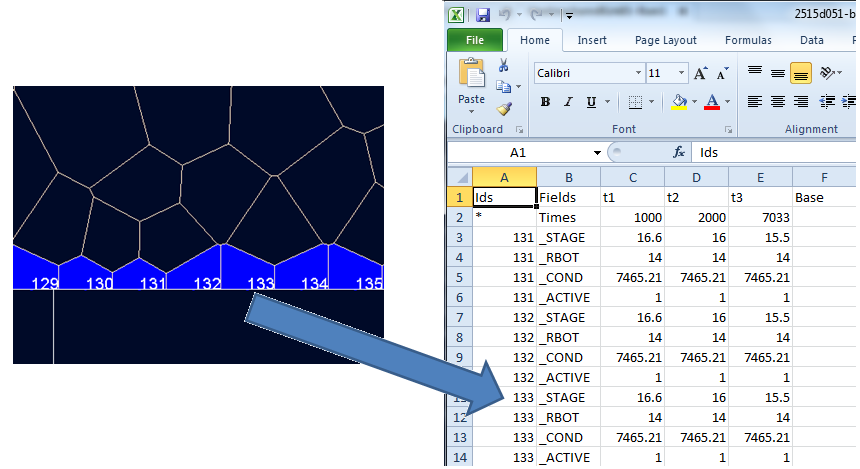
While you are editing the attribute values, you can use the "Show CellID labels" option for the selected group of boundary condition cells (as described in the Display Settings above), to help you identify the spatial location of a cell that you are editing. An example is shown below, for river cell ID = 133, and the corresponding field values in the .CSV.
The following "edits" are possible when adjusting the .CSV file:
| · | Add or Remove stress periods; simply add/remove the desired columns, then be sure to define an end time, and valid parameter values for all cells. |
| · | Edit the end time for existing stress periods |
| · | Add or remove cells from the selected BC Cell zone. (add/remove the desired rows, then enter field values accordingly) |
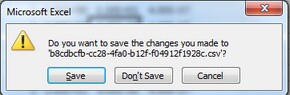
When you are done with the .CSV file, save the changes and close the file. If you are using Excel as your .CSV editor, you may encounter the following warning when saving. Click Yes to continue.
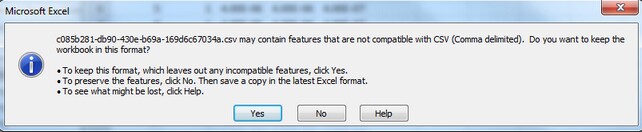
The file will then be saved. Upon exiting MS Excel, you may get prompted again to Save the file; since the file was already saved, it is not necessary to save again, so just click "Don't Save"