|
View and Edit Properties |

  
|
|
View and Edit Properties |
|
This step allows you to adjust the display and rendering of the USG cells, and also edit the attributes of individual cells or zones.
For a saturated groundwater flow model, there are three parameter groups: Conductivity, Storage, and Initial Heads. By default, hydraulic conductivity will be displayed, and rendered by the ZoneID. In order to see another parameter group, you need to turn off (remove the check box beside) Conductivity from the tree, and turn on (place a check box beside) the new desired parameter group (eg. Initial Heads).
Conductivity, Storage, and InitialHeads are their own data object on the model tree. You can right click on each one to load the Settings (adjust appearance) and Edit parameter values for individual cells, or a group of cells. This is explained in the following sections.
Most of the display settings for a 3D UnStructured grid for properties are the same as what you have for a 3D Structured (Finite Difference) grid; these are explained in the settings section, see 3D Gridded Data
The following is a list of the differences for MODFLOW-USG grids
| · | Under Cells, there is no option for "Show Only Borders" |
| · | For Lines, there is no option for "Show Only Grid Frame" |
| · | For Slice, there is an option "Show Cell ID Labels"; this will insert the MODFLOW-USG CellID for each cell, for the selected slice. This will be useful if you want to adjust the numerical values for single cells (or a group of cells) using the Edit option described below. |
| · | For Slice, the slice position for cross-sectional slices is based on a virtual grid; the UnStructured grid is divided into 100 equally spaced rows and columns. You can display cross-sections through the USG, as "rows" or "columns", at positions from 1 - 100. Row 1 corresponds to the Y minimum in your model domain, whereas Row 100 corresponds to the Y maximum in your model domain. Column 1 corresponds to the X minimum in your model domain, whereas Column 100 corresponds to the X maximum in your model domain. The layer convention follows the MODFLOW notation, where Layer 1 is at the top. |
| · | For Colormap, the positions are similar as to what you have for Slice described above. The option to display colormap along an arbitrary Cross-section line is currently not supported. For Colormap, there is an additional Slice Type, "Horizontal", which allows for rendering on a flat horizontal plane. In this case, you define the vertical position (shift) of this Horizontal plane, on a location from 1 - 100. Vertical Shift of 1 corresponds to the Z minimum in your model domain, whereas a shift of 100 corresponds to the Z maximum in your model domain. Only active cells in the model domain will be drawn. |
| · | For Isolines (contour lines), the settings for selecting the plane for drawing the isolines are similar to described for Colormap above. |
Edit Attributes
For a selected parameter group, you can edit the parameter values in a .CSV file; this provides the ability to edit individual cells or an entire group of cells.
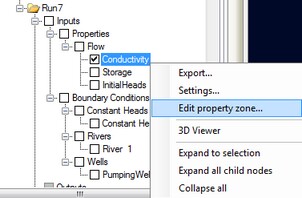
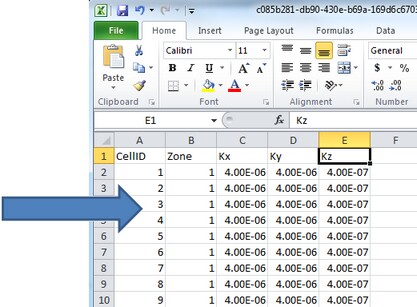
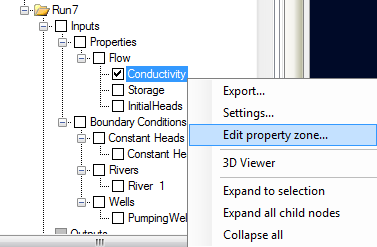
To load the list of parameter values for all cells, right-click on the desired Property parameter group (data object) from the model tree, and select "Edit Property Zone". The .CSV file will load using the default editor on your computer (for most cases, this will be Excel, but it may also include text editors). A .CSV file will load as shown below.
|
|
|
MS Excel has a limit of 1048576 rows by 16384 columns. If your model contains more than ~1 million cells, you will not be able to load the entire CSV file into Excel. Instead, you should do the editing in a text editor. |
The format of this file is pretty simple: each row corresponds to a specific CellID, and for each you will see the property zone that it belongs to, and the corresponding parameter values. When making edits to this file, do not rename the column headers, or change any of the CellIDs in the first column. You can change the zone to which a cell belongs, and also adjust parameter values.
Other guidelines
| · | ZoneID must be an integer |
| · | Parameter values should follow the MODFLOW requirements (eg. Kx must be greater than 0, Porosity must be 0 < 1, etc. |
| · | Do not add or remove any rows to this file; each cell will have a Zone assigned to it (either one you created or the default zone values). |
If you adjust the sorting or order of the rows (or apply filters in Excel), you need to undo these style changes and restore the file back to its original appearance once you are finished with the edits.
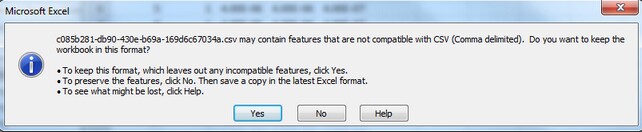
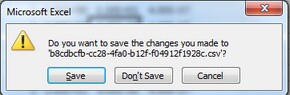
When you are done with the .CSV file, save the changes and close the file. If you are using Excel as your .CSV editor, you may encounter the following warning when saving. Click Yes to continue.
The file will then be saved. Upon exiting MS Excel, you may get prompted again to Save the file; since the file was already saved, it is not necessary to save again, so just click "Don't Save"
Export
Any of the model properties can be exported to shapefile for further post-processing; see Export for more details.