|
Define Properties |

  
|
|
Define Properties |
|
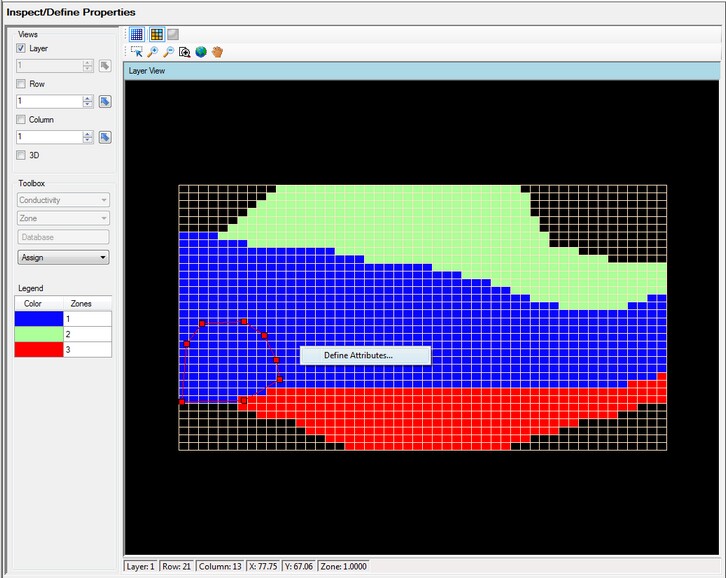
At this step, you can view/edit and define the flow properties for the model.
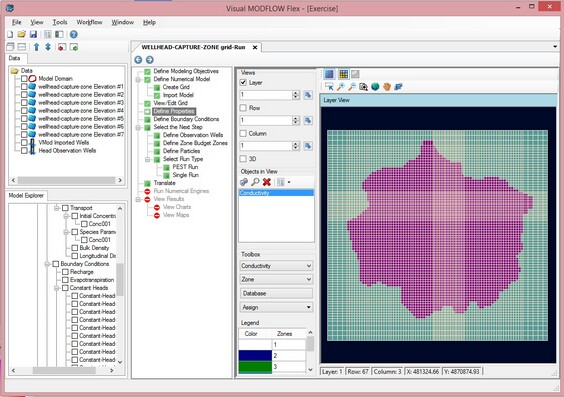
| · | Under the Toolbox, use the combo box to select from the various Property Groups: |
| · | For flow models, the groups include: Conductivity, Initial Heads, and Storage. |
| · | When transport is included with your model, the additional groups include: Bulk Density, Initial Concentration (for each Species), Longitudinal Dispersion, and Species Parameters (for each Species); the required parameters depend on what Sorption and Reaction options you have defined in the modeling objectives. For more details on the required flow and transport parameters for each category, please see section: Background on Flow and Transport Properties |
| · | For each parameter group, you can choose to render by Zones or by a selected attribute. Based on your selection, the color rendering in the views will change. |
| · | Click [Database] button to see the conductivity zones that exist in your model. |
| · | Use the same tools as described in the previous step to manipulate the views. |
| · | The display tools will allow you to switch from discrete cells rendering to color shading/contours (note, this is available only when you do attribute rendering, and not when you are rendering by ZoneID) |
|
Show/hide grid lines |
|
Show as cells |
|
Show as Surface |
| · | At the bottom of the display, you will see in the status bar the position of your mouse cursor in the current view (XY) grid position (Layer, Row, Column), and the Zone ID or attribute value for the selected cell. |
The different property zones are assigned and modified in VMOD Flex using an assortment of graphical tools appearing on the side menu bar of each Properties screen.
| · | [Database] : View and edit the property zone values. |
Each of these tools are described in the following sections
For more details on the required flow and transport parameters for each category, please see section: Background on Flow and Transport Properties
Database
The [Database] button loads the property database window as shown in the following figure. The database window is used for viewing and editing the parameter values and settings for all property zones in the model. The functionality and settings for the property zones are described below
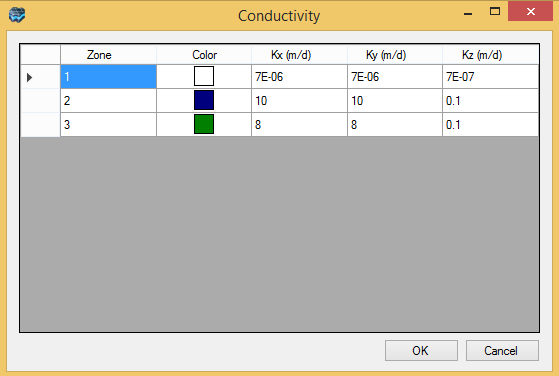
Each row of the property database table contains information about each of the model property zones including:
| · | Zone number and associated color |
| · | Zone parameter values |
The zone parameter values can be modified by simply entering a new value in the desired field.
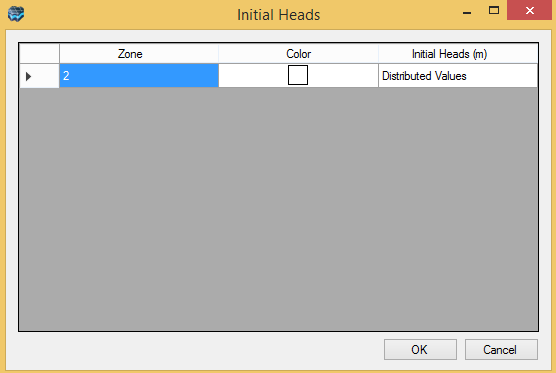
If you are using distributed (range of values) for a parameter zone, you will see "Distributed Values" in the field. An example is below. (When you define property zones using Surfaces or 3D Gridded Data sets, this will result in a "Distributed Property Zone")
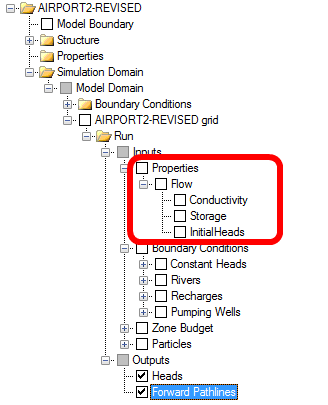
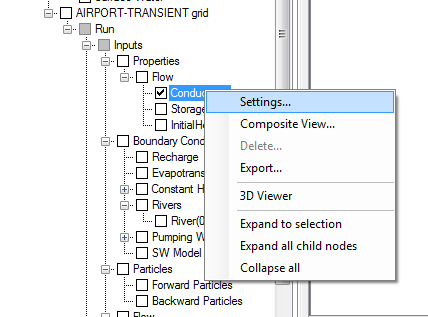
Each group of flow properties exists as a separate item in the model tree, as shown below.
Right click on each node, and select Settings. This will allow you to modify some of the appearance of each parameter group.
In addition, each property group can be added to a stand-alone 3D view; to do this, right click and select 3D-Viewer
|
Assign
Property zone values can be assigned directly to selected numerical cells using the Assign options from the toolbox.
| · | Single: Select one or more cells with the left mouse button; a small red point will appear over the selected cell |
| · | Polyline: Draw one or more polylines to select the desired cells |
| · | Polygon: Draw one or more polygons to select the desired cells |
| · | Entire Layer: Selects the currently selected layer (all active cells) |
When you use either the Assign/Polygon or Assign/Entire Layer option, the property zone will be assigned to the numerical grid and a corresponding conceptual property zone representation will be created; this is useful when you re-run the Conceptual to Numerical Conversion option for the current (or new) numerical grid.
However, when you use the Assign/Single or Assign/Polyline options, no conceptual property zone is created; please be aware of this limitation should you choose to create a new numerical model from the conceptual model; the property values in this new model run may need to be adjusted.
After you have done the desired cell selections, right click with the mouse to close the shape and select "Define Attributes" as shown below:
The Define Property Zone attributes window will appear as shown below.

In the top left, select which zone the selected cells should be assigned to (from the combo box). If you choose an existing zone, the parameter values cannot be adjusted from within this GUI (instead, select the Database option described above, to adjust parameter values for existing zones.)
Or, click the [New] button to create a new property zone. After doing this, a new zone number will be incremented. Next, select in which layers the new property zone should be generated, by default, your current layer will be selected, however you can include other layers or select all layers.
Lastly, define the "Zone Attributes" for this new property zone in the main grid. There are several "Methods" for defining the attributes, and these include Constant Value and Use Surface (Use 3DGridded Data and Use Shape Data are not applicable for this scenario).
Constant Value
The Constant Value method is selected by default for each parameter in the data input grid and allows you to specify a spatially constant value for the parameter. Replace the default value with a new value.
Use Surface
The Use Surface method allows you use an existing surface data object to define spatially-variable attribute values. This is ideal if you have a Surfer .GRD or ESRI ASCII GRD file containing parameter values. Follow the steps below:
| · | Select "Surface" as the method from the combo box. You should then see the |
| · | From the Data Explorer, select the desired surface data object |
| · | Click the |
Once you are finished, click OK and the new property zone will be created. (note, when you view the Database values for this new property zone, it will show "Distributed Values" since it contains a range of values for this zone, not just a single value)
Use 3D Gridded Data
You may want to define initial concentrations from a .UCN file from a previous transport run. In order to use this option, you must need to import the .UCN file to the project, as a "3D Gridded Data" set. Follow these steps in the section "Import 3D Gridded Data". Once the file is imported, you select this object when defining the properties.
| · | Use assign polygon or entire layer, to select the desired group of cells |
| · | Click the [New] button to create a new zone. |
| · | Select "Use 3D Gridded Data" as the method from the combo box. |
| · | You should then see the |
| · | From the Data Explorer, select the desired 3D Gridded Data (which contains the imported .UCN file) |
| · | Click the |
| · | By default, Concentration should be selected in the "Mapping" column (you may need to re-select this from the combo box). |
| · | Once you are finished, click OK and the new property zone will be created. |
| · | You can view the Initial Concentration rendering for the full 3D grid, by changing the rendering type from "Zone" to "Initial Concentration" |
(note, when you view the Database values for this new property zone, it will show "Distributed Values" since it contains a range of values for this zone, not just a single value)
The style settings of either the 2D or 3D views can be adjusted.
First make the desired property group selected and visible in the Flex Viewer.
Make the desired 2D viewer active
Then right-click on the desired property group in the tree as shown below and select `Settings`.
The 2D Colors and Contour line settings can be adjusted. For more details, see Color and Contour settings
Any of the model properties can be exported to shapefile; see Export for more details.